United States (US) Chlorine Market Outlook | Companies, Growth, Size, Trends, Industry, Forecast, Analysis, Value, COVID-19 IMPACT, Share & Revenue
Market Forecast By Application (EDC/PVC, Isocyanates and Oxygenates, Chloromethanes, Solvents and Epichlorohydrin, Inorganic Chemicals, Other Applications), By End-user Industry (Water Treatment, Pharmaceutical, Chemicals, Paper and Pulp, Plastic, Pesticides, Other End-user Industries) And Competitive Landscape
| Product Code: ETC191233 | Publication Date: May 2022 | Updated Date: Nov 2025 | Product Type: Market Research Report | |
| Publisher: 6Wresearch | Author: Shubham Deep | No. of Pages: 60 | No. of Figures: 40 | No. of Tables: 7 |
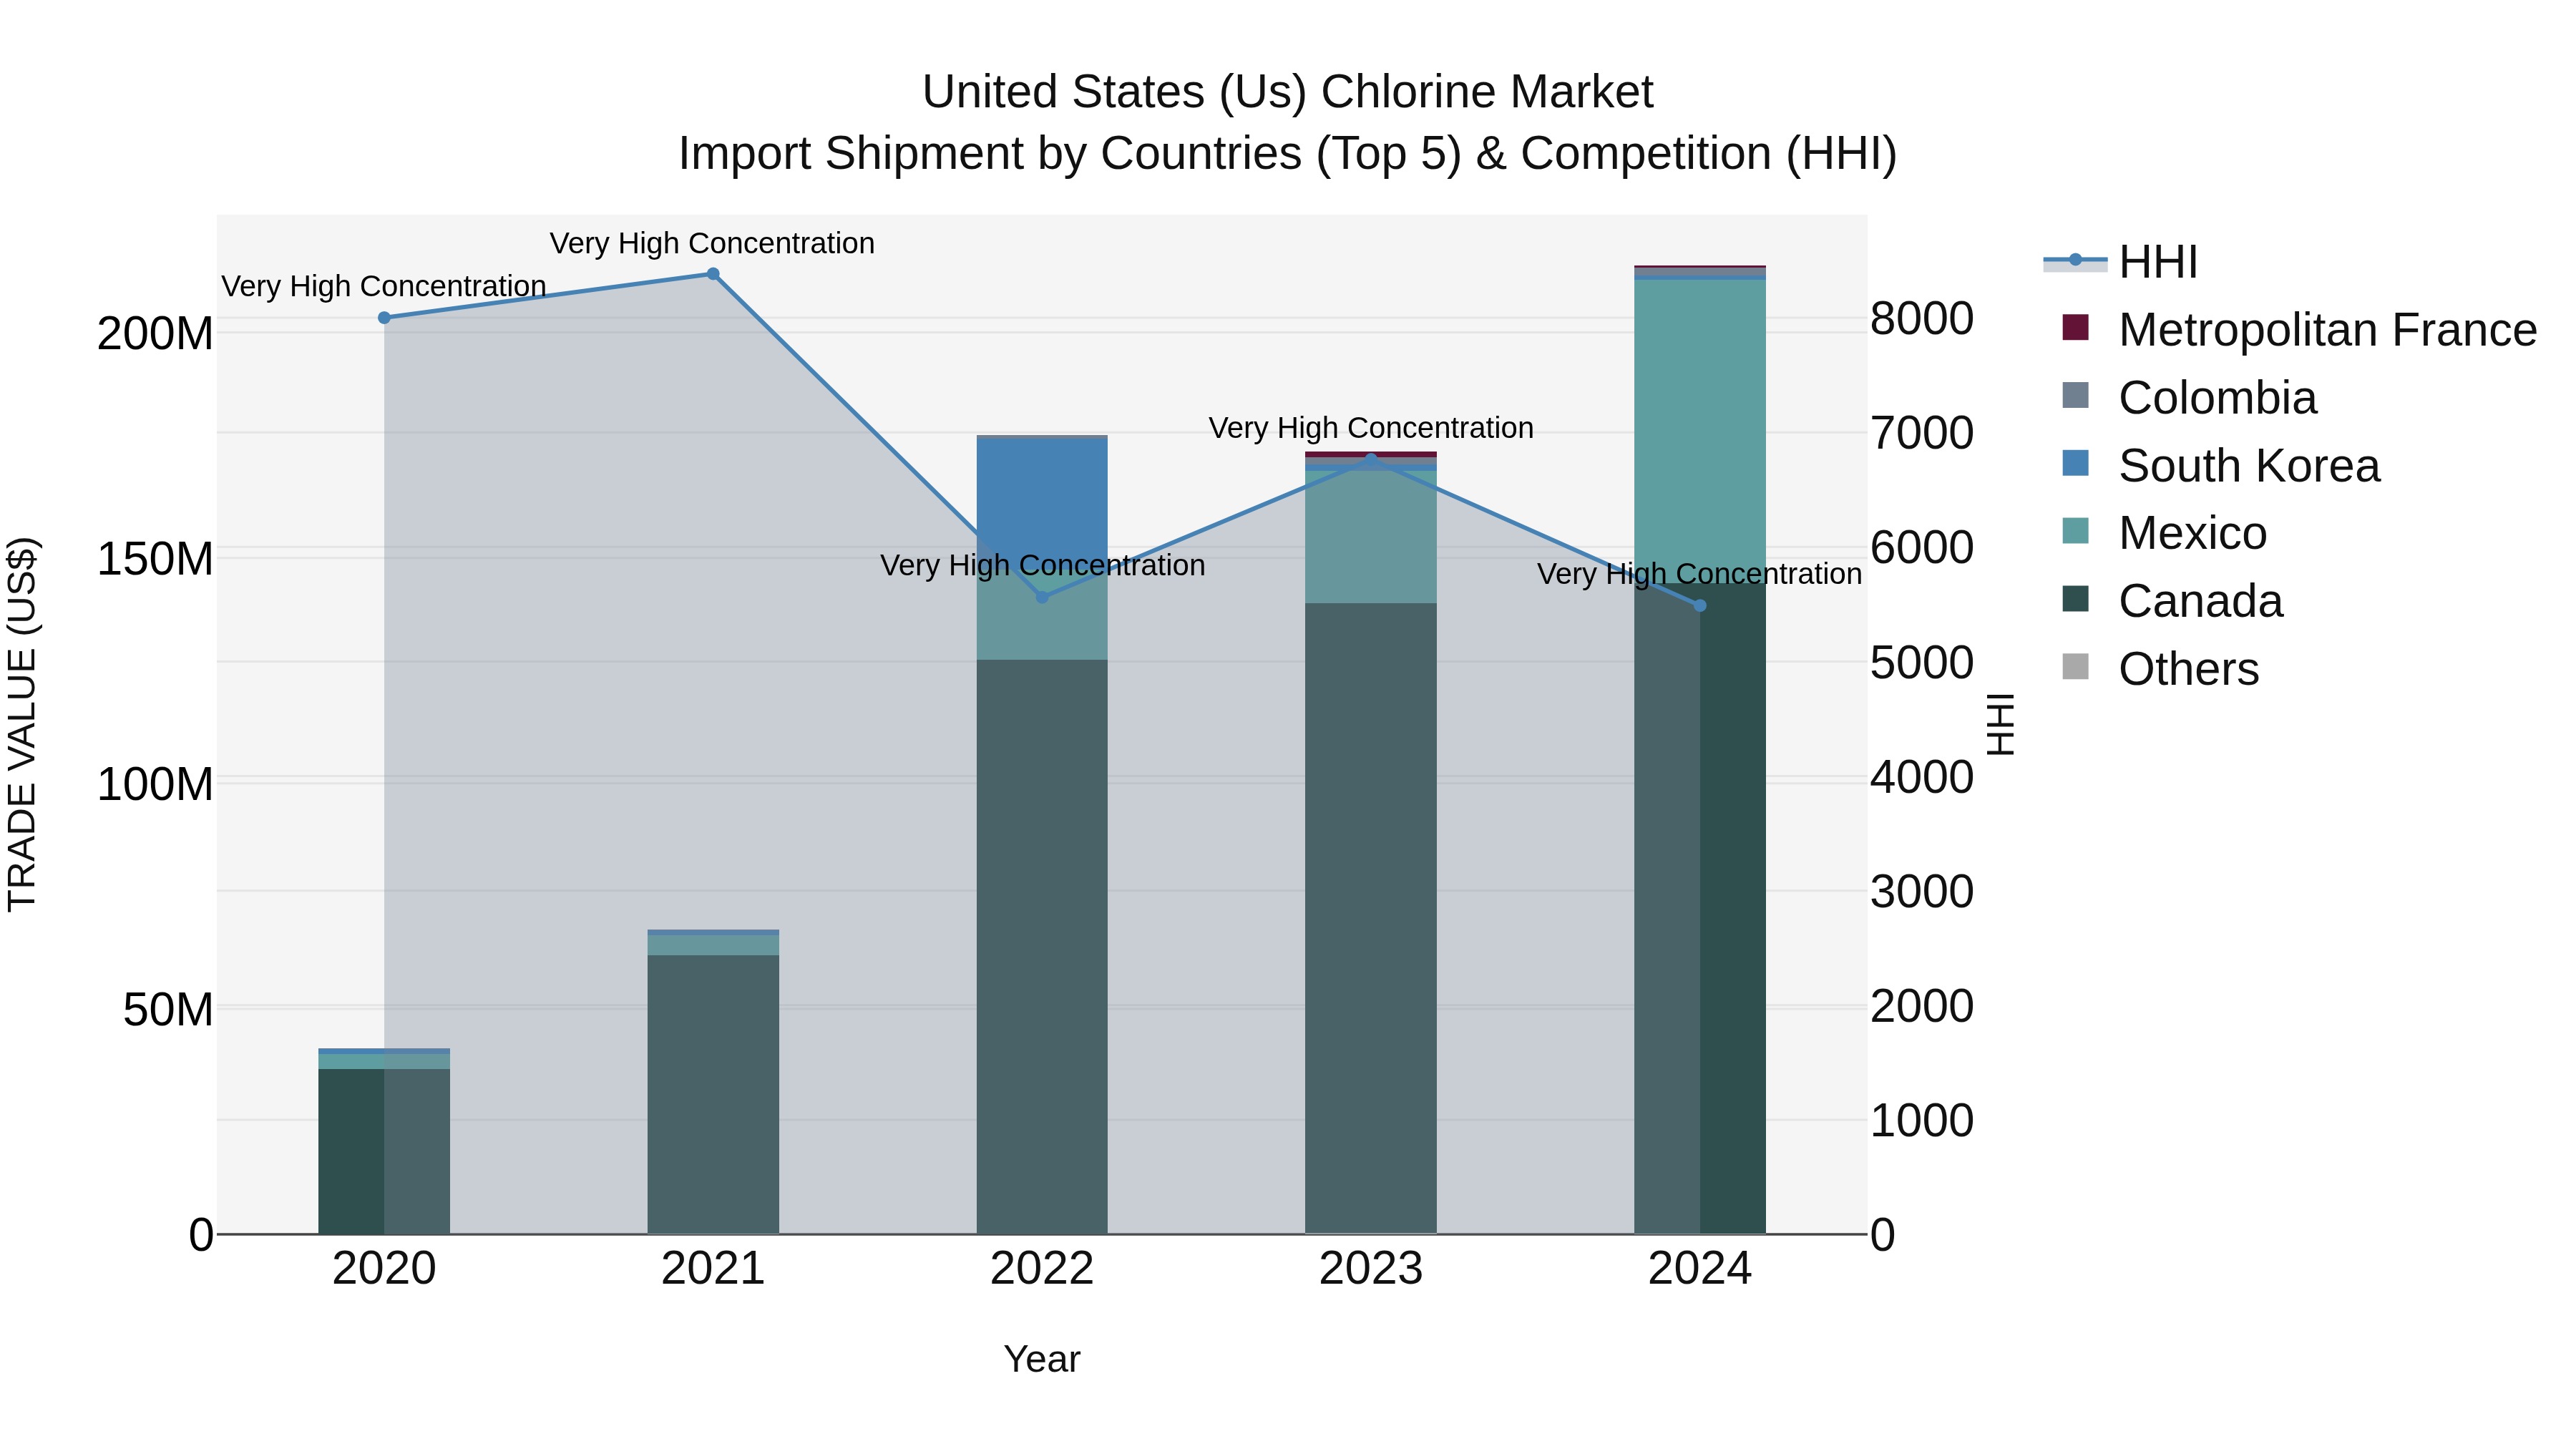
United States (US) Chlorine Market Top 5 Importing Countries and Market Competition (HHI) Analysis
The United States continued to be a significant importer of chlorine in 2024, with top exporting countries including Canada, Mexico, Colombia, South Korea, and Metropolitan France. The market concentration, measured by the Herfindahl-Hirschman Index (HHI), remained very high, indicating dominance by a few key suppliers. The compound annual growth rate (CAGR) from 2020 to 2024 was an impressive 51.11%, with a notable growth rate of 23.79% from 2023 to 2024. This data suggests a strong demand for chlorine in the U.S., driven by various industries and applications.
USA Export Potential Assessment For Chlorine Market (Values in USD Thousand)
United States (US) Chlorine Market Overview
The United States Chlorine Market is a prominent sector within the chemical industry, driven by its wide range of applications across various sectors such as water treatment, pharmaceuticals, agriculture, and manufacturing. The market is primarily dominated by key players like Occidental Petroleum Corporation, Olin Corporation, and Westlake Chemical Corporation. The demand for chlorine is projected to witness steady growth due to its critical role in disinfection, sanitation, and the production of various chemicals. However, environmental concerns regarding the use of chlorine and stringent regulations regarding its disposal and handling pose challenges to market growth. Technological advancements in chlorine production and increasing investments in sustainable practices are expected to shape the future of the US Chlorine Market.
United States (US) Chlorine Market Trends
The US Chlorine Market is currently experiencing a trend towards sustainable and eco-friendly chlorine production methods. With increasing awareness of environmental concerns, companies are focusing on adopting cleaner production processes such as membrane cell technology and electrolysis, which reduce the carbon footprint of chlorine production. Additionally, there is a growing demand for chlorine-based products in various industries including water treatment, pharmaceuticals, and agriculture. As the economy continues to recover post-pandemic, the construction sector is also driving demand for chlorine as a key component in PVC production. Overall, the US Chlorine Market is witnessing a shift towards sustainability and innovation in production methods to meet the increasing demand while minimizing environmental impact.
United States (US) Chlorine Market Challenges
In the United States Chlorine Market, there are several challenges that industry players face. One significant challenge is the increasing regulations and scrutiny regarding the environmental impact of chlorine production and its byproducts. This includes stricter emissions standards and waste disposal regulations, which can require costly upgrades to facilities to comply. Another challenge is the volatility of raw material prices, as chlorine production relies heavily on feedstocks such as salt and electricity. Fluctuations in these input costs can impact profit margins and overall competitiveness in the market. Additionally, competition from alternative water treatment methods and disinfectants poses a threat to the demand for chlorine products. Adapting to these challenges through innovation, sustainable practices, and strategic market positioning is crucial for companies operating in the US Chlorine Market.
United States (US) Chlorine Market Investment Opportunities
The United States Chlorine Market offers lucrative investment opportunities in the production and distribution of chlorine-based products such as PVC, water treatment chemicals, and bleach. With the increasing demand for clean water supply, the water treatment segment is poised for significant growth, creating opportunities for companies involved in chlorine production. Additionally, the construction industry`s reliance on PVC for various applications like piping and construction materials further drives the demand for chlorine. Investing in innovative technologies for chlorine production, sustainable manufacturing practices, and expanding product portfolios to cater to diverse industries can be strategic moves in capitalizing on the growth potential of the US Chlorine Market. However, investors should closely monitor regulatory developments, environmental concerns, and fluctuations in raw material prices to make informed investment decisions in this sector.
United States (US) Chlorine Market Government Policy
In the United States, the chlorine market is regulated by several government policies aimed at ensuring public health and environmental protection. The Environmental Protection Agency (EPA) sets limits and guidelines for chlorine emissions and discharge into water bodies to prevent harmful effects on aquatic life and human health. Additionally, the Occupational Safety and Health Administration (OSHA) enforces regulations to protect workers handling chlorine in industrial settings. The Clean Water Act and Safe Drinking Water Act also play key roles in regulating chlorine use and disposal to safeguard water quality across the country. Overall, these government policies are crucial in maintaining safe and sustainable practices within the US chlorine market.
United States (US) Chlorine Market Future Outlook
The United States Chlorine Market is expected to witness steady growth in the coming years, driven by the increasing demand from various end-use industries such as water treatment, chemical manufacturing, and pharmaceuticals. The market is likely to benefit from the growth in infrastructure development and urbanization, leading to a rising need for clean water and sanitation systems. Additionally, the expanding industrial sector and a growing emphasis on maintaining hygiene standards are expected to further boost the demand for chlorine products. However, environmental regulations regarding the use and disposal of chlorine may pose challenges for market growth, driving the need for sustainable and eco-friendly alternatives. Overall, technological advancements and strategic collaborations within the industry are projected to drive innovation and support the continued growth of the US Chlorine Market.
Key Highlights of the Report:
- United States (US) Chlorine Market Outlook
- Market Size of United States (US) Chlorine Market, 2021
- Forecast of United States (US) Chlorine Market, 2031
- Historical Data and Forecast of United States (US) Chlorine Revenues & Volume for the Period 2018 - 2031
- United States (US) Chlorine Market Trend Evolution
- United States (US) Chlorine Market Drivers and Challenges
- United States (US) Chlorine Price Trends
- United States (US) Chlorine Porter's Five Forces
- United States (US) Chlorine Industry Life Cycle
- Historical Data and Forecast of United States (US) Chlorine Market Revenues & Volume By Application for the Period 2018 - 2031
- Historical Data and Forecast of United States (US) Chlorine Market Revenues & Volume By EDC/PVC for the Period 2018 - 2031
- Historical Data and Forecast of United States (US) Chlorine Market Revenues & Volume By Isocyanates and Oxygenates for the Period 2018 - 2031
- Historical Data and Forecast of United States (US) Chlorine Market Revenues & Volume By Chloromethanes for the Period 2018 - 2031
- Historical Data and Forecast of United States (US) Chlorine Market Revenues & Volume By Solvents and Epichlorohydrin for the Period 2018 - 2031
- Historical Data and Forecast of United States (US) Chlorine Market Revenues & Volume By Inorganic Chemicals for the Period 2018 - 2031
- Historical Data and Forecast of United States (US) Chlorine Market Revenues & Volume By Other Applications for the Period 2018 - 2031
- Historical Data and Forecast of United States (US) Chlorine Market Revenues & Volume By End-user Industry for the Period 2018 - 2031
- Historical Data and Forecast of United States (US) Chlorine Market Revenues & Volume By Water Treatment for the Period 2018 - 2031
- Historical Data and Forecast of United States (US) Chlorine Market Revenues & Volume By Pharmaceutical for the Period 2018 - 2031
- Historical Data and Forecast of United States (US) Chlorine Market Revenues & Volume By Chemicals for the Period 2018 - 2031
- Historical Data and Forecast of United States (US) Chlorine Market Revenues & Volume By Paper and Pulp for the Period 2018 - 2031
- Historical Data and Forecast of United States (US) Chlorine Market Revenues & Volume By Plastic for the Period 2018 - 2031
- Historical Data and Forecast of United States (US) Chlorine Market Revenues & Volume By Pesticides for the Period 2018 - 2031
- Historical Data and Forecast of United States (US) Chlorine Market Revenues & Volume By Other End-user Industries for the Period 2018 - 2031
- United States (US) Chlorine Import Export Trade Statistics
- Market Opportunity Assessment By Application
- Market Opportunity Assessment By End-user Industry
- United States (US) Chlorine Top Companies Market Share
- United States (US) Chlorine Competitive Benchmarking By Technical and Operational Parameters
- United States (US) Chlorine Company Profiles
- United States (US) Chlorine Key Strategic Recommendations
Frequently Asked Questions About the Market Study (FAQs):
6Wresearch actively monitors the United States (US) Chlorine Market and publishes its comprehensive annual report, highlighting emerging trends, growth drivers, revenue analysis, and forecast outlook. Our insights help businesses to make data-backed strategic decisions with ongoing market dynamics. Our analysts track relevent industries related to the United States (US) Chlorine Market, allowing our clients with actionable intelligence and reliable forecasts tailored to emerging regional needs.
Yes, we provide customisation as per your requirements. To learn more, feel free to contact us on sales@6wresearch.com
1 Executive Summary |
2 Introduction |
2.1 Key Highlights of the Report |
2.2 Report Description |
2.3 Market Scope & Segmentation |
2.4 Research Methodology |
2.5 Assumptions |
3 United States (US) Chlorine Market Overview |
3.1 United States (US) Country Macro Economic Indicators |
3.2 United States (US) Chlorine Market Revenues & Volume, 2021 & 2031F |
3.3 United States (US) Chlorine Market - Industry Life Cycle |
3.4 United States (US) Chlorine Market - Porter's Five Forces |
3.5 United States (US) Chlorine Market Revenues & Volume Share, By Application, 2021 & 2031F |
3.6 United States (US) Chlorine Market Revenues & Volume Share, By End-user Industry, 2021 & 2031F |
4 United States (US) Chlorine Market Dynamics |
4.1 Impact Analysis |
4.2 Market Drivers |
4.2.1 Increasing demand for chlorine in water treatment applications |
4.2.2 Growing use of chlorine in the manufacturing of PVC and other chemicals |
4.2.3 Rising demand for chlorine-based disinfectants in the healthcare sector |
4.3 Market Restraints |
4.3.1 Regulatory restrictions on chlorine usage due to environmental concerns |
4.3.2 Volatility in raw material prices impacting chlorine production costs |
5 United States (US) Chlorine Market Trends |
6 United States (US) Chlorine Market, By Types |
6.1 United States (US) Chlorine Market, By Application |
6.1.1 Overview and Analysis |
6.1.2 United States (US) Chlorine Market Revenues & Volume, By Application, 2021-2031F |
6.1.3 United States (US) Chlorine Market Revenues & Volume, By EDC/PVC, 2021-2031F |
6.1.4 United States (US) Chlorine Market Revenues & Volume, By Isocyanates and Oxygenates, 2021-2031F |
6.1.5 United States (US) Chlorine Market Revenues & Volume, By Chloromethanes, 2021-2031F |
6.1.6 United States (US) Chlorine Market Revenues & Volume, By Solvents and Epichlorohydrin, 2021-2031F |
6.1.7 United States (US) Chlorine Market Revenues & Volume, By Inorganic Chemicals, 2021-2031F |
6.1.8 United States (US) Chlorine Market Revenues & Volume, By Other Applications, 2021-2031F |
6.2 United States (US) Chlorine Market, By End-user Industry |
6.2.1 Overview and Analysis |
6.2.2 United States (US) Chlorine Market Revenues & Volume, By Water Treatment, 2021-2031F |
6.2.3 United States (US) Chlorine Market Revenues & Volume, By Pharmaceutical, 2021-2031F |
6.2.4 United States (US) Chlorine Market Revenues & Volume, By Chemicals, 2021-2031F |
6.2.5 United States (US) Chlorine Market Revenues & Volume, By Paper and Pulp, 2021-2031F |
6.2.6 United States (US) Chlorine Market Revenues & Volume, By Plastic, 2021-2031F |
6.2.7 United States (US) Chlorine Market Revenues & Volume, By Pesticides, 2021-2031F |
7 United States (US) Chlorine Market Import-Export Trade Statistics |
7.1 United States (US) Chlorine Market Export to Major Countries |
7.2 United States (US) Chlorine Market Imports from Major Countries |
8 United States (US) Chlorine Market Key Performance Indicators |
8.1 Adoption rate of chlorine in water treatment plants |
8.2 Number of new applications utilizing chlorine in the manufacturing sector |
8.3 Sales of chlorine-based disinfectants in healthcare facilities |
8.4 Research and development investments in chlorine alternative technologies |
8.5 Environmental impact assessments and compliance levels in chlorine production facilities |
9 United States (US) Chlorine Market - Opportunity Assessment |
9.1 United States (US) Chlorine Market Opportunity Assessment, By Application, 2021 & 2031F |
9.2 United States (US) Chlorine Market Opportunity Assessment, By End-user Industry, 2021 & 2031F |
10 United States (US) Chlorine Market - Competitive Landscape |
10.1 United States (US) Chlorine Market Revenue Share, By Companies, 2021 |
10.2 United States (US) Chlorine Market Competitive Benchmarking, By Operating and Technical Parameters |
11 Company Profiles |
12 Recommendations |
13 Disclaimer |
Global Go To Market Strategy - 2030
Export potential enables firms to identify high-growth global markets with greater confidence by combining advanced trade intelligence with a structured quantitative methodology. The framework analyzes emerging demand trends and country-level import patterns while integrating macroeconomic and trade datasets such as GDP and population forecasts, bilateral import–export flows, tariff structures, elasticity differentials between developed and developing economies, geographic distance, and import demand projections. Using weighted trade values from 2020–2024 as the base period to project country-to-country export potential for 2030, these inputs are operationalized through calculated drivers such as gravity model parameters, tariff impact factors, and projected GDP per-capita growth. Through an analysis of hidden potentials, demand hotspots, and market conditions that are most favorable to success, this method enables firms to focus on target countries, maximize returns, and global expansion with data, backed by accuracy.
By factoring in the projected importer demand gap that is currently unmet and could be potential opportunity, it identifies the potential for the Exporter (Country) among 190 countries, against the general trade analysis, which identifies the biggest importer or exporter.
To discover high-growth global markets and optimize your business strategy:
Click Here
Pricing
- Single User License$ 1,995
- Department License$ 2,400
- Site License$ 3,120
- Global License$ 3,795

Leadership Perspectives from Industry Events
Search
Thought Leadership and Analyst Meet


Our Clients
6WResearch In News
- India Air Conditioner Market Set for Strong Rebound in 2026 After Weather-Led Correction and GST-Driven Recovery: 6Wresearch
- ADAS in India: How Automatic Emergency Braking, Blind Spot Detection & Driver Monitoring are Transforming Road Safety
- Doha a strategic location for EV manufacturing hub: IPA Qatar
- Demand for luxury TVs surging in the GCC, says Samsung
- Empowering Growth: The Thriving Journey of Bangladesh’s Cable Industry
- Demand for luxury TVs surging in the GCC, says Samsung
Latest Reports
- Nicaragua RPG Gaming Market (2026-2032)
- New Zealand RPG Gaming Market (2026-2032)
- Netherlands RPG Gaming Market (2026-2032)
- Nauru RPG Gaming Market (2026-2032)
- Namibia RPG Gaming Market (2026-2032)
- Mozambique RPG Gaming Market (2026-2032)
- Montenegro RPG Gaming Market (2026-2032)
- Mongolia RPG Gaming Market (2026-2032)
- Monaco RPG Gaming Market (2026-2032)
- Micronesia RPG Gaming Market (2026-2032)
Industry Events and Analyst Meet

EV India Expo 2026

HIMTEX 2026

India Refining Summit 2026

India EV Show 2026

EV tech India Expo 2026
Whitepaper
- Middle East & Africa Commercial Security Market Click here to view more.
- Middle East & Africa Fire Safety Systems & Equipment Market Click here to view more.
- GCC Drone Market Click here to view more.
- Middle East Lighting Fixture Market Click here to view more.
- GCC Physical & Perimeter Security Market Click here to view more.