United States (US) Juice Market (2026-2032) | Outlook, Industry, Trends, Share, Analysis, Size & Revenue, Competitive Landscape, Companies, Forecast, Segmentation, Value, Growth
Market Forecast By Product Type (Fruit Juice, Vegetable Juice, Nectar, Other Product Types), By Distribution Channel (Hypermarkets and Supermarkets, Convenience Stores, Online Stores, Others) And Competitive Landscape
| Product Code: ETC9968694 | Publication Date: Sep 2024 | Updated Date: Apr 2026 | Product Type: Market Research Report | |
| Publisher: 6Wresearch | Author: Vasudha | No. of Pages: 75 | No. of Figures: 35 | No. of Tables: 20 |
United States Juice Market Year-wise Growth Rate (2021-2031F)
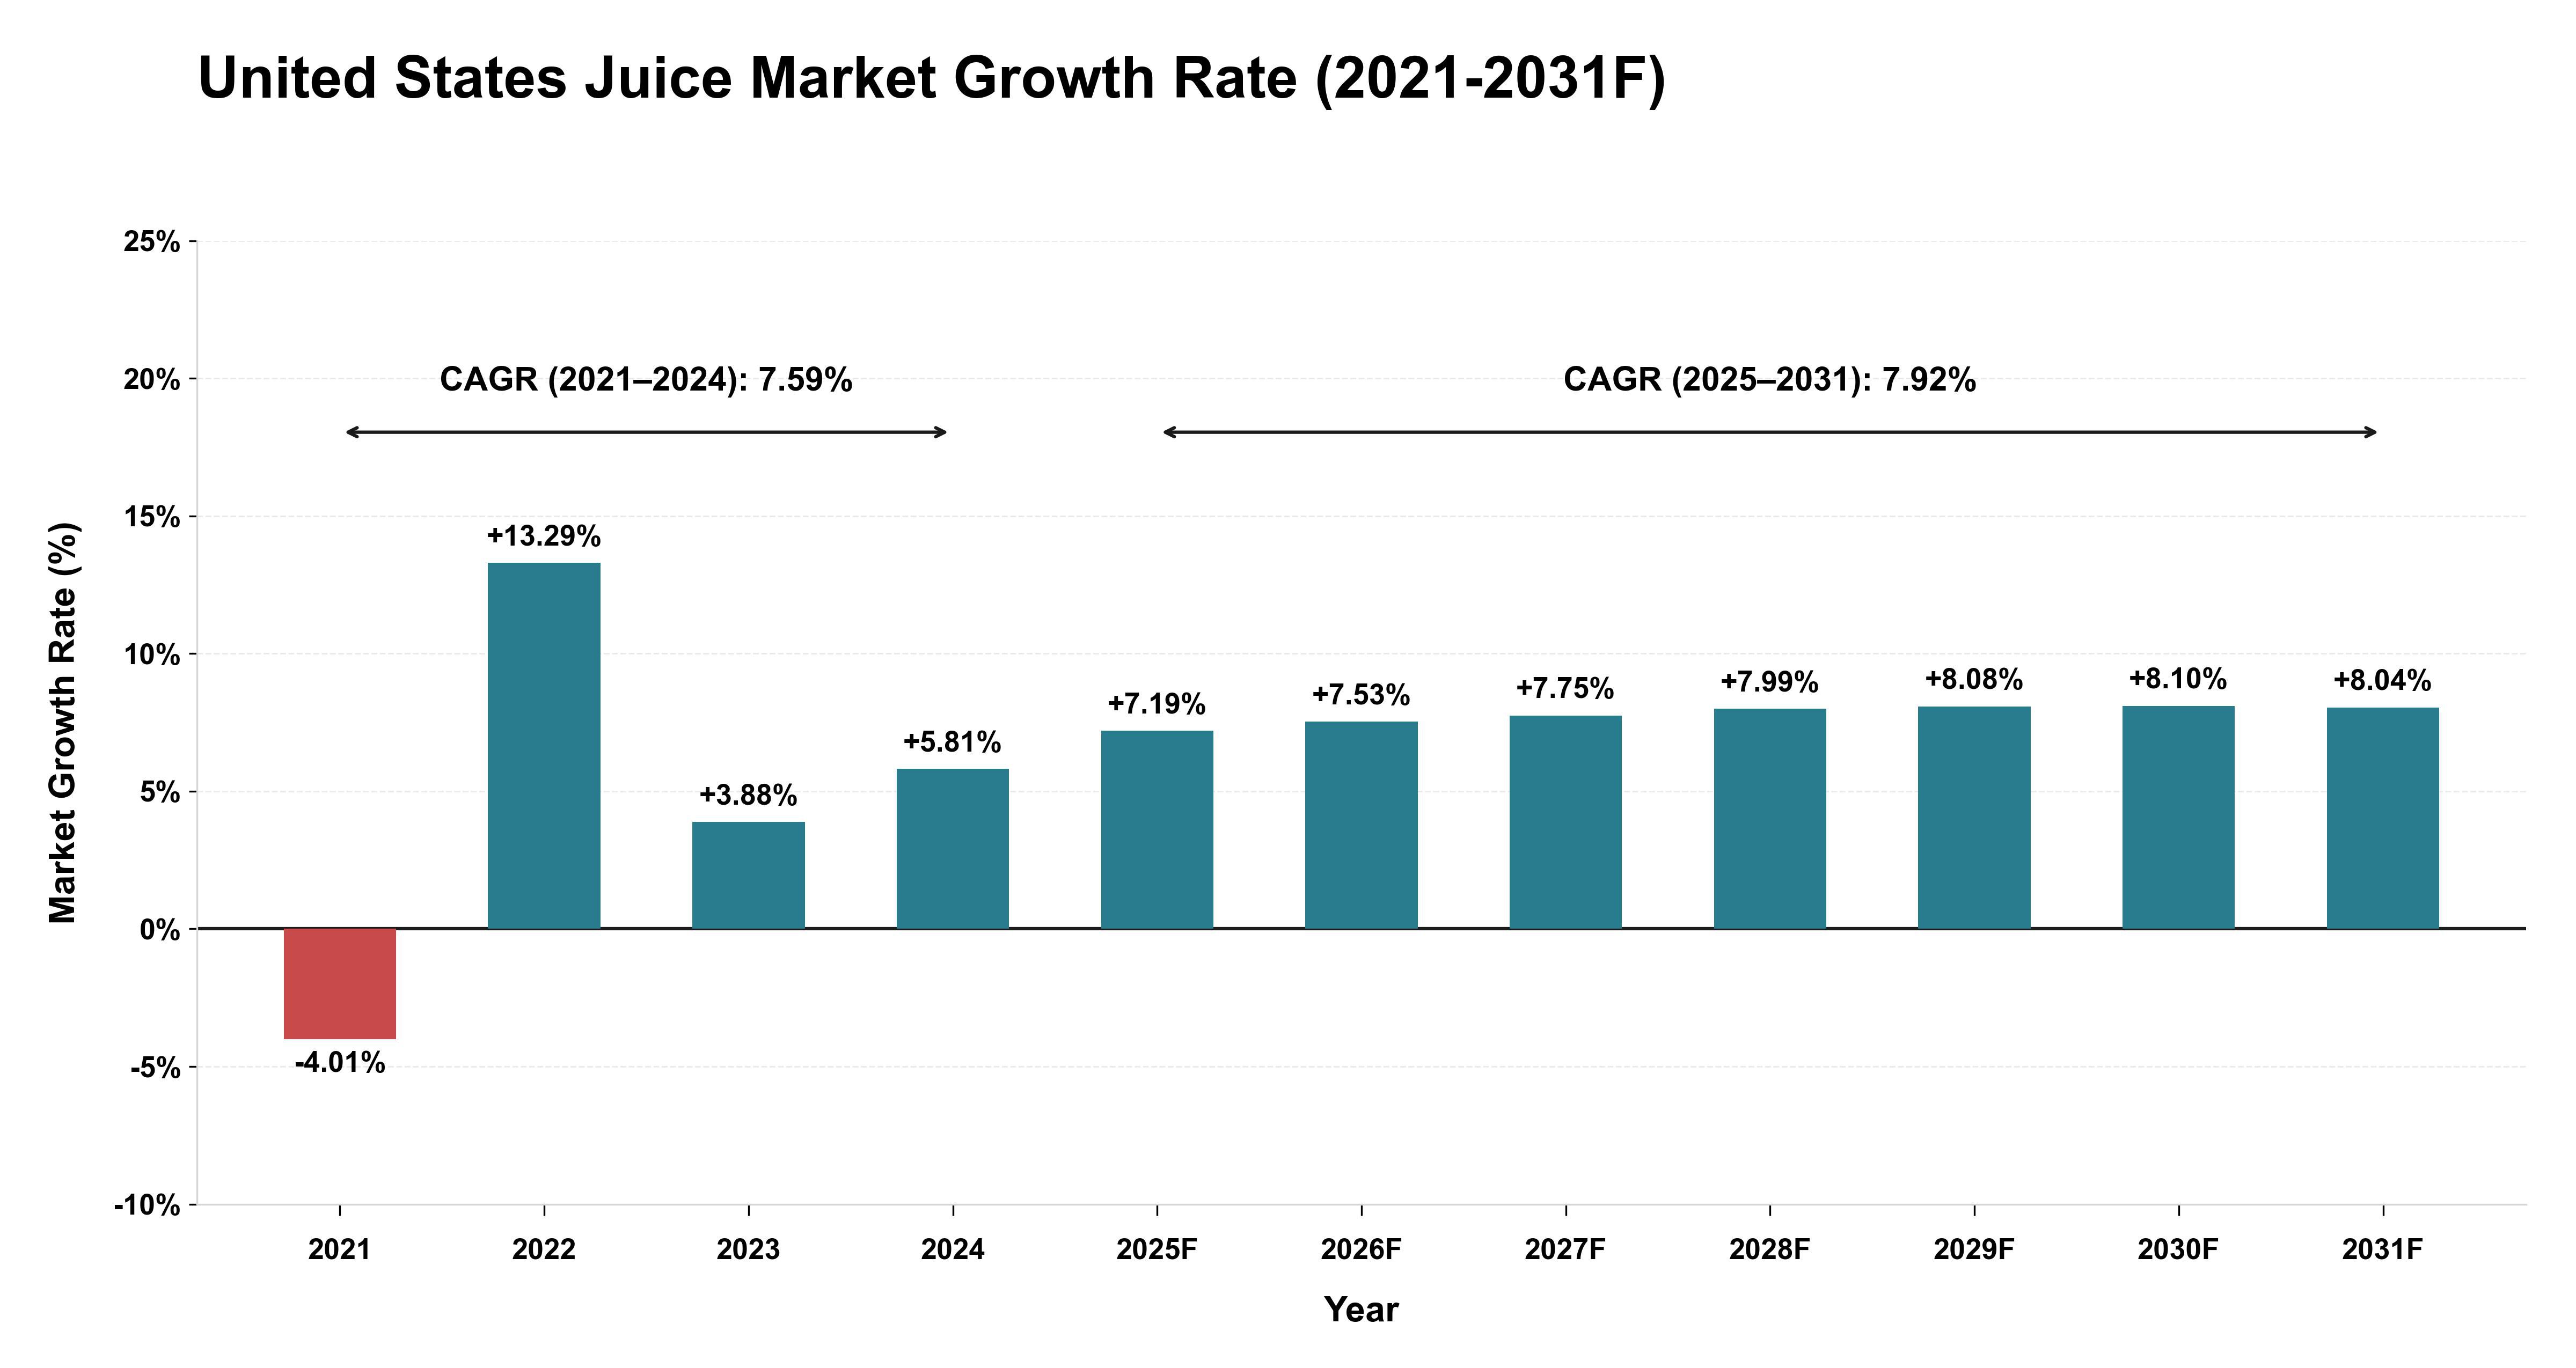
The United States Juice Market experienced a turbulent period from 2021 to 2024, marked by a sharp decline in growth of -4.01% in 2021, followed by a significant rebound with 13.29% growth in 2022. This erratic pattern stabilized with moderate growth rates of 3.88% in 2023 and 5.81% in 2024, reflecting shifting consumer preferences and supply chain disruptions impacting the end-use industries such as health and wellness, convenience, and organic products. Looking ahead to the forecast period from 2025 to 2031, the market is expected to maintain a steady growth trajectory with an increasing CAGR of 7.92%, driven by technological advancements in processing methods, health-conscious consumption patterns, and evolving regulatory standards promoting sustainability and transparency in the supply chain. The accelerating growth rates from 7.19% in 2025 to a peak of 8.10% in 2030 indicate a maturing market adapting to changing consumer demands and industry dynamics.
Key Highlights of the Report:
- United States (US) Juice Market Outlook
- Market Size of United States (US) Juice Market, 2025
- Forecast of United States (US) Juice Market, 2032
- Historical Data and Forecast of United States (US) Juice Revenues & Volume for the Period 2022 - 2032
- United States (US) Juice Market Trend Evolution
- United States (US) Juice Market Drivers and Challenges
- United States (US) Juice Price Trends
- United States (US) Juice Porter's Five Forces
- United States (US) Juice Industry Life Cycle
- Historical Data and Forecast of United States (US) Juice Market Revenues & Volume By Product Type for the Period 2022 - 2032
- Historical Data and Forecast of United States (US) Juice Market Revenues & Volume By Fruit Juice for the Period 2022 - 2032
- Historical Data and Forecast of United States (US) Juice Market Revenues & Volume By Vegetable Juice for the Period 2022 - 2032
- Historical Data and Forecast of United States (US) Juice Market Revenues & Volume By Nectar for the Period 2022 - 2032
- Historical Data and Forecast of United States (US) Juice Market Revenues & Volume By Other Product Types for the Period 2022 - 2032
- Historical Data and Forecast of United States (US) Juice Market Revenues & Volume By Distribution Channel for the Period 2022 - 2032
- Historical Data and Forecast of United States (US) Juice Market Revenues & Volume By Hypermarkets and Supermarkets for the Period 2022 - 2032
- Historical Data and Forecast of United States (US) Juice Market Revenues & Volume By Convenience Stores for the Period 2022 - 2032
- Historical Data and Forecast of United States (US) Juice Market Revenues & Volume By Online Stores for the Period 2022 - 2032
- Historical Data and Forecast of United States (US) Juice Market Revenues & Volume By Others for the Period 2022 - 2032
- United States (US) Juice Import Export Trade Statistics
- Market Opportunity Assessment By Product Type
- Market Opportunity Assessment By Distribution Channel
- United States (US) Juice Top Companies Market Share
- United States (US) Juice Competitive Benchmarking By Technical and Operational Parameters
- United States (US) Juice Company Profiles
- United States (US) Juice Key Strategic Recommendations
Frequently Asked Questions About the Market Study (FAQs):
6Wresearch actively monitors the United States (US) Juice Market and publishes its comprehensive annual report, highlighting emerging trends, growth drivers, revenue analysis, and forecast outlook. Our insights help businesses to make data-backed strategic decisions with ongoing market dynamics. Our analysts track relevent industries related to the United States (US) Juice Market, allowing our clients with actionable intelligence and reliable forecasts tailored to emerging regional needs.
Yes, we provide customisation as per your requirements. To learn more, feel free to contact us on sales@6wresearch.com
1 Executive Summary |
2 Introduction |
2.1 Key Highlights of the Report |
2.2 Report Description |
2.3 Market Scope & Segmentation |
2.4 Research Methodology |
2.5 Assumptions |
3 United States (US) Juice Market Overview |
3.1 United States (US) Country Macro Economic Indicators |
3.2 United States (US) Juice Market Revenues & Volume, 2022 & 2032F |
3.3 United States (US) Juice Market - Industry Life Cycle |
3.4 United States (US) Juice Market - Porter's Five Forces |
3.5 United States (US) Juice Market Revenues & Volume Share, By Product Type, 2022 & 2032F |
3.6 United States (US) Juice Market Revenues & Volume Share, By Distribution Channel, 2022 & 2032F |
4 United States (US) Juice Market Dynamics |
4.1 Impact Analysis |
4.2 Market Drivers |
4.2.1 Increasing health consciousness and awareness about the benefits of consuming natural and organic juices |
4.2.2 Growing demand for functional beverages with added nutrients and health benefits |
4.2.3 Innovation in product offerings, such as new flavors and packaging formats |
4.3 Market Restraints |
4.3.1 Fluctuating prices of raw materials, such as fruits and vegetables, impacting production costs |
4.3.2 Intense competition among juice manufacturers leading to price wars and margin pressures |
4.3.3 Concerns about sugar content and calorie levels in some juice products affecting consumer perception |
5 United States (US) Juice Market Trends |
6 United States (US) Juice Market, By Types |
6.1 United States (US) Juice Market, By Product Type |
6.1.1 Overview and Analysis |
6.1.2 United States (US) Juice Market Revenues & Volume, By Product Type, 2022 - 2032F |
6.1.3 United States (US) Juice Market Revenues & Volume, By Fruit Juice, 2022 - 2032F |
6.1.4 United States (US) Juice Market Revenues & Volume, By Vegetable Juice, 2022 - 2032F |
6.1.5 United States (US) Juice Market Revenues & Volume, By Nectar, 2022 - 2032F |
6.1.6 United States (US) Juice Market Revenues & Volume, By Other Product Types, 2022 - 2032F |
6.2 United States (US) Juice Market, By Distribution Channel |
6.2.1 Overview and Analysis |
6.2.2 United States (US) Juice Market Revenues & Volume, By Hypermarkets and Supermarkets, 2022 - 2032F |
6.2.3 United States (US) Juice Market Revenues & Volume, By Convenience Stores, 2022 - 2032F |
6.2.4 United States (US) Juice Market Revenues & Volume, By Online Stores, 2022 - 2032F |
6.2.5 United States (US) Juice Market Revenues & Volume, By Others, 2022 - 2032F |
7 United States (US) Juice Market Import-Export Trade Statistics |
7.1 United States (US) Juice Market Export to Major Countries |
7.2 United States (US) Juice Market Imports from Major Countries |
8 United States (US) Juice Market Key Performance Indicators |
8.1 Consumer engagement metrics, such as social media interactions, website visits, and online reviews |
8.2 Market penetration in new distribution channels, like e-commerce platforms and health food stores |
8.3 Sustainability initiatives and certifications, like organic or fair-trade accreditations for juice products |
9 United States (US) Juice Market - Opportunity Assessment |
9.1 United States (US) Juice Market Opportunity Assessment, By Product Type, 2022 & 2032F |
9.2 United States (US) Juice Market Opportunity Assessment, By Distribution Channel, 2022 & 2032F |
10 United States (US) Juice Market - Competitive Landscape |
10.1 United States (US) Juice Market Revenue Share, By Companies, 2025 |
10.2 United States (US) Juice Market Competitive Benchmarking, By Operating and Technical Parameters |
11 Company Profiles |
12 Recommendations |
13 Disclaimer |
Global Go To Market Strategy - 2030
Export potential enables firms to identify high-growth global markets with greater confidence by combining advanced trade intelligence with a structured quantitative methodology. The framework analyzes emerging demand trends and country-level import patterns while integrating macroeconomic and trade datasets such as GDP and population forecasts, bilateral import–export flows, tariff structures, elasticity differentials between developed and developing economies, geographic distance, and import demand projections. Using weighted trade values from 2020–2024 as the base period to project country-to-country export potential for 2030, these inputs are operationalized through calculated drivers such as gravity model parameters, tariff impact factors, and projected GDP per-capita growth. Through an analysis of hidden potentials, demand hotspots, and market conditions that are most favorable to success, this method enables firms to focus on target countries, maximize returns, and global expansion with data, backed by accuracy.
By factoring in the projected importer demand gap that is currently unmet and could be potential opportunity, it identifies the potential for the Exporter (Country) among 190 countries, against the general trade analysis, which identifies the biggest importer or exporter.
To discover high-growth global markets and optimize your business strategy:
Click Here
Pricing
- Single User License$ 1,995
- Department License$ 2,400
- Site License$ 3,120
- Global License$ 3,795

Leadership Perspectives from Industry Events
Search
Thought Leadership and Analyst Meet


Our Clients
6WResearch In News
- India Export Attractiveness Tracker 2026
- India Air Conditioner Market Set for Strong Rebound in 2026 After Weather-Led Correction and GST-Driven Recovery: 6Wresearch
- ADAS in India: How Automatic Emergency Braking, Blind Spot Detection & Driver Monitoring are Transforming Road Safety
- Doha a strategic location for EV manufacturing hub: IPA Qatar
- Demand for luxury TVs surging in the GCC, says Samsung
- Empowering Growth: The Thriving Journey of Bangladesh’s Cable Industry
Latest Reports
- Nicaragua RPG Gaming Market (2026-2032)
- New Zealand RPG Gaming Market (2026-2032)
- Netherlands RPG Gaming Market (2026-2032)
- Nauru RPG Gaming Market (2026-2032)
- Namibia RPG Gaming Market (2026-2032)
- Mozambique RPG Gaming Market (2026-2032)
- Montenegro RPG Gaming Market (2026-2032)
- Mongolia RPG Gaming Market (2026-2032)
- Monaco RPG Gaming Market (2026-2032)
- Micronesia RPG Gaming Market (2026-2032)
Industry Events and Analyst Meet

EV India Expo 2026

HIMTEX 2026

India Refining Summit 2026

India EV Show 2026

EV tech India Expo 2026
Whitepaper
- Middle East & Africa Commercial Security Market Click here to view more.
- Middle East & Africa Fire Safety Systems & Equipment Market Click here to view more.
- GCC Drone Market Click here to view more.
- Middle East Lighting Fixture Market Click here to view more.
- GCC Physical & Perimeter Security Market Click here to view more.