Venezuela Liquid Nitrogen Market (2026-2032) | Companies, Trends, Analysis, Revenue, Forecast, Outlook, Share, Industry, Growth, Value & Size
Market Forecast By End-Use Industry (Chemicals & pharmaceuticals, Food & beverage, Healthcare, Metal manufacturing & construction, Rubber & Plastic, Others), By Storage, Distribution and Transportation (Cylinder & packaged distribution, Merchant liquid distribution, Tonnage distribution), By Function (Coolant, Refrigerant), By Manufacturing Process (Cryogenic distillation, Pressure swing adsorption) And Competitive Landscape
| Product Code: ETC044807 | Publication Date: Jan 2021 | Updated Date: Jun 2026 | Product Type: Report | |
| Publisher: 6Wresearch | Author: Shubham Deep | No. of Pages: 70 | No. of Figures: 35 | No. of Tables: 5 |
Venezuela Liquid Nitrogen Market Summary
The venezuela liquid nitrogen market was estimated at USD 210 Million in 2025 and is projected to reach USD 291 Million by 2032, growing at a CAGR of 5.7% from 2026 to 2032.
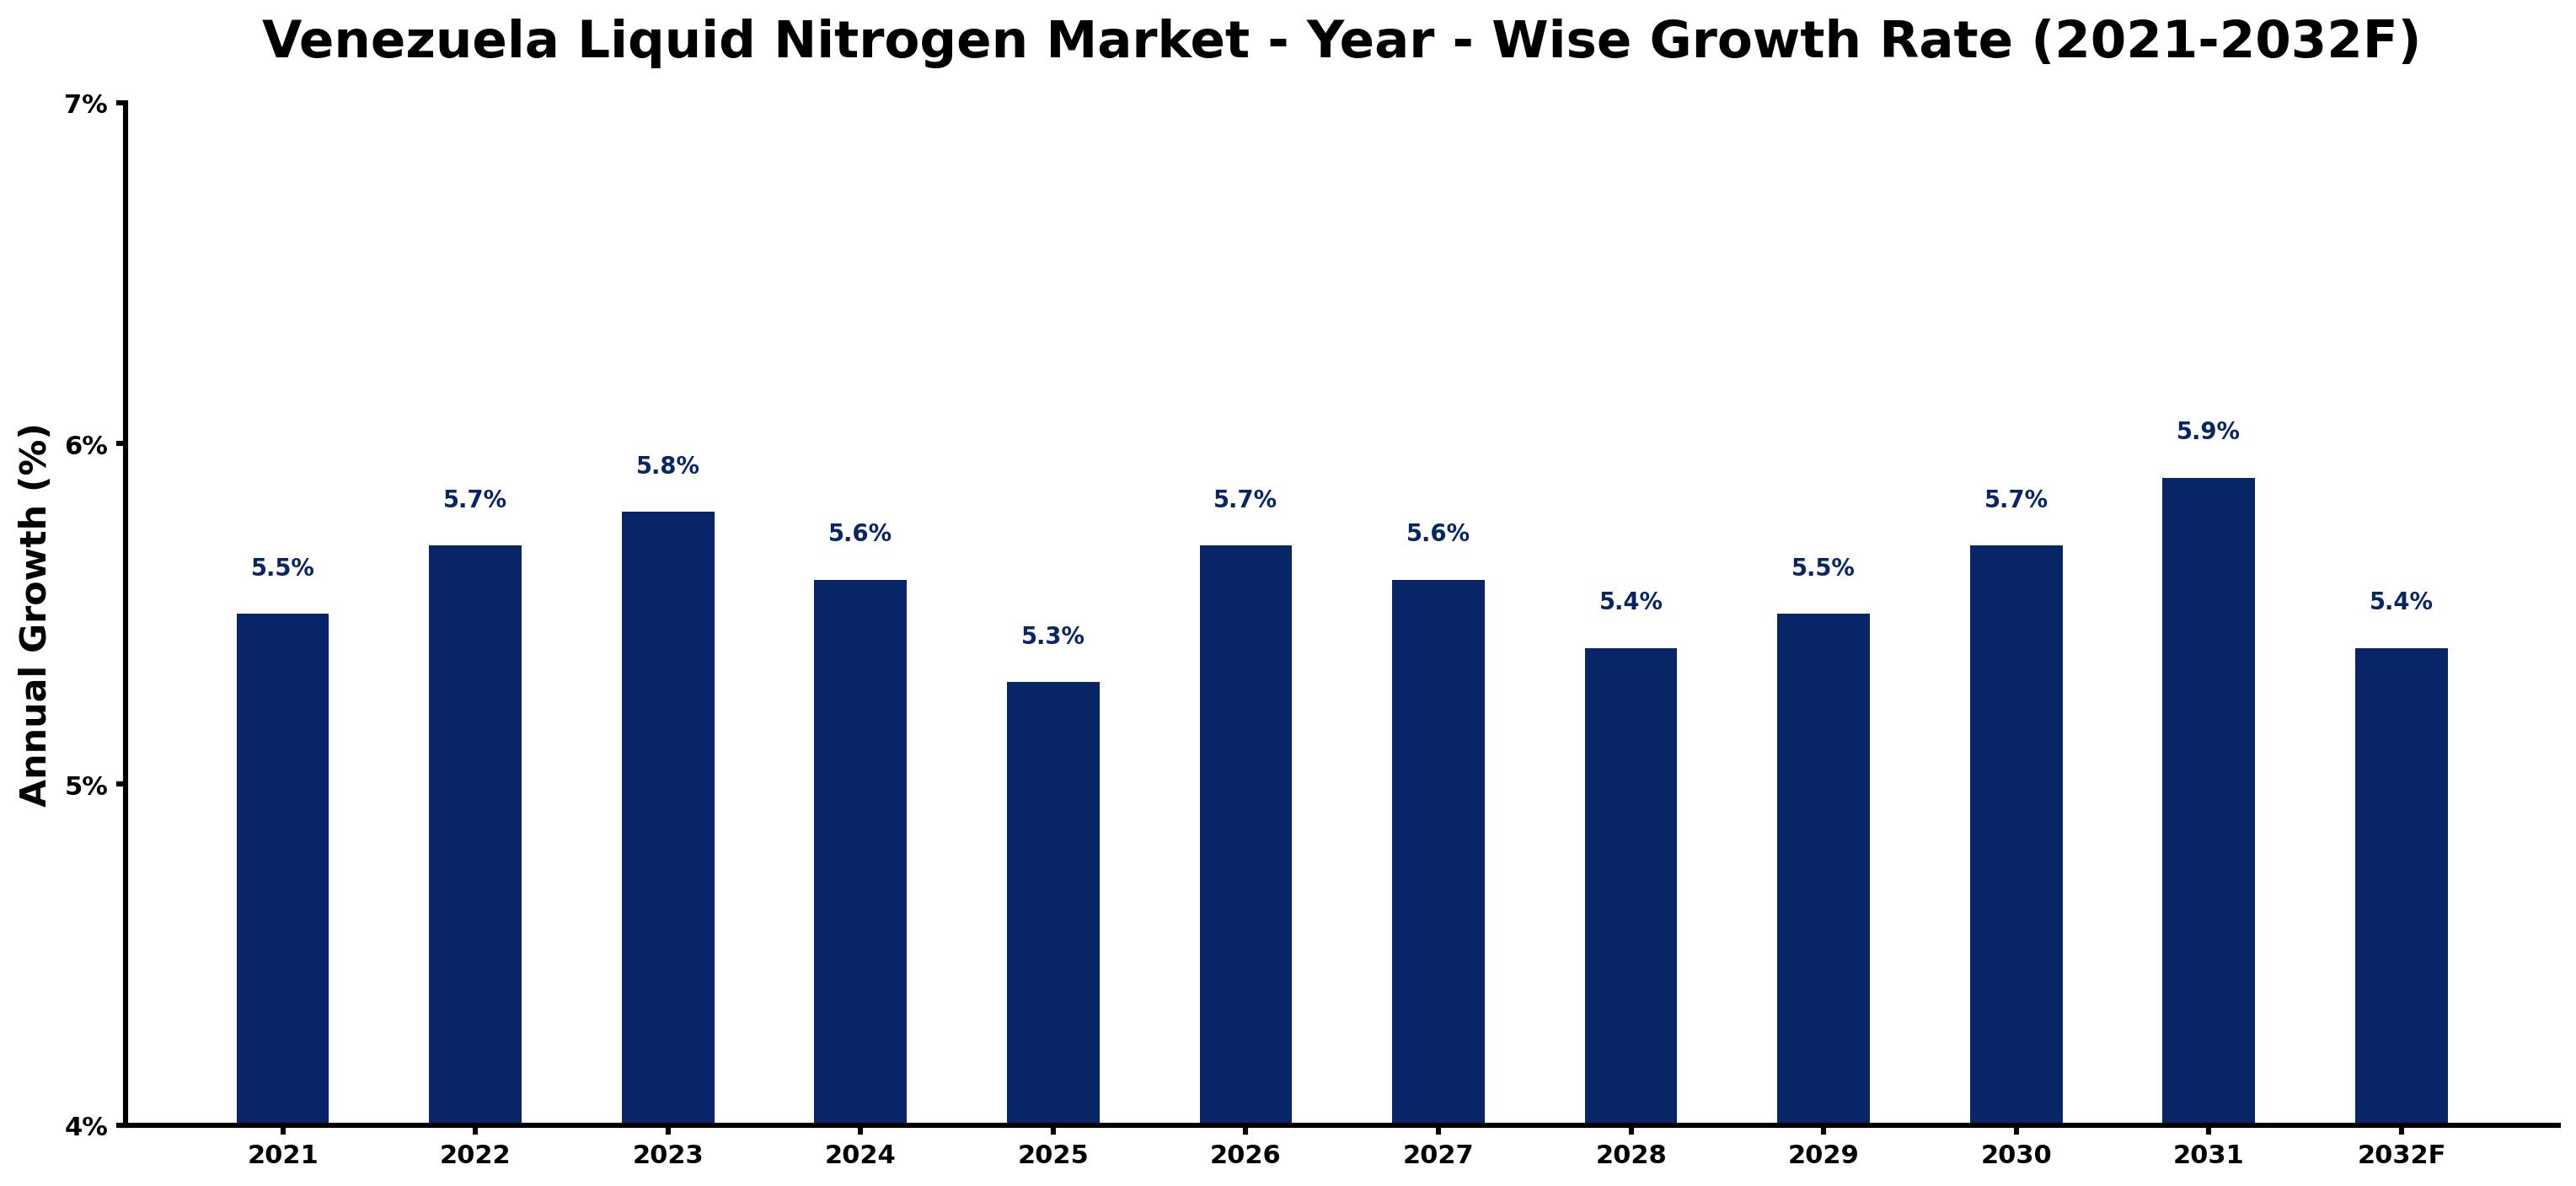
Venezuela Liquid Nitrogen Market Growth Rate Analysis (2021-2032)
The Venezuelan liquid nitrogen market has shown steady growth, with annual increases of 5.5% in 2021, rising to a notable 5.9% in 2031. This stability can be attributed to heightened demand across various sectors, including healthcare, food preservation, and industrial applications, where liquid nitrogen is instrumental. Investment in infrastructure and technological advancements has also bolstered production capabilities, facilitating an efficient supply chain. However, slight fluctuations, such as the dip to 5.3% in 2025, can be linked to economic challenges and shifts in policy that impact operational costs. Overall, the trend toward energy transition and sustainable practices is likely to sustain consumer interest and drive further growth in the coming years.
Venezuela Liquid Nitrogen Market Year-wise Growth Rate and Key Drivers
This graph highlights how the Venezuela Liquid Nitrogen Market has steadily grown over the past five years, supported by major growth factors.
The table below presents the year wise growth rates along with the key drivers influencing the market
| Year | Growth Rate | Major Drivers |
| 2021 | 5.5% | Political instability hampers industrial growth, affecting overall liquid nitrogen demand. |
| 2022 | 5.7% | Supply chain disruptions lead to fluctuating prices and limited availability of liquid nitrogen. |
| 2023 | 5.8% | Increased agricultural investments promote the use of liquid nitrogen for crop enhancement. |
| 2024 | 5.6% | Emerging medical facilities explore liquid nitrogen applications in cryogenic preservation markets. |
| 2025 | 5.3% | Local manufacturing initiatives aim to bolster liquid nitrogen production capabilities sustainably. |
| 2026 | 5.7% | Increasing interest from international companies reflects potential partnerships in industrial sectors. |
| 2027 | 5.6% | Technological innovations in storage and transportation optimize liquid nitrogen distribution networks. |
| 2028 | 5.4% | Healthcare sector expansion drives demand for liquid nitrogen in laboratory and surgical applications. |
| 2029 | 5.5% | Environmental awareness encourages research into eco-friendly alternatives and applications of nitrogen. |
| 2030 | 5.7% | Economic recovery fosters infrastructure projects requiring enhanced liquid nitrogen supply chains. |
| 2031 | 5.9% | Collaboration between universities and industries supports research on liquid nitrogen technologies. |
| 2032 | 5.4% | Market maturity leads to diversification of liquid nitrogen uses in various emerging sectors. |
Note - Market size estimations and growth projections presented in this report are based on 6Wresearch's advanced forecasting approach, validated with industry datasets as of June 2026.
Venezuela Liquid Nitrogen Market Synopsis
The Venezuela Liquid Nitrogen Market is projected to reach 5.7% and witness significant growth during the forecast period (2026-2032). This expansion is largely attributed to the increasing utilization of liquid nitrogen across key industries such as healthcare, food and beverage, and electronics manufacturing. The demand dynamics are primarily driven by the essential functions of liquid nitrogen in cryogenic applications, preservation, and cooling processes.
Venezuela Liquid Nitrogen Market Growth Drivers
The growth trajectory of the Venezuela Liquid Nitrogen Market is influenced by several vital factors:
- The healthcare sector is a dominant force in the market, utilizing liquid nitrogen for medical procedures such as cryotherapy and for research applications that necessitate ultra-low temperatures.
- In the food and beverage industry, liquid nitrogen is increasingly adopted for rapid freezing and packaging, enhancing the preservation of food quality and extending shelf life.
- The electronics sector relies on liquid nitrogen for cooling during semiconductor manufacturing processes, making it a crucial component in the production of electronic devices.
- A rise in the adoption of cryogenic technologies in various scientific and consumer applications underpins the sustained demand for liquid nitrogen across sectors.
- Technological advancements that improve the efficiency of liquid nitrogen production and distribution further enable market growth by reducing operational costs.
Venezuela Liquid Nitrogen Market Challenges and Restraints
While the Venezuela Liquid Nitrogen Market is poised for growth, it faces several challenges that could hinder its development:
- Economic instability in Venezuela has led to significant hurdles in attracting foreign investments necessary for expanding production capabilities.
- The political turmoil in the country contributes to an uncertain business environment, impacting the operational efficiency of companies engaged in the liquid nitrogen market.
- International sanctions have complicated the import and export of liquid nitrogen, disrupting supply chains and limiting access to crucial production materials.
- The deteriorating infrastructure poses challenges in the reliable distribution of liquid nitrogen, affecting end-users in various industries.
- Increased production costs due to limited access to resources can affect pricing and market competitiveness, further constraining growth opportunities.
Venezuela Liquid Nitrogen Market Investment Opportunities
Investment opportunities within the Venezuela Liquid Nitrogen Market are emerging as demand rises across key sectors:
- There is potential for expanding production capacities to cater to the growing healthcare sector, particularly in innovative medical treatments that leverage cryogenic applications.
- Investing in infrastructure for storage and distribution facilities can enhance market reach and operational efficiency, addressing logistical challenges.
- Collaborations with agricultural entities for the application of liquid nitrogen in farming practices can diversify revenue streams and ensure steady demand.
- Research and development to explore new innovations, such as environmentally sustainable practices using liquid nitrogen, can create new market avenues.
- Engagement in local partnerships can mitigate risks associated with political and economic instability while fostering market growth through community-based initiatives.
Venezuela Liquid Nitrogen Market Government Investment and Initiatives
Government policies in Venezuela have shifted towards fostering domestic production and minimizing reliance on imports:
- Subsidies and incentives have been introduced to support local producers of liquid nitrogen, aiming to boost local manufacturing capabilities.
- The prioritization of domestic suppliers in procurement processes reflects a commitment to enhancing local industry competitiveness.
- Regulatory frameworks are established to ensure quality control and safety standards in the production and transportation of liquid nitrogen, increasing consumer trust.
- Infrastructure development projects aimed at improving essential utilities are underway, potentially benefiting the liquid nitrogen production and distribution network.
- The government is also focusing on educational initiatives to raise awareness of cryogenic technologies and their applications, which could stimulate market demand.
Venezuela Liquid Nitrogen Market Latest Developments (May 2025 - June 2026)
Recent developments in the Venezuela Liquid Nitrogen Market indicate a shift in operational strategies among producers:
- There has been an increased focus on sustainability, with companies exploring eco-friendly production methods and applications of liquid nitrogen in environmental remediation.
- Innovative partnerships are emerging within the agricultural sector, leveraging liquid nitrogen for crop preservation and storage solutions.
- Research initiatives have been launched to investigate novel biomedical applications of liquid nitrogen, particularly in enhancing treatment methodologies.
- Efforts to improve logistical capabilities are being rolled out, addressing some of the infrastructural challenges faced by distributors of liquid nitrogen.
- A growing recognition of the benefits of liquid nitrogen in various industrial applications is driving educational campaigns aimed at end-users and potential investors.
Venezuela Liquid Nitrogen Market - Key Attractiveness of the Report
- 10 Years of Market Numbers
- Historical Data Starting from 2022 to 2025
- Base Year: 2025
- Forecast Data until 2032
- Key Performance Indicators Impacting the Market
- Major Upcoming Developments and Projects
Key Highlights of the Report:
- Venezuela Liquid Nitrogen Market Outlook
- Market Size of Venezuela Liquid Nitrogen Market, 2025
- Forecast of Venezuela Liquid Nitrogen Market, 2032
- Historical Data and Forecast of Venezuela Liquid Nitrogen Revenues & Volume for the Period 2022-2032F
- Venezuela Liquid Nitrogen Market Trend Evolution
- Venezuela Liquid Nitrogen Market Drivers and Challenges
- Venezuela Liquid Nitrogen Price Trends
- Venezuela Liquid Nitrogen Porter's Five Forces
- Venezuela Liquid Nitrogen Industry Life Cycle
- Historical Data and Forecast of Venezuela Liquid Nitrogen Market Revenues & Volume By End-Use Industry for the Period 2022-2032F
- Historical Data and Forecast of Venezuela Liquid Nitrogen Market Revenues & Volume By Chemicals & pharmaceuticals for the Period 2022-2032F
- Historical Data and Forecast of Venezuela Liquid Nitrogen Market Revenues & Volume By Food & beverage for the Period 2022-2032F
- Historical Data and Forecast of Venezuela Liquid Nitrogen Market Revenues & Volume By Healthcare for the Period 2022-2032F
- Historical Data and Forecast of Venezuela Liquid Nitrogen Market Revenues & Volume By Metal manufacturing & construction for the Period 2022-2032F
- Historical Data and Forecast of Venezuela Liquid Nitrogen Market Revenues & Volume By Rubber & Plastic for the Period 2022-2032F
- Historical Data and Forecast of Venezuela Liquid Nitrogen Market Revenues & Volume By Others for the Period 2022-2032F
- Historical Data and Forecast of Venezuela Liquid Nitrogen Market Revenues & Volume By Storage, Distribution and Transportation for the Period 2022-2032F
- Historical Data and Forecast of Venezuela Liquid Nitrogen Market Revenues & Volume By Cylinder & packaged distribution for the Period 2022-2032F
- Historical Data and Forecast of Venezuela Liquid Nitrogen Market Revenues & Volume By Merchant liquid distribution for the Period 2022-2032F
- Historical Data and Forecast of Venezuela Liquid Nitrogen Market Revenues & Volume By Tonnage distribution for the Period 2022-2032F
- Historical Data and Forecast of Venezuela Liquid Nitrogen Market Revenues & Volume By Function for the Period 2022-2032F
- Historical Data and Forecast of Venezuela Liquid Nitrogen Market Revenues & Volume By Coolant for the Period 2022-2032F
- Historical Data and Forecast of Venezuela Liquid Nitrogen Market Revenues & Volume By Refrigerant for the Period 2022-2032F
- Historical Data and Forecast of Venezuela Liquid Nitrogen Market Revenues & Volume By Manufacturing Process for the Period 2022-2032F
- Historical Data and Forecast of Venezuela Liquid Nitrogen Market Revenues & Volume By Cryogenic distillation for the Period 2022-2032F
- Historical Data and Forecast of Venezuela Liquid Nitrogen Market Revenues & Volume By Pressure swing adsorption for the Period 2022-2032F
- Venezuela Liquid Nitrogen Import Export Trade Statistics
- Market Opportunity Assessment By End-Use Industry
- Market Opportunity Assessment By Storage, Distribution and Transportation
- Market Opportunity Assessment By Function
- Market Opportunity Assessment By Manufacturing Process
- Venezuela Liquid Nitrogen Top Companies Market Share
- Venezuela Liquid Nitrogen Competitive Benchmarking By Technical and Operational Parameters
- Venezuela Liquid Nitrogen Company Profiles
- Venezuela Liquid Nitrogen Key Strategic Recommendations
Frequently Asked Questions About the Market Study (FAQs):
Frequently asked questions regarding the Venezuela Liquid Nitrogen Market include:
The primary demand drivers include healthcare applications, food processing advancements, and the electronics manufacturing sector.
The government promotes domestic production through subsidies, prioritization of local suppliers, and infrastructure improvements.
Key challenges include economic instability, political unrest, and international sanctions affecting trade.
6Wresearch actively monitors the Venezuela Liquid Nitrogen Market and publishes its comprehensive annual report, highlighting emerging trends, growth drivers, revenue analysis, and forecast outlook. Our insights help businesses to make data-backed strategic decisions with ongoing market dynamics. Our analysts track relevent industries related to the Venezuela Liquid Nitrogen Market, allowing our clients with actionable intelligence and reliable forecasts tailored to emerging regional needs.
Yes, we provide customisation as per your requirements. To learn more, feel free to contact us on sales@6wresearch.com
1 Executive Summary |
2 Introduction |
2.1 Key Highlights of the Report |
2.2 Report Description |
2.3 Market Scope & Segmentation |
2.4 Research Methodology |
2.5 Assumptions |
3 Venezuela Liquid Nitrogen Market Overview |
3.1 Venezuela Country Macro Economic Indicators |
3.2 Venezuela Liquid Nitrogen Market Revenues & Volume, 2022 & 2032F |
3.3 Venezuela Liquid Nitrogen Market - Industry Life Cycle |
3.4 Venezuela Liquid Nitrogen Market - Porter's Five Forces |
3.5 Venezuela Liquid Nitrogen Market Revenues & Volume Share, By End-Use Industry, 2022 & 2032F |
3.6 Venezuela Liquid Nitrogen Market Revenues & Volume Share, By Storage, Distribution and Transportation, 2022 & 2032F |
3.7 Venezuela Liquid Nitrogen Market Revenues & Volume Share, By Function, 2022 & 2032F |
3.8 Venezuela Liquid Nitrogen Market Revenues & Volume Share, By Manufacturing Process, 2022 & 2032F |
4 Venezuela Liquid Nitrogen Market Dynamics |
4.1 Impact Analysis |
4.2 Market Drivers |
4.3 Market Restraints |
5 Venezuela Liquid Nitrogen Market Trends |
6 Venezuela Liquid Nitrogen Market, By Types |
6.1 Venezuela Liquid Nitrogen Market, By End-Use Industry |
6.1.1 Overview and Analysis |
6.1.2 Venezuela Liquid Nitrogen Market Revenues & Volume, By End-Use Industry, 2022-2032F |
6.1.3 Venezuela Liquid Nitrogen Market Revenues & Volume, By Chemicals & pharmaceuticals, 2022-2032F |
6.1.4 Venezuela Liquid Nitrogen Market Revenues & Volume, By Food & beverage, 2022-2032F |
6.1.5 Venezuela Liquid Nitrogen Market Revenues & Volume, By Healthcare, 2022-2032F |
6.1.6 Venezuela Liquid Nitrogen Market Revenues & Volume, By Metal manufacturing & construction, 2022-2032F |
6.1.7 Venezuela Liquid Nitrogen Market Revenues & Volume, By Rubber & Plastic, 2022-2032F |
6.1.8 Venezuela Liquid Nitrogen Market Revenues & Volume, By Others, 2022-2032F |
6.2 Venezuela Liquid Nitrogen Market, By Storage, Distribution and Transportation |
6.2.1 Overview and Analysis |
6.2.2 Venezuela Liquid Nitrogen Market Revenues & Volume, By Cylinder & packaged distribution, 2022-2032F |
6.2.3 Venezuela Liquid Nitrogen Market Revenues & Volume, By Merchant liquid distribution, 2022-2032F |
6.2.4 Venezuela Liquid Nitrogen Market Revenues & Volume, By Tonnage distribution, 2022-2032F |
6.3 Venezuela Liquid Nitrogen Market, By Function |
6.3.1 Overview and Analysis |
6.3.2 Venezuela Liquid Nitrogen Market Revenues & Volume, By Coolant, 2022-2032F |
6.3.3 Venezuela Liquid Nitrogen Market Revenues & Volume, By Refrigerant, 2022-2032F |
6.4 Venezuela Liquid Nitrogen Market, By Manufacturing Process |
6.4.1 Overview and Analysis |
6.4.2 Venezuela Liquid Nitrogen Market Revenues & Volume, By Cryogenic distillation, 2022-2032F |
6.4.3 Venezuela Liquid Nitrogen Market Revenues & Volume, By Pressure swing adsorption, 2022-2032F |
7 Venezuela Liquid Nitrogen Market Import-Export Trade Statistics |
7.1 Venezuela Liquid Nitrogen Market Export to Major Countries |
7.2 Venezuela Liquid Nitrogen Market Imports from Major Countries |
8 Venezuela Liquid Nitrogen Market Key Performance Indicators |
9 Venezuela Liquid Nitrogen Market - Opportunity Assessment |
9.1 Venezuela Liquid Nitrogen Market Opportunity Assessment, By End-Use Industry, 2022 & 2032F |
9.2 Venezuela Liquid Nitrogen Market Opportunity Assessment, By Storage, Distribution and Transportation, 2022 & 2032F |
9.3 Venezuela Liquid Nitrogen Market Opportunity Assessment, By Function, 2022 & 2032F |
9.4 Venezuela Liquid Nitrogen Market Opportunity Assessment, By Manufacturing Process, 2022 & 2032F |
10 Venezuela Liquid Nitrogen Market - Competitive Landscape |
10.1 Venezuela Liquid Nitrogen Market Revenue Share, By Companies, 2025 |
10.2 Venezuela Liquid Nitrogen Market Competitive Benchmarking, By Operating and Technical Parameters |
11 Company Profiles |
12 Recommendations |
13 Disclaimer |
Global Go To Market Strategy - 2030
Export potential enables firms to identify high-growth global markets with greater confidence by combining advanced trade intelligence with a structured quantitative methodology. The framework analyzes emerging demand trends and country-level import patterns while integrating macroeconomic and trade datasets such as GDP and population forecasts, bilateral import–export flows, tariff structures, elasticity differentials between developed and developing economies, geographic distance, and import demand projections. Using weighted trade values from 2020–2024 as the base period to project country-to-country export potential for 2030, these inputs are operationalized through calculated drivers such as gravity model parameters, tariff impact factors, and projected GDP per-capita growth. Through an analysis of hidden potentials, demand hotspots, and market conditions that are most favorable to success, this method enables firms to focus on target countries, maximize returns, and global expansion with data, backed by accuracy.
By factoring in the projected importer demand gap that is currently unmet and could be potential opportunity, it identifies the potential for the Exporter (Country) among 190 countries, against the general trade analysis, which identifies the biggest importer or exporter.
To discover high-growth global markets and optimize your business strategy:
Click Here
Pricing
- Single User License$ 1,995
- Department License$ 2,400
- Site License$ 3,120
- Global License$ 3,795

Leadership Perspectives from Industry Events
Search
Thought Leadership and Analyst Meet


Our Clients
6WResearch In News
- India Air Conditioner Market Set for Strong Rebound in 2026 After Weather-Led Correction and GST-Driven Recovery: 6Wresearch
- ADAS in India: How Automatic Emergency Braking, Blind Spot Detection & Driver Monitoring are Transforming Road Safety
- Doha a strategic location for EV manufacturing hub: IPA Qatar
- Demand for luxury TVs surging in the GCC, says Samsung
- Empowering Growth: The Thriving Journey of Bangladesh’s Cable Industry
- Demand for luxury TVs surging in the GCC, says Samsung
Latest Reports
- Poland Fire Protection Systems Market (2026-2032)
- Cape Verde Portable Hand-Thrown Extinguisher Market (2026-2032)
- Canada Portable Hand-Thrown Extinguisher Market (2026-2032)
- Cameroon Portable Hand-Thrown Extinguisher Market (2026-2032)
- Burundi Portable Hand-Thrown Extinguisher Market (2026-2032)
- Burkina Faso Portable Hand-Thrown Extinguisher Market (2026-2032)
- Bulgaria Portable Hand-Thrown Extinguisher Market (2026-2032)
- Brunei Portable Hand-Thrown Extinguisher Market (2026-2032)
- Botswana Portable Hand-Thrown Extinguisher Market (2026-2032)
- Bosnia and Herzegovina Portable Hand-Thrown Extinguisher Market (2026-2032)
Industry Events and Analyst Meet

HIMTEX 2026

India Refining Summit 2026

India EV Show 2026

EV tech India Expo 2026

Auto Tech Asia 2026
Whitepaper
- Middle East & Africa Commercial Security Market Click here to view more.
- Middle East & Africa Fire Safety Systems & Equipment Market Click here to view more.
- GCC Drone Market Click here to view more.
- Middle East Lighting Fixture Market Click here to view more.
- GCC Physical & Perimeter Security Market Click here to view more.