Australia Flushing System Market (2026-2032) Outlook | Trends, Size, Analysis, Industry, Revenue, Companies, Growth, Value, Forecast & Share
Market Forecast By Type (Gravity Flush, Dual Flush, Pressure-assisted Flush, Tornado Flush, Others), By Technology (Manual, Sensors, Remote Control, Waterless Flushing), By Installation Type (Surface Flush, Rear Wall Mounting, Others), By End User (Residential, Commercial) And Competitive Landscape
| Product Code: ETC084534 | Publication Date: Jun 2021 | Updated Date: Jun 2026 | Product Type: Report | |
| Publisher: 6Wresearch | Author: Ravi Bhandari | No. of Pages: 70 | No. of Figures: 35 | No. of Tables: 5 |
Australia Flushing System Market Size, Share & Growth Rate
The Australia Flushing System Market was estimated at USD 87 Million in 2025 and is projected to reach USD 101 Million by 2032, growing at a CAGR of 2.2% from 2026 to 2032. This growth trajectory is primarily driven by increasing awareness surrounding water conservation and hygiene maintenance across various sectors. The adoption of innovative flushing technologies, including dual-flush systems and sensor-based solutions, has further accelerated market demand, reflecting a commitment to sustainable practices in urban planning and infrastructure development.
Australia Flushing System Market Growth Rate Analysis (2021-2032)
The Australian flushing system market has navigated an interesting trajectory in recent years. Following a slight decline of 0.9% in 2021, the sector rebounded strongly in 2022 with a substantial growth rate of 5.2%. This recovery can be attributed to rising consumer demand for water-efficient technologies and increased investments in sustainable infrastructure. In 2023, growth moderated to 4.8%, reflecting ongoing technological advancements and a shift towards digital solutions that enhance product efficiency. Projections indicate steady growth through 2032, with rates stabilizing around 2.1% to 3.1%. This demand expansion is largely influenced by evolving consumer preferences and regulatory support for eco-friendly initiatives, positioning the market for gradual advancement in the years ahead.
Australia Flushing System Market Year-wise Growth Rate and Key Drivers
This graph highlights how the Australia Flushing System Market has steadily grown over the past five years, supported by major growth factors.
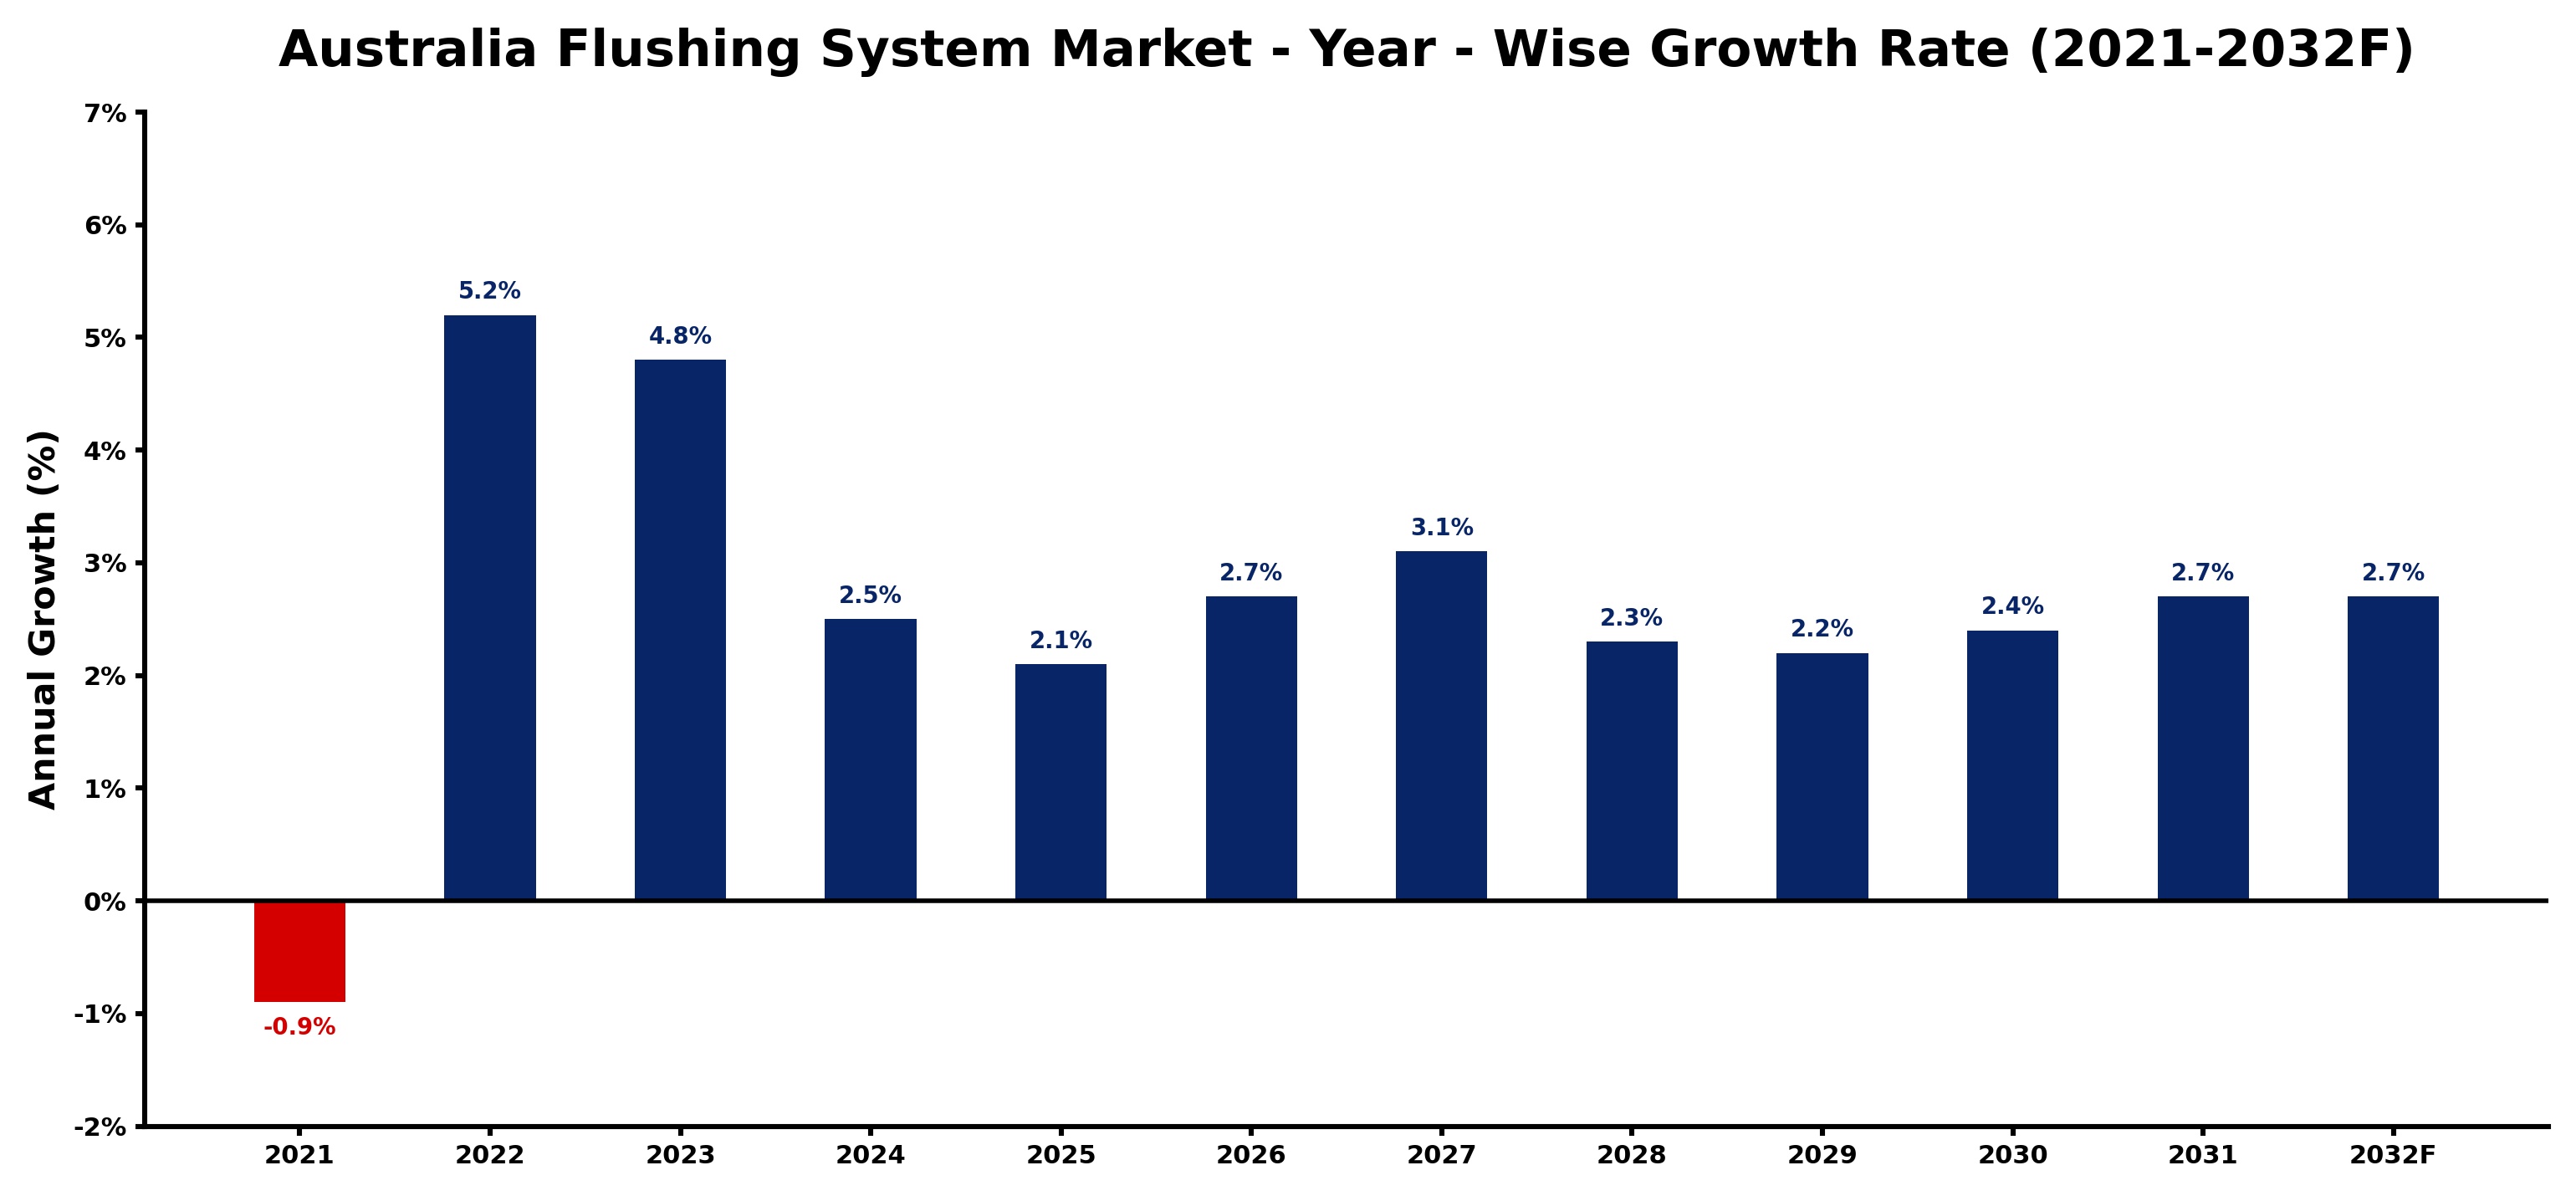
The table below presents the year‑wise growth rates along with the key drivers influencing the market
| Year | Growth Rate | Major Drivers |
| 2021 | -0.9% | Increasing smart city development projects |
| 2022 | 5.2% | Rapid growth in telecom and data center sectors |
| 2023 | 4.8% | Expansion of transportation and logistics networks |
| 2024 | 2.5% | Increasing smart city development projects |
| 2025 | 2.1% | Growing urbanization and commercial development |
| 2026 | 2.7% | Increasing industrial automation investments |
| 2027 | 3.1% | Expansion of transportation and logistics networks |
| 2028 | 2.3% | Growing renewable energy integration projects |
| 2029 | 2.2% | Rapid growth in telecom and data center sectors |
| 2030 | 2.4% | Rapid growth in telecom and data center sectors |
| 2031 | 2.7% | Increasing industrial automation investments |
| 2032 | 2.7% | Rapid growth in telecom and data center sectors |
Note - Market size estimations and growth projections presented in this report are based on 6Wresearch’s advanced forecasting approach, validated with industry datasets as of June 2026.
Australia Flushing System Market Synopsis
Recently, the Australia Flushing System Market has experienced notable momentum, spurred by the rising emphasis on water-saving technologies in both residential and commercial settings. However, as the market evolves, it is poised to embrace a wider range of sustainable solutions that align with the ongoing governmental push towards environmental responsibility.
Looking ahead, the demand for advanced flushing systems is expected to intensify, with consumers and businesses alike increasingly prioritizing efficiency and sustainability. The market's future trajectory is likely to be shaped by both consumer preferences and regulatory frameworks aimed at promoting eco-friendly water management practices.
Australia Flushing System Market Key Takeaways
- The market is set for steady growth as consumer awareness of water conservation rises.
- Government initiatives play a significant role in encouraging the adoption of water-efficient technologies.
- Advanced flushing systems are increasingly favored for their environmental benefits.
- Challenges related to traditional water consumption practices remain, necessitating innovation.
- Collaboration between industry and regulatory bodies will be crucial for sustainable development.
Evaluation of Restraints in Australia Flushing System Market
Despite the positive growth outlook, the Australia Flushing System Market faces significant constraints, particularly regarding water conservation efforts. Traditional flushing systems often consume excessive amounts of water, contradicting the current demand for efficient, sustainable solutions. This inconsistency has led to a crucial need for innovations that minimize water use while maintaining high hygiene standards. As awareness of water scarcity grows, manufacturers are challenged to create systems that align performance with environmental sustainability.
Australia Flushing System Market Trends
One prominent trend shaping the Australia Flushing System Market is the rise of smart technologies, such as sensor-operated flush valves, which enhance user convenience and reduce water wastage. Additionally, the dual-flush system continues to gain traction as a preferred choice among consumers, offering a practical solution for water conservation without compromising functionality. The increasing focus on eco-friendly materials and design is also influencing product development within the market.
Australia Flushing System Market Opportunities
The market presents substantial opportunities for investment, particularly in the development of next-generation flushing systems that utilize sustainable technologies. There is a burgeoning demand for products that not only conserve water but also integrate seamlessly into modern infrastructure. Furthermore, as government policies evolve to support environmental sustainability, manufacturers who innovate and adhere to these standards will find a receptive market eager for eco-friendly solutions.
Government Initiatives in the Australia Flushing System Market
Government policies in Australia increasingly focus on promoting water conservation and enhancing the quality of water management systems. Regulatory measures are being implemented to set standards for water-efficient fixtures, while incentives are offered for adopting advanced technologies. Educational campaigns aimed at the public also play a pivotal role in raising awareness about responsible water usage, further supporting the market's transition towards sustainability.
Future Insights of the Australia Flushing System Market
Looking towards 2026-2032, the Australia Flushing System Market is expected to evolve significantly, driven by both technological advancements and shifting consumer preferences. A greater emphasis on sustainability will steer innovations, resulting in a wider adoption of water-efficient systems. Additionally, as government regulations tighten regarding water usage, the demand for compliant, high-performance flushing systems will only increase, positioning forward-thinking manufacturers favorably within this expanding market.
Australia Flushing System Market Latest Developments (May 2025 - June 2026)
In recent months, the Australia Flushing System Market has seen substantial movement towards the adoption of more sustainable products. Industry stakeholders are increasingly collaborating to develop solutions that meet emerging regulatory standards while appealing to eco-conscious consumers. Additionally, there is growing interest in digital solutions that enhance the efficiency of flushing systems, reflecting a broader trend towards smart technology integration in water management.
Australia Flushing System Market - Key Attractiveness of the Report
- 10 Years of Market Numbers
- Historical Data Starting from 2022 to 2025
- Base Year: 2025
- Forecast Data until 2032
- Key Performance Indicators Impacting the Market
- Major Upcoming Developments and Projects
Key Highlights of the Report:
- Australia Flushing System Market Outlook
- Market Size of Australia Flushing System Market, 2025
- Forecast of Australia Flushing System Market, 2032
- Historical Data and Forecast of Australia Flushing System Revenues & Volume for the Period 2022-2032F
- Australia Flushing System Market Trend Evolution
- Australia Flushing System Market Drivers and Challenges
- Australia Flushing System Price Trends
- Australia Flushing System Porter's Five Forces
- Australia Flushing System Industry Life Cycle
- Historical Data and Forecast of Australia Flushing System Market Revenues & Volume By Type for the Period 2022-2032F
- Historical Data and Forecast of Australia Flushing System Market Revenues & Volume By Gravity Flush for the Period 2022-2032F
- Historical Data and Forecast of Australia Flushing System Market Revenues & Volume By Dual Flush for the Period 2022-2032F
- Historical Data and Forecast of Australia Flushing System Market Revenues & Volume By Pressure-assisted Flush for the Period 2022-2032F
- Historical Data and Forecast of Australia Flushing System Market Revenues & Volume By Tornado Flush for the Period 2022-2032F
- Historical Data and Forecast of Australia Flushing System Market Revenues & Volume By Others for the Period 2022-2032F
- Historical Data and Forecast of Australia Flushing System Market Revenues & Volume By Technology for the Period 2022-2032F
- Historical Data and Forecast of Australia Flushing System Market Revenues & Volume By Manual for the Period 2022-2032F
- Historical Data and Forecast of Australia Flushing System Market Revenues & Volume By Sensors for the Period 2022-2032F
- Historical Data and Forecast of Australia Flushing System Market Revenues & Volume By Remote Control for the Period 2022-2032F
- Historical Data and Forecast of Australia Flushing System Market Revenues & Volume By Waterless Flushing for the Period 2022-2032F
- Historical Data and Forecast of Australia Flushing System Market Revenues & Volume By Installation Type for the Period 2022-2032F
- Historical Data and Forecast of Australia Flushing System Market Revenues & Volume By Surface Flush for the Period 2022-2032F
- Historical Data and Forecast of Australia Flushing System Market Revenues & Volume By Rear Wall Mounting for the Period 2022-2032F
- Historical Data and Forecast of Australia Flushing System Market Revenues & Volume By Others for the Period 2022-2032F
- Historical Data and Forecast of Australia Flushing System Market Revenues & Volume By End User for the Period 2022-2032F
- Historical Data and Forecast of Australia Flushing System Market Revenues & Volume By Residential for the Period 2022-2032F
- Historical Data and Forecast of Australia Flushing System Market Revenues & Volume By Commercial for the Period 2022-2032F
- Australia Flushing System Import Export Trade Statistics
- Market Opportunity Assessment By Type
- Market Opportunity Assessment By Technology
- Market Opportunity Assessment By Installation Type
- Market Opportunity Assessment By End User
- Australia Flushing System Top Companies Market Share
- Australia Flushing System Competitive Benchmarking By Technical and Operational Parameters
- Australia Flushing System Company Profiles
- Australia Flushing System Key Strategic Recommendations
Australia Flushing System Market - Frequently Asked Questions
The Australia Flushing System Market is projected to grow from USD 87 Million in 2025 to USD 101 Million by 2032, with a CAGR of 2.2% from 2026 to 2032, reflecting a robust demand for sustainable solutions.
There is an increasing preference for dual-flush toilets and sensor-operated flush systems, as they address both hygiene and water conservation concerns.
Government initiatives focus on promoting water efficiency and establishing standards for flushing fixtures, which incentivizes manufacturers to innovate and meet these environmental goals.
Traditional flushing systems often lead to high water consumption, which contradicts the growing demand for efficiency, pushing manufacturers to develop innovative solutions that minimize water usage.
Demand is rising in residential, commercial, and institutional buildings, as each sector increasingly prioritizes water conservation and hygiene.
6Wresearch actively monitors the Australia Flushing System Market and publishes its comprehensive annual report, highlighting emerging trends, growth drivers, revenue analysis, and forecast outlook. Our insights help businesses to make data-backed strategic decisions with ongoing market dynamics. Our analysts track relevent industries related to the Australia Flushing System Market, allowing our clients with actionable intelligence and reliable forecasts tailored to emerging regional needs.
Yes, we provide customisation as per your requirements. To learn more, feel free to contact us on sales@6wresearch.com
1 Executive Summary |
2 Introduction |
2.1 Key Highlights of the Report |
2.2 Report Description |
2.3 Market Scope & Segmentation |
2.4 Research Methodology |
2.5 Assumptions |
3 Australia Flushing System Market Overview |
3.1 Australia Country Macro Economic Indicators |
3.2 Australia Flushing System Market Revenues & Volume, 2022 & 2032F |
3.3 Australia Flushing System Market - Industry Life Cycle |
3.4 Australia Flushing System Market - Porter's Five Forces |
3.5 Australia Flushing System Market Revenues & Volume Share, By Type, 2022 & 2032F |
3.6 Australia Flushing System Market Revenues & Volume Share, By Technology, 2022 & 2032F |
3.7 Australia Flushing System Market Revenues & Volume Share, By Installation Type, 2022 & 2032F |
3.8 Australia Flushing System Market Revenues & Volume Share, By End User, 2022 & 2032F |
4 Australia Flushing System Market Dynamics |
4.1 Impact Analysis |
4.2 Market Drivers |
4.2.1 Growing awareness about water conservation and sustainability practices leading to increased adoption of water-efficient flushing systems. |
4.2.2 Government initiatives promoting the use of eco-friendly products and water-saving technologies in buildings. |
4.2.3 Increasing construction activities and infrastructure development in Australia driving the demand for flushing systems. |
4.3 Market Restraints |
4.3.1 High initial costs associated with installing water-efficient flushing systems may deter some consumers. |
4.3.2 Resistance to change from traditional flushing systems to newer, more efficient technologies. |
4.3.3 Fluctuations in raw material prices impacting the overall cost of production for flushing system manufacturers. |
5 Australia Flushing System Market Trends |
6 Australia Flushing System Market, By Types |
6.1 Australia Flushing System Market, By Type |
6.1.1 Overview and Analysis |
6.1.2 Australia Flushing System Market Revenues & Volume, By Type, 2022-2032F |
6.1.3 Australia Flushing System Market Revenues & Volume, By Gravity Flush, 2022-2032F |
6.1.4 Australia Flushing System Market Revenues & Volume, By Dual Flush, 2022-2032F |
6.1.5 Australia Flushing System Market Revenues & Volume, By Pressure-assisted Flush, 2022-2032F |
6.1.6 Australia Flushing System Market Revenues & Volume, By Tornado Flush, 2022-2032F |
6.1.7 Australia Flushing System Market Revenues & Volume, By Others, 2022-2032F |
6.2 Australia Flushing System Market, By Technology |
6.2.1 Overview and Analysis |
6.2.2 Australia Flushing System Market Revenues & Volume, By Manual, 2022-2032F |
6.2.3 Australia Flushing System Market Revenues & Volume, By Sensors, 2022-2032F |
6.2.4 Australia Flushing System Market Revenues & Volume, By Remote Control, 2022-2032F |
6.2.5 Australia Flushing System Market Revenues & Volume, By Waterless Flushing, 2022-2032F |
6.3 Australia Flushing System Market, By Installation Type |
6.3.1 Overview and Analysis |
6.3.2 Australia Flushing System Market Revenues & Volume, By Surface Flush, 2022-2032F |
6.3.3 Australia Flushing System Market Revenues & Volume, By Rear Wall Mounting, 2022-2032F |
6.3.4 Australia Flushing System Market Revenues & Volume, By Others, 2022-2032F |
6.4 Australia Flushing System Market, By End User |
6.4.1 Overview and Analysis |
6.4.2 Australia Flushing System Market Revenues & Volume, By Residential, 2022-2032F |
6.4.3 Australia Flushing System Market Revenues & Volume, By Commercial, 2022-2032F |
7 Australia Flushing System Market Import-Export Trade Statistics |
7.1 Australia Flushing System Market Export to Major Countries |
7.2 Australia Flushing System Market Imports from Major Countries |
8 Australia Flushing System Market Key Performance Indicators |
8.1 Average water savings per installation of water-efficient flushing systems. |
8.2 Number of new buildings or construction projects incorporating water-efficient flushing systems. |
8.3 Percentage of households or commercial buildings using water-efficient flushing systems. |
8.4 Customer satisfaction ratings related to the performance and reliability of water-efficient flushing systems. |
8.5 Percentage of government buildings or facilities that have implemented water-saving technologies like efficient flushing systems. |
9 Australia Flushing System Market - Opportunity Assessment |
9.1 Australia Flushing System Market Opportunity Assessment, By Type, 2022 & 2032F |
9.2 Australia Flushing System Market Opportunity Assessment, By Technology, 2022 & 2032F |
9.3 Australia Flushing System Market Opportunity Assessment, By Installation Type, 2022 & 2032F |
9.4 Australia Flushing System Market Opportunity Assessment, By End User, 2022 & 2032F |
10 Australia Flushing System Market - Competitive Landscape |
10.1 Australia Flushing System Market Revenue Share, By Companies, 2025 |
10.2 Australia Flushing System Market Competitive Benchmarking, By Operating and Technical Parameters |
11 Company Profiles |
12 Recommendations |
13 Disclaimer |
Global Go To Market Strategy - 2030
Export potential enables firms to identify high-growth global markets with greater confidence by combining advanced trade intelligence with a structured quantitative methodology. The framework analyzes emerging demand trends and country-level import patterns while integrating macroeconomic and trade datasets such as GDP and population forecasts, bilateral import–export flows, tariff structures, elasticity differentials between developed and developing economies, geographic distance, and import demand projections. Using weighted trade values from 2020–2024 as the base period to project country-to-country export potential for 2030, these inputs are operationalized through calculated drivers such as gravity model parameters, tariff impact factors, and projected GDP per-capita growth. Through an analysis of hidden potentials, demand hotspots, and market conditions that are most favorable to success, this method enables firms to focus on target countries, maximize returns, and global expansion with data, backed by accuracy.
By factoring in the projected importer demand gap that is currently unmet and could be potential opportunity, it identifies the potential for the Exporter (Country) among 190 countries, against the general trade analysis, which identifies the biggest importer or exporter.
To discover high-growth global markets and optimize your business strategy:
Click Here
Pricing
- Single User License$ 1,995
- Department License$ 2,400
- Site License$ 3,120
- Global License$ 3,795

Leadership Perspectives from Industry Events
Search
Thought Leadership and Analyst Meet


Our Clients
6WResearch In News
- ADAS in India: How Automatic Emergency Braking, Blind Spot Detection & Driver Monitoring are Transforming Road Safety
- Doha a strategic location for EV manufacturing hub: IPA Qatar
- Demand for luxury TVs surging in the GCC, says Samsung
- Empowering Growth: The Thriving Journey of Bangladesh’s Cable Industry
- Demand for luxury TVs surging in the GCC, says Samsung
- Video call with a traditional healer? Once unthinkable, it’s now common in South Africa
Latest Reports
- Poland Fire Protection Systems Market (2026-2032)
- Cape Verde Portable Hand-Thrown Extinguisher Market (2026-2032)
- Canada Portable Hand-Thrown Extinguisher Market (2026-2032)
- Cameroon Portable Hand-Thrown Extinguisher Market (2026-2032)
- Burundi Portable Hand-Thrown Extinguisher Market (2026-2032)
- Burkina Faso Portable Hand-Thrown Extinguisher Market (2026-2032)
- Bulgaria Portable Hand-Thrown Extinguisher Market (2026-2032)
- Brunei Portable Hand-Thrown Extinguisher Market (2026-2032)
- Botswana Portable Hand-Thrown Extinguisher Market (2026-2032)
- Bosnia and Herzegovina Portable Hand-Thrown Extinguisher Market (2026-2032)
Industry Events and Analyst Meet

HIMTEX 2026

India Refining Summit 2026

India EV Show 2026

EV tech India Expo 2026

Auto Tech Asia 2026
Whitepaper
- Middle East & Africa Commercial Security Market Click here to view more.
- Middle East & Africa Fire Safety Systems & Equipment Market Click here to view more.
- GCC Drone Market Click here to view more.
- Middle East Lighting Fixture Market Click here to view more.
- GCC Physical & Perimeter Security Market Click here to view more.