Bahrain Fish Processing Market (2026-2032) | Companies, Revenue, Share, Outlook, Industry, Trends, Forecast, Growth, Analysis, Size & Value
Market Forecast By Source (Marine, Inland, Freshwater), By Application (Food, Feed, Biomedical, Others), By Processing (Frozen, Preserved, Others), By Equipment (Gutting, Scaling, Filleting, Deboning, Skinning, Curing & Smoking, Others) And Competitive Landscape
| Product Code: ETC042624 | Publication Date: Jan 2021 | Updated Date: Jun 2026 | Product Type: Report | |
| Publisher: 6Wresearch | Author: Ravi Bhandari | No. of Pages: 70 | No. of Figures: 35 | No. of Tables: 5 |
Bahrain Fish Processing Market Summary
The bahrain fish processing market was estimated at USD 937 Million in 2025 and is projected to reach USD 1606 Million by 2032, growing at a CAGR of 9.2% from 2026 to 2032.
Bahrain Fish Processing Market Growth Rate Analysis (2021-2032)
The Bahrain Fish Processing Market is experiencing robust growth, marked by a notable annual increase of 7.2% in 2021, escalating to 8.0% in 2023 and projected to reach 11.6% by 2032. This upward trend is largely driven by rising consumer demand for seafood and increasing investments in advanced processing technologies. The government's focus on enhancing infrastructure and boosting local production to reduce reliance on imports has further propelled market expansion. Additionally, the energy transition towards sustainable practices is reshaping operational efficiencies in fish processing. With digitalization playing a critical role in improving supply chain management, Bahrain is well-positioned to capitalize on these favorable market dynamics in the coming years.
Bahrain Fish Processing Market Year-wise Growth Rate and Key Drivers
This graph highlights how the Bahrain Fish Processing Market has steadily grown over the past five years, supported by major growth factors.
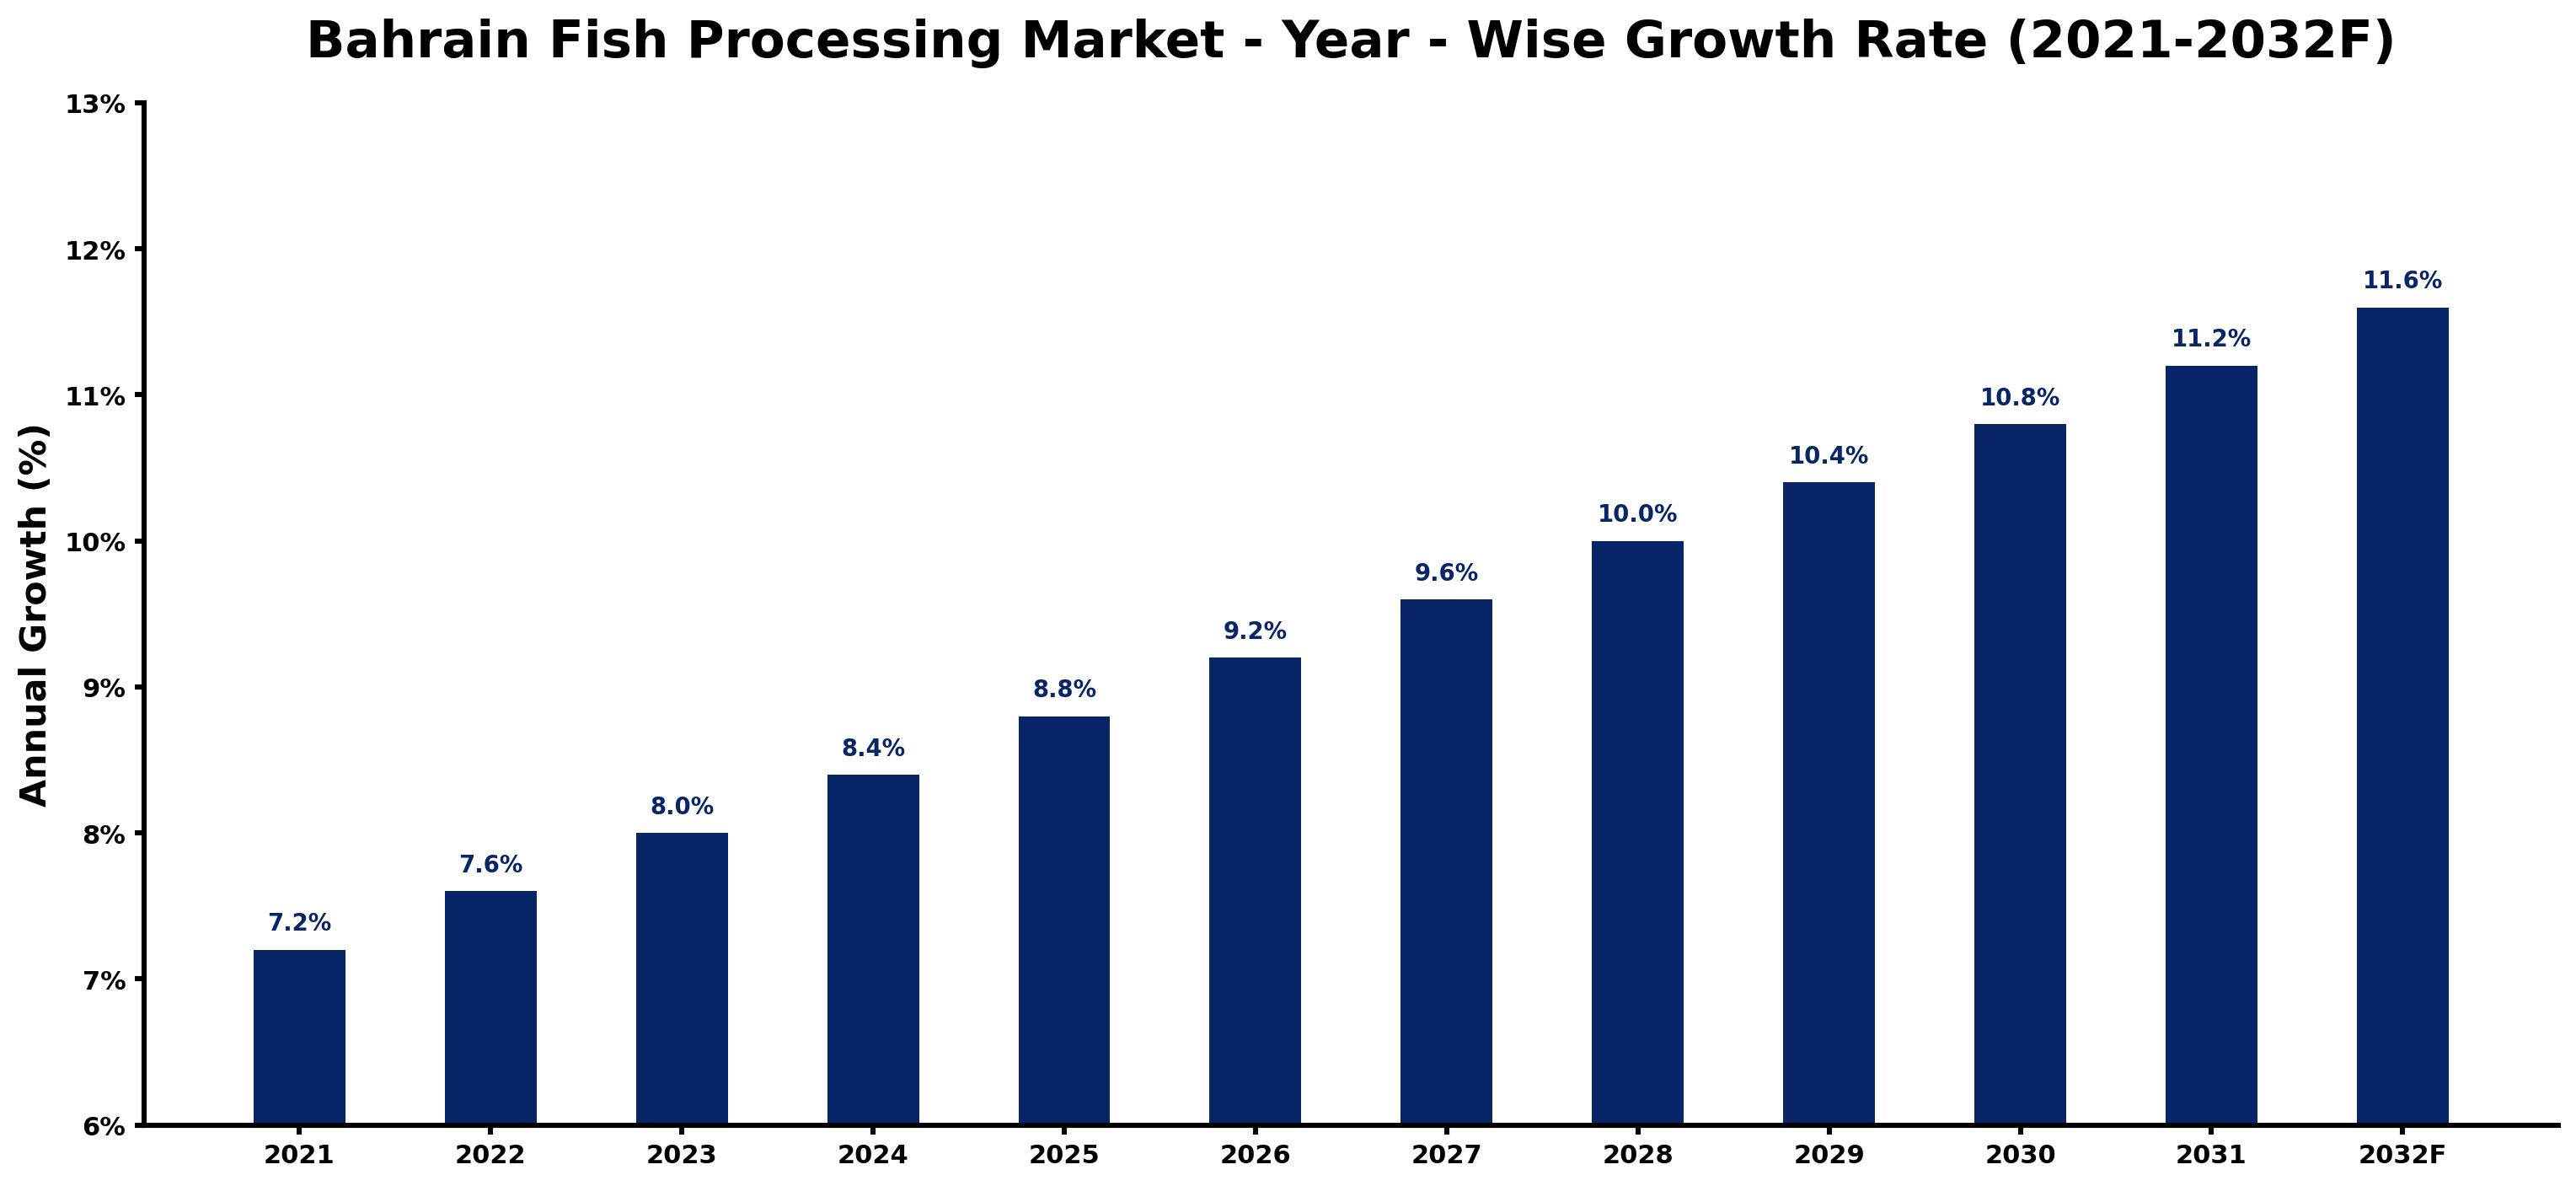
The table below presents the year wise growth rates along with the key drivers influencing the market
| Year | Growth Rate | Major Drivers |
| 2021 | 7.2% | Increased local consumption of seafood drives higher processing activity across the region. |
| 2022 | 7.6% | Shifts in consumer preferences towards healthier protein sources favor processed fish products. |
| 2023 | 8.0% | Bahrain's strategic location enhances access to international seafood supply chains significantly. |
| 2024 | 8.4% | Investment in modern processing technology improves efficiency and product quality markedly. |
| 2025 | 8.8% | Sustainability trends encourage eco-friendly practices within the fish processing sector. |
| 2026 | 9.2% | Export opportunities emerge as GCC countries push for food security initiatives. |
| 2027 | 9.6% | Collaborations with local fisheries strengthen supply chain resilience throughout the market. |
| 2028 | 10.0% | Technological advancements in aquaculture bolster fish supply for processing industries. |
| 2029 | 10.4% | Consumer awareness campaigns emphasize benefits of processed fish over alternatives. |
| 2030 | 10.8% | Emerging trends in convenience foods highlight processed fish's appeal to busy consumers. |
| 2031 | 11.2% | Network expansions in logistics ensure timely delivery of fish products to retailers. |
| 2032 | 11.6% | Continued urbanization leads to higher demand for ready-to-eat seafood offerings. |
Note - Market size estimations and growth projections presented in this report are based on 6Wresearch's advanced forecasting approach, validated with industry datasets as of June 2026.
Bahrain Fish Processing Market Synopsis
The Bahrain Fish Processing Market is projected to reach 9.2% and witness significant growth during the forecast period (2026-2032). This sector plays a pivotal role in Bahrain's food landscape, as it processes a diverse array of seafood products intended to satisfy both local consumption and export requirements. The market's expansion is fueled by rising domestic consumption alongside the demand for processed seafood in neighboring regions, reinforcing the importance of this industry within Bahrain's economy.
Bahrain Fish Processing Market Growth Drivers
Several critical drivers are propelling the Bahrain Fish Processing Market forward. One of the foremost factors is the increasing consumer awareness regarding the health benefits associated with fish and seafood. As people prioritize healthier dietary choices, there is a growing inclination towards consuming processed seafood that is both convenient and nutritious. Additionally, the burgeoning hospitality and foodservice sectors in Bahrain significantly contribute to this demand, as restaurants and hotels continue to incorporate processed fish products into their menus.
- The rise in the demand for ready-to-eat and frozen seafood products aligns with consumers' busy lifestyles, enabling quick meal solutions without compromising health.
- Technological advancements in fish processing methods, including freezing, smoking, and canning, enhance product quality and shelf life, attracting more consumers and businesses.
- As Bahrain strives for food security, investing in modern processing technologies is becoming a priority, leading to greater efficiency and sustainability in production practices.
- The export potential of processed seafood is significant, as Bahrain seeks to position itself as a key supplier in the regional market, promoting economic growth and diversification.
- Increased governmental focus on the fish processing sector aims to establish Bahrain as a competitive player in the global seafood market, fostering innovation and technological integration.
Bahrain Fish Processing Market Challenges and Restraints
Despite its growth potential, the Bahrain Fish Processing Market faces several challenges. A primary concern is the limited availability of locally caught fish, which compels the industry to rely heavily on imports for raw materials. This dependence can lead to vulnerabilities concerning price fluctuations and disruptions in the global supply chain.
- Compliance with stringent food safety and hygiene regulations demands significant investments in advanced processing equipment and facilities to meet industry standards.
- Competition from international fish processing firms poses a threat, as these companies often possess larger production capacities and can maintain lower pricing strategies.
- The economic climate and price volatility in the global fish market can impact profitability and operational sustainability for local processors.
- Consumer preferences are evolving rapidly, necessitating constant innovation in product offerings to remain competitive in a crowded marketplace.
- The seasonal nature of fish availability can lead to fluctuations in production and pricing, complicating planning and inventory management for local businesses.
Bahrain Fish Processing Market Investment Opportunities
As Bahrain prioritizes food security and economic diversification, the fish processing market presents numerous investment opportunities. The increasing demand for processed seafood and innovative preservation methods offers a fertile landscape for potential investors.
- Investing in the establishment of new processing facilities can cater to growing domestic and export market needs, aligning with national objectives.
- Leveraging advanced technologies can significantly enhance product quality and operational efficiency, positioning firms competitively in the market.
- Opportunities exist for developing value-added products, such as ready-to-eat meals and specialty seafood items, to meet changing consumer demands.
- Collaborations with local fishermen can ensure sustainable sourcing of raw materials while supporting the local fishing community.
- The government's push for sustainable fishing practices opens avenues for investments in eco-friendly processing techniques and equipment.
Bahrain Fish Processing Market Government Investment and Initiatives
The Bahraini government plays an instrumental role in the development of the fish processing market. Policy frameworks are in place to promote investment in modern processing technologies that align with food security goals. This includes incentives for businesses that adopt environmentally sustainable practices while ensuring compliance with food safety and hygiene standards. The government emphasizes regulatory measures that support the industry, including import regulations designed to guarantee that processed fish products meet rigorous international standards. By fostering public-private partnerships, the government aims to stimulate growth in the seafood sector, enhancing Bahrain's position in both regional and global markets.
Bahrain Fish Processing Market Latest Developments (May 2025 - June 2026)
Recent developments within the Bahrain Fish Processing Market indicate a trend towards modernization and sustainability. Industry stakeholders are increasingly investing in advanced processing technologies to improve efficiency and product quality. There is a noticeable shift towards eco-friendly practices, reflecting a broader global movement in the food sector. Collaborations with academic institutions for research into innovative processing techniques have also gained traction, underscoring a collective effort to enhance the sector's competitiveness. Furthermore, initiatives to improve supply chain resilience are being explored amidst challenges posed by external market fluctuations.
Bahrain Fish Processing Market - Key Attractiveness of the Report
- 10 Years of Market Numbers
- Historical Data Starting from 2022 to 2025
- Base Year: 2025
- Forecast Data until 2032
- Key Performance Indicators Impacting the Market
- Major Upcoming Developments and Projects
Key Highlights of the Report:
- Bahrain Fish Processing Market Outlook
- Market Size of Bahrain Fish Processing Market, 2025
- Forecast of Bahrain Fish Processing Market, 2032F
- Historical Data and Forecast of Bahrain Fish Processing Revenues & Volume for the Period 2022-2032F
- Bahrain Fish Processing Market Trend Evolution
- Bahrain Fish Processing Market Drivers and Challenges
- Bahrain Fish Processing Price Trends
- Bahrain Fish Processing Porter's Five Forces
- Bahrain Fish Processing Industry Life Cycle
- Historical Data and Forecast of Bahrain Fish Processing Market Revenues & Volume By Source for the Period 2022-2032F
- Historical Data and Forecast of Bahrain Fish Processing Market Revenues & Volume By Marine for the Period 2022-2032F
- Historical Data and Forecast of Bahrain Fish Processing Market Revenues & Volume By Inland for the Period 2022-2032F
- Historical Data and Forecast of Bahrain Fish Processing Market Revenues & Volume By Freshwater for the Period 2022-2032F
- Historical Data and Forecast of Bahrain Fish Processing Market Revenues & Volume By Application for the Period 2022-2032F
- Historical Data and Forecast of Bahrain Fish Processing Market Revenues & Volume By Food for the Period 2022-2032F
- Historical Data and Forecast of Bahrain Fish Processing Market Revenues & Volume By Feed for the Period 2022-2032F
- Historical Data and Forecast of Bahrain Fish Processing Market Revenues & Volume By Biomedical for the Period 2022-2032F
- Historical Data and Forecast of Bahrain Fish Processing Market Revenues & Volume By Others for the Period 2022-2032F
- Historical Data and Forecast of Bahrain Fish Processing Market Revenues & Volume By Processing for the Period 2022-2032F
- Historical Data and Forecast of Bahrain Fish Processing Market Revenues & Volume By Frozen for the Period 2022-2032F
- Historical Data and Forecast of Bahrain Fish Processing Market Revenues & Volume By Preserved for the Period 2022-2032F
- Historical Data and Forecast of Bahrain Fish Processing Market Revenues & Volume By Others for the Period 2022-2032F
- Historical Data and Forecast of Bahrain Fish Processing Market Revenues & Volume By Equipment for the Period 2022-2032F
- Historical Data and Forecast of Bahrain Fish Processing Market Revenues & Volume By Gutting for the Period 2022-2032F
- Historical Data and Forecast of Bahrain Fish Processing Market Revenues & Volume By Scaling for the Period 2022-2032F
- Historical Data and Forecast of Bahrain Fish Processing Market Revenues & Volume By Filleting for the Period 2022-2032F
- Historical Data and Forecast of Bahrain Fish Processing Market Revenues & Volume By Deboning for the Period 2022-2032F
- Historical Data and Forecast of Bahrain Fish Processing Market Revenues & Volume By Skinning for the Period 2022-2032F
- Historical Data and Forecast of Bahrain Fish Processing Market Revenues & Volume By Curing & Smoking for the Period 2022-2032F
- Historical Data and Forecast of Bahrain Fish Processing Market Revenues & Volume By Others for the Period 2022-2032F
- Bahrain Fish Processing Import Export Trade Statistics
- Market Opportunity Assessment By Source
- Market Opportunity Assessment By Application
- Market Opportunity Assessment By Processing
- Market Opportunity Assessment By Equipment
- Bahrain Fish Processing Top Companies Market Share
- Bahrain Fish Processing Competitive Benchmarking By Technical and Operational Parameters
- Bahrain Fish Processing Company Profiles
- Bahrain Fish Processing Key Strategic Recommendations
Frequently Asked Questions About the Market Study (FAQs):
The market is primarily driven by increasing consumer awareness of the health benefits of seafood, the growing demand for ready-to-eat products, and the expansion of the hospitality sector.
Key challenges include reliance on imported fish, stringent regulatory requirements, and intense competition from international processors.
The government provides regulatory support, promotes sustainable fishing practices, and encourages investment in modern processing technologies.
Investors can explore opportunities for establishing new facilities, advancing processing technologies, and developing value-added seafood products to cater to growing market demand.
6Wresearch actively monitors the Bahrain Fish Processing Market and publishes its comprehensive annual report, highlighting emerging trends, growth drivers, revenue analysis, and forecast outlook. Our insights help businesses to make data-backed strategic decisions with ongoing market dynamics. Our analysts track relevent industries related to the Bahrain Fish Processing Market, allowing our clients with actionable intelligence and reliable forecasts tailored to emerging regional needs.
Yes, we provide customisation as per your requirements. To learn more, feel free to contact us on sales@6wresearch.com
1 Executive Summary |
2 Introduction |
2.1 Key Highlights of the Report |
2.2 Report Description |
2.3 Market Scope & Segmentation |
2.4 Research Methodology |
2.5 Assumptions |
3 Bahrain Fish Processing Market Overview |
3.1 Bahrain Country Macro Economic Indicators |
3.2 Bahrain Fish Processing Market Revenues & Volume, 2022 & 2032F |
3.3 Bahrain Fish Processing Market - Industry Life Cycle |
3.4 Bahrain Fish Processing Market - Porter's Five Forces |
3.5 Bahrain Fish Processing Market Revenues & Volume Share, By Source, 2022 & 2032F |
3.6 Bahrain Fish Processing Market Revenues & Volume Share, By Application, 2022 & 2032F |
3.7 Bahrain Fish Processing Market Revenues & Volume Share, By Processing, 2022 & 2032F |
3.8 Bahrain Fish Processing Market Revenues & Volume Share, By Equipment, 2022 & 2032F |
4 Bahrain Fish Processing Market Dynamics |
4.1 Impact Analysis |
4.2 Market Drivers |
4.3 Market Restraints |
5 Bahrain Fish Processing Market Trends |
6 Bahrain Fish Processing Market, By Types |
6.1 Bahrain Fish Processing Market, By Source |
6.1.1 Overview and Analysis |
6.1.2 Bahrain Fish Processing Market Revenues & Volume, By Source, 2022-2032F |
6.1.3 Bahrain Fish Processing Market Revenues & Volume, By Marine, 2022-2032F |
6.1.4 Bahrain Fish Processing Market Revenues & Volume, By Inland, 2022-2032F |
6.1.5 Bahrain Fish Processing Market Revenues & Volume, By Freshwater, 2022-2032F |
6.2 Bahrain Fish Processing Market, By Application |
6.2.1 Overview and Analysis |
6.2.2 Bahrain Fish Processing Market Revenues & Volume, By Food, 2022-2032F |
6.2.3 Bahrain Fish Processing Market Revenues & Volume, By Feed, 2022-2032F |
6.2.4 Bahrain Fish Processing Market Revenues & Volume, By Biomedical, 2022-2032F |
6.2.5 Bahrain Fish Processing Market Revenues & Volume, By Others, 2022-2032F |
6.3 Bahrain Fish Processing Market, By Processing |
6.3.1 Overview and Analysis |
6.3.2 Bahrain Fish Processing Market Revenues & Volume, By Frozen, 2022-2032F |
6.3.3 Bahrain Fish Processing Market Revenues & Volume, By Preserved, 2022-2032F |
6.3.4 Bahrain Fish Processing Market Revenues & Volume, By Others, 2022-2032F |
6.4 Bahrain Fish Processing Market, By Equipment |
6.4.1 Overview and Analysis |
6.4.2 Bahrain Fish Processing Market Revenues & Volume, By Gutting, 2022-2032F |
6.4.3 Bahrain Fish Processing Market Revenues & Volume, By Scaling, 2022-2032F |
6.4.4 Bahrain Fish Processing Market Revenues & Volume, By Filleting, 2022-2032F |
6.4.5 Bahrain Fish Processing Market Revenues & Volume, By Deboning, 2022-2032F |
6.4.6 Bahrain Fish Processing Market Revenues & Volume, By Skinning, 2022-2032F |
6.4.7 Bahrain Fish Processing Market Revenues & Volume, By Curing & Smoking, 2022-2032F |
7 Bahrain Fish Processing Market Import-Export Trade Statistics |
7.1 Bahrain Fish Processing Market Export to Major Countries |
7.2 Bahrain Fish Processing Market Imports from Major Countries |
8 Bahrain Fish Processing Market Key Performance Indicators |
9 Bahrain Fish Processing Market - Opportunity Assessment |
9.1 Bahrain Fish Processing Market Opportunity Assessment, By Source, 2022 & 2032F |
9.2 Bahrain Fish Processing Market Opportunity Assessment, By Application, 2022 & 2032F |
9.3 Bahrain Fish Processing Market Opportunity Assessment, By Processing, 2022 & 2032F |
9.4 Bahrain Fish Processing Market Opportunity Assessment, By Equipment, 2022 & 2032F |
10 Bahrain Fish Processing Market - Competitive Landscape |
10.1 Bahrain Fish Processing Market Revenue Share, By Companies, 2025 |
10.2 Bahrain Fish Processing Market Competitive Benchmarking, By Operating and Technical Parameters |
11 Company Profiles |
12 Recommendations |
13 Disclaimer |
Global Go To Market Strategy - 2030
Export potential enables firms to identify high-growth global markets with greater confidence by combining advanced trade intelligence with a structured quantitative methodology. The framework analyzes emerging demand trends and country-level import patterns while integrating macroeconomic and trade datasets such as GDP and population forecasts, bilateral import–export flows, tariff structures, elasticity differentials between developed and developing economies, geographic distance, and import demand projections. Using weighted trade values from 2020–2024 as the base period to project country-to-country export potential for 2030, these inputs are operationalized through calculated drivers such as gravity model parameters, tariff impact factors, and projected GDP per-capita growth. Through an analysis of hidden potentials, demand hotspots, and market conditions that are most favorable to success, this method enables firms to focus on target countries, maximize returns, and global expansion with data, backed by accuracy.
By factoring in the projected importer demand gap that is currently unmet and could be potential opportunity, it identifies the potential for the Exporter (Country) among 190 countries, against the general trade analysis, which identifies the biggest importer or exporter.
To discover high-growth global markets and optimize your business strategy:
Click Here
Pricing
- Single User License$ 1,995
- Department License$ 2,400
- Site License$ 3,120
- Global License$ 3,795

Leadership Perspectives from Industry Events
Search
Thought Leadership and Analyst Meet


Our Clients
6WResearch In News
- India Air Conditioner Market Set for Strong Rebound in 2026 After Weather-Led Correction and GST-Driven Recovery: 6Wresearch
- ADAS in India: How Automatic Emergency Braking, Blind Spot Detection & Driver Monitoring are Transforming Road Safety
- Doha a strategic location for EV manufacturing hub: IPA Qatar
- Demand for luxury TVs surging in the GCC, says Samsung
- Empowering Growth: The Thriving Journey of Bangladesh’s Cable Industry
- Demand for luxury TVs surging in the GCC, says Samsung
Latest Reports
- Poland Fire Protection Systems Market (2026-2032)
- Cape Verde Portable Hand-Thrown Extinguisher Market (2026-2032)
- Canada Portable Hand-Thrown Extinguisher Market (2026-2032)
- Cameroon Portable Hand-Thrown Extinguisher Market (2026-2032)
- Burundi Portable Hand-Thrown Extinguisher Market (2026-2032)
- Burkina Faso Portable Hand-Thrown Extinguisher Market (2026-2032)
- Bulgaria Portable Hand-Thrown Extinguisher Market (2026-2032)
- Brunei Portable Hand-Thrown Extinguisher Market (2026-2032)
- Botswana Portable Hand-Thrown Extinguisher Market (2026-2032)
- Bosnia and Herzegovina Portable Hand-Thrown Extinguisher Market (2026-2032)
Industry Events and Analyst Meet

HIMTEX 2026

India Refining Summit 2026

India EV Show 2026

EV tech India Expo 2026

Auto Tech Asia 2026
Whitepaper
- Middle East & Africa Commercial Security Market Click here to view more.
- Middle East & Africa Fire Safety Systems & Equipment Market Click here to view more.
- GCC Drone Market Click here to view more.
- Middle East Lighting Fixture Market Click here to view more.
- GCC Physical & Perimeter Security Market Click here to view more.