Belgium Control Valves Market (2026-2032) | Demand, Restraints, Revenue, Analysis, Strategy, Value, Consumer Insights, Drivers, Forecast, Outlook, Companies, Investment Trends, Opportunities, Competitive, Segmentation, Size, Industry, Segments, Supply, Growth, Pricing Analysis, Challenges, Strategic Insights, Competition, Trends, Share
Market Forecast By Product Type (Ball Valves, Globe Valves, Gate Valves, Butterfly Valves), By Valve Type (Manual Control, Automatic Control, Pneumatic Control, Electric Control), By Application Area (Oil & Gas, Chemical Processing, Water Treatment, HVAC Systems), By End User (Industrial Plants, Petrochemical Industry, Municipal Utilities, Commercial Buildings) And Competitive Landscape
| Product Code: ETC10540738 | Publication Date: Apr 2025 | Updated Date: Apr 2026 | Product Type: Market Research Report | |
| Publisher: 6Wresearch | Author: Bhawna Singh | No. of Pages: 65 | No. of Figures: 34 | No. of Tables: 19 |
Belgium Control Valves Market Size (2020-2030)
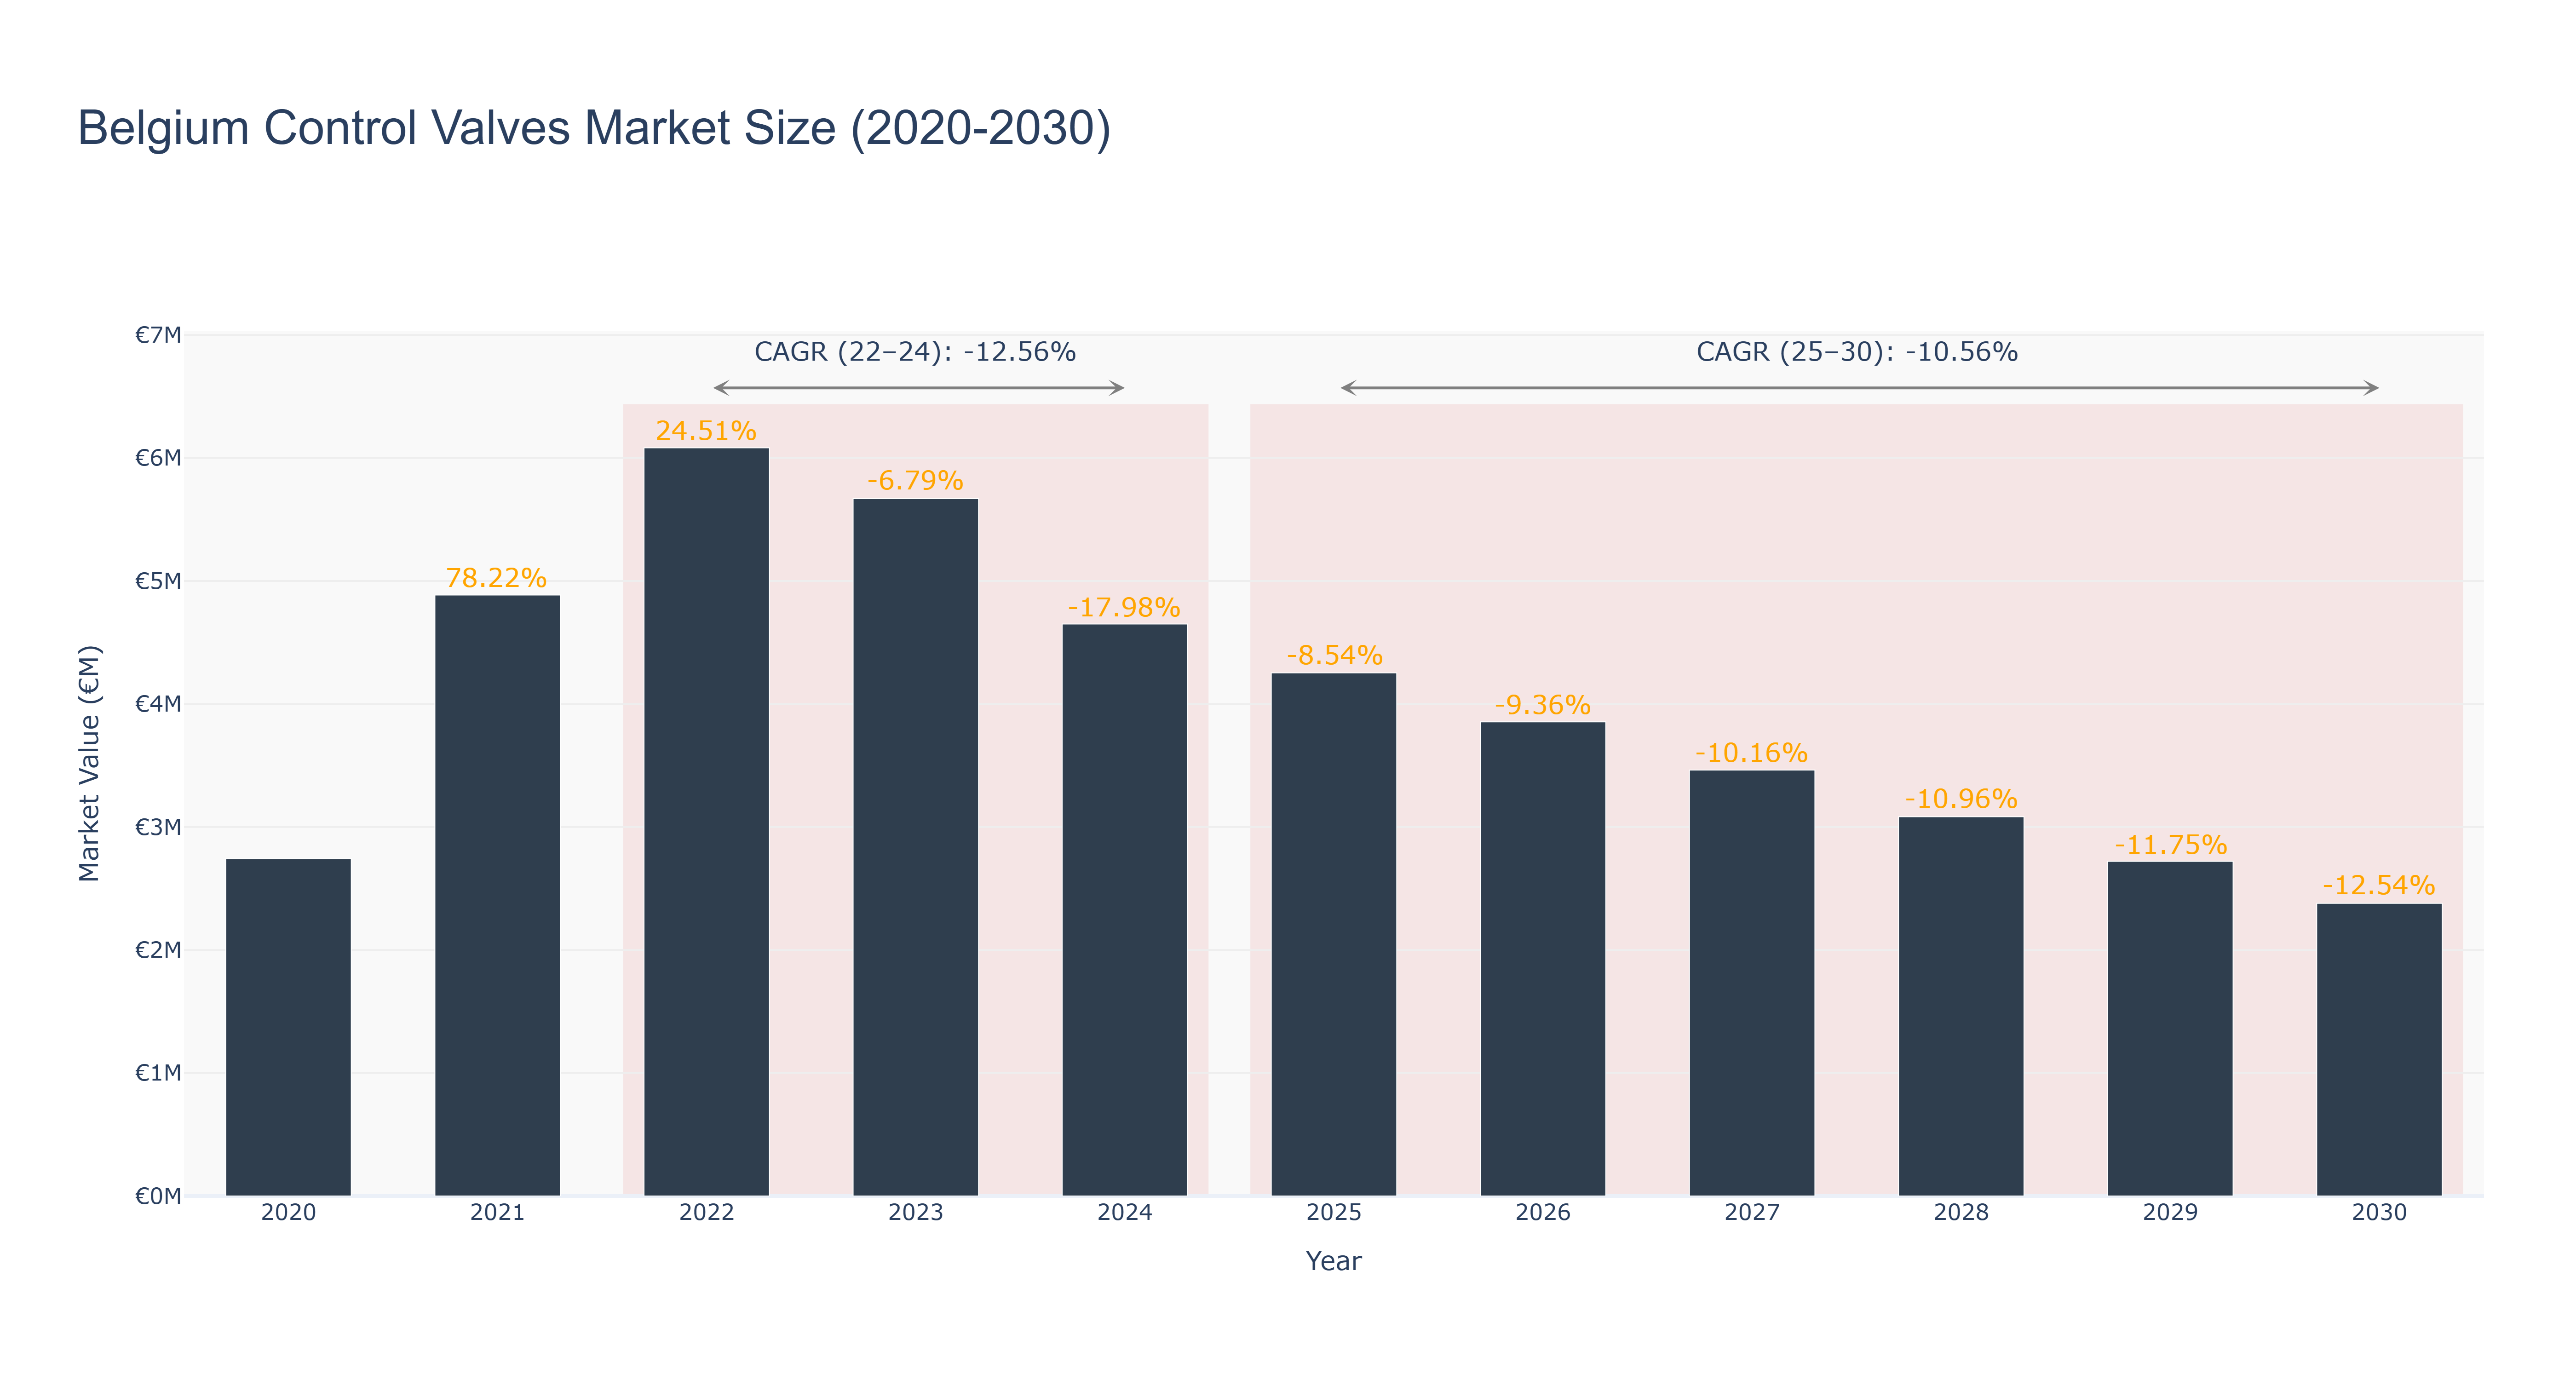
Belgium Control Valves Market witnessed a peak market size of €6.08 million in 2022, followed by a decline to €4.65 million in 2024. The market is forecasted to continue shrinking, with an expected size of €2.38 million by 2030. The CAGR for the period 2022-24 stands at -12.56%, while for 2025-30, it is projected at -10.56%. The market downturn can be attributed to factors such as economic slowdown, increased competition, and technological disruptions impacting demand. Despite the challenging environment, recent developments in the market indicate a shift towards more energy-efficient control valves and increased focus on automation solutions to enhance operational efficiency. Future developments may include collaborations with IoT providers to offer smart control valve solutions tailored to specific industry needs. These initiatives aim to revitalize the market and drive growth in the coming years.
Belgium Control Valves Market: Production & Trade Performance (2019-2025)
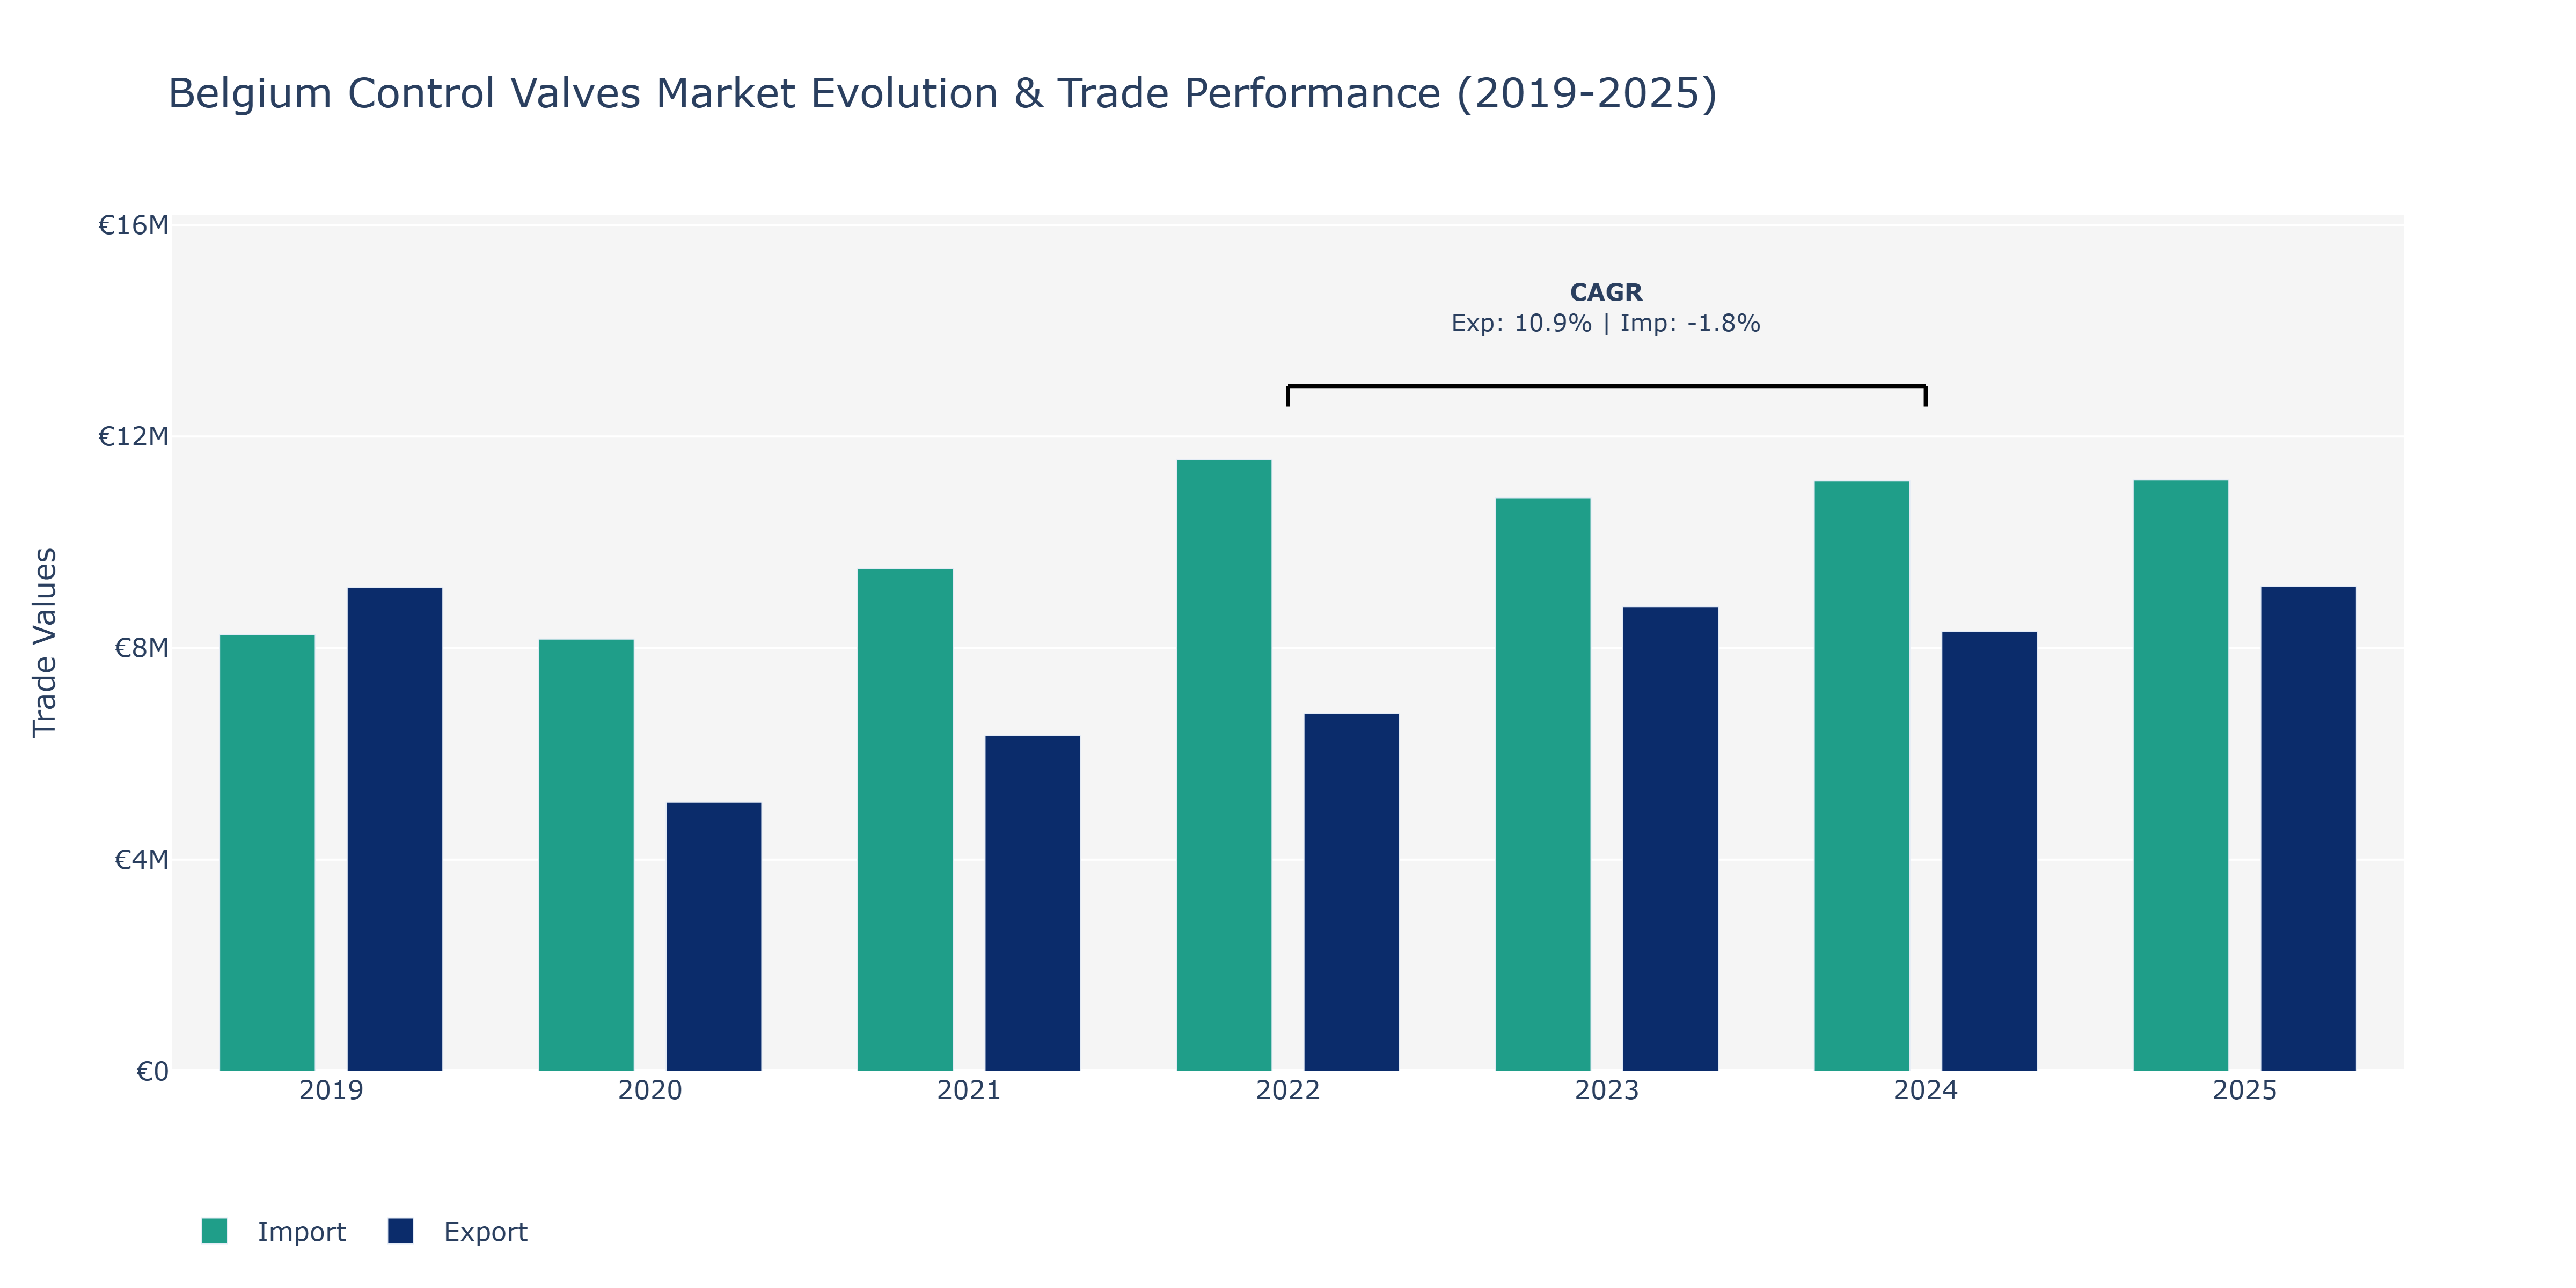
In the Belgium Control Valves Market, exports experienced a notable fluctuation over the years. Starting at €9.14 million in 2019, exports declined sharply to €5.09 million in 2020 before rebounding to €6.34 million in 2021. The upward trend continued in the following years, reaching a peak of €9.16 million in 2025. Conversely, imports demonstrated a more stable pattern, beginning at €8.25 million in 2019 and showing consistent growth year over year until 2023, peaking at €11.06 million, before slightly decreasing to €11.18 million in 2024 and 2025. The fluctuations in exports can be attributed to global economic conditions, shifts in demand for control valves, and trade policies. Imports, on the other hand, reflect Belgium's reliance on foreign suppliers for control valves and the country's role as a key player in the European market. To sustain export growth, market players may need to focus on innovation, competitive pricing, and strategic partnerships to meet evolving market demands and remain competitive globally.
Key Highlights of the Report:
- Belgium Control Valves Market Outlook
- Market Size of Belgium Control Valves Market, 2025
- Forecast of Belgium Control Valves Market, 2032
- Historical Data and Forecast of Belgium Control Valves Revenues & Volume for the Period 2022 - 2032F
- Belgium Control Valves Market Trend Evolution
- Belgium Control Valves Market Drivers and Challenges
- Belgium Control Valves Price Trends
- Belgium Control Valves Porter's Five Forces
- Belgium Control Valves Industry Life Cycle
- Historical Data and Forecast of Belgium Control Valves Market Revenues & Volume By Product Type for the Period 2022 - 2032F
- Historical Data and Forecast of Belgium Control Valves Market Revenues & Volume By Ball Valves for the Period 2022 - 2032F
- Historical Data and Forecast of Belgium Control Valves Market Revenues & Volume By Globe Valves for the Period 2022 - 2032F
- Historical Data and Forecast of Belgium Control Valves Market Revenues & Volume By Gate Valves for the Period 2022 - 2032F
- Historical Data and Forecast of Belgium Control Valves Market Revenues & Volume By Butterfly Valves for the Period 2022 - 2032F
- Historical Data and Forecast of Belgium Control Valves Market Revenues & Volume By Valve Type for the Period 2022 - 2032F
- Historical Data and Forecast of Belgium Control Valves Market Revenues & Volume By Manual Control for the Period 2022 - 2032F
- Historical Data and Forecast of Belgium Control Valves Market Revenues & Volume By Automatic Control for the Period 2022 - 2032F
- Historical Data and Forecast of Belgium Control Valves Market Revenues & Volume By Pneumatic Control for the Period 2022 - 2032F
- Historical Data and Forecast of Belgium Control Valves Market Revenues & Volume By Electric Control for the Period 2022 - 2032F
- Historical Data and Forecast of Belgium Control Valves Market Revenues & Volume By Application Area for the Period 2022 - 2032F
- Historical Data and Forecast of Belgium Control Valves Market Revenues & Volume By Oil & Gas for the Period 2022 - 2032F
- Historical Data and Forecast of Belgium Control Valves Market Revenues & Volume By Chemical Processing for the Period 2022 - 2032F
- Historical Data and Forecast of Belgium Control Valves Market Revenues & Volume By Water Treatment for the Period 2022 - 2032F
- Historical Data and Forecast of Belgium Control Valves Market Revenues & Volume By HVAC Systems for the Period 2022 - 2032F
- Historical Data and Forecast of Belgium Control Valves Market Revenues & Volume By End User for the Period 2022 - 2032F
- Historical Data and Forecast of Belgium Control Valves Market Revenues & Volume By Industrial Plants for the Period 2022 - 2032F
- Historical Data and Forecast of Belgium Control Valves Market Revenues & Volume By Petrochemical Industry for the Period 2022 - 2032F
- Historical Data and Forecast of Belgium Control Valves Market Revenues & Volume By Municipal Utilities for the Period 2022 - 2032F
- Historical Data and Forecast of Belgium Control Valves Market Revenues & Volume By Commercial Buildings for the Period 2022 - 2032F
- Belgium Control Valves Import Export Trade Statistics
- Market Opportunity Assessment By Product Type
- Market Opportunity Assessment By Valve Type
- Market Opportunity Assessment By Application Area
- Market Opportunity Assessment By End User
- Belgium Control Valves Top Companies Market Share
- Belgium Control Valves Competitive Benchmarking By Technical and Operational Parameters
- Belgium Control Valves Company Profiles
- Belgium Control Valves Key Strategic Recommendations
Frequently Asked Questions About the Market Study (FAQs):
6Wresearch actively monitors the Belgium Control Valves Market and publishes its comprehensive annual report, highlighting emerging trends, growth drivers, revenue analysis, and forecast outlook. Our insights help businesses to make data-backed strategic decisions with ongoing market dynamics. Our analysts track relevent industries related to the Belgium Control Valves Market, allowing our clients with actionable intelligence and reliable forecasts tailored to emerging regional needs.
Yes, we provide customisation as per your requirements. To learn more, feel free to contact us on sales@6wresearch.com
1 Executive Summary |
2 Introduction |
2.1 Key Highlights of the Report |
2.2 Report Description |
2.3 Market Scope & Segmentation |
2.4 Research Methodology |
2.5 Assumptions |
3 Belgium Control Valves Market Overview |
3.1 Belgium Country Macro Economic Indicators |
3.2 Belgium Control Valves Market Revenues & Volume, 2022 & 2032F |
3.3 Belgium Control Valves Market - Industry Life Cycle |
3.4 Belgium Control Valves Market - Porter's Five Forces |
3.5 Belgium Control Valves Market Revenues & Volume Share, By Product Type, 2022 & 2032F |
3.6 Belgium Control Valves Market Revenues & Volume Share, By Valve Type, 2022 & 2032F |
3.7 Belgium Control Valves Market Revenues & Volume Share, By Application Area, 2022 & 2032F |
3.8 Belgium Control Valves Market Revenues & Volume Share, By End User, 2022 & 2032F |
4 Belgium Control Valves Market Dynamics |
4.1 Impact Analysis |
4.2 Market Drivers |
4.2.1 Increasing demand for energy efficiency and process optimization in industries |
4.2.2 Growing emphasis on automation and digitalization in manufacturing processes |
4.2.3 Favorable government initiatives and regulations promoting the use of control valves |
4.3 Market Restraints |
4.3.1 High initial investment cost associated with advanced control valve systems |
4.3.2 Technical complexities in integration and maintenance of control valves |
4.3.3 Slow adoption rate in certain industries due to lack of awareness about the benefits |
5 Belgium Control Valves Market Trends |
6 Belgium Control Valves Market, By Types |
6.1 Belgium Control Valves Market, By Product Type |
6.1.1 Overview and Analysis |
6.1.2 Belgium Control Valves Market Revenues & Volume, By Product Type, 2022 - 2032F |
6.1.3 Belgium Control Valves Market Revenues & Volume, By Ball Valves, 2022 - 2032F |
6.1.4 Belgium Control Valves Market Revenues & Volume, By Globe Valves, 2022 - 2032F |
6.1.5 Belgium Control Valves Market Revenues & Volume, By Gate Valves, 2022 - 2032F |
6.1.6 Belgium Control Valves Market Revenues & Volume, By Butterfly Valves, 2022 - 2032F |
6.2 Belgium Control Valves Market, By Valve Type |
6.2.1 Overview and Analysis |
6.2.2 Belgium Control Valves Market Revenues & Volume, By Manual Control, 2022 - 2032F |
6.2.3 Belgium Control Valves Market Revenues & Volume, By Automatic Control, 2022 - 2032F |
6.2.4 Belgium Control Valves Market Revenues & Volume, By Pneumatic Control, 2022 - 2032F |
6.2.5 Belgium Control Valves Market Revenues & Volume, By Electric Control, 2022 - 2032F |
6.3 Belgium Control Valves Market, By Application Area |
6.3.1 Overview and Analysis |
6.3.2 Belgium Control Valves Market Revenues & Volume, By Oil & Gas, 2022 - 2032F |
6.3.3 Belgium Control Valves Market Revenues & Volume, By Chemical Processing, 2022 - 2032F |
6.3.4 Belgium Control Valves Market Revenues & Volume, By Water Treatment, 2022 - 2032F |
6.3.5 Belgium Control Valves Market Revenues & Volume, By HVAC Systems, 2022 - 2032F |
6.4 Belgium Control Valves Market, By End User |
6.4.1 Overview and Analysis |
6.4.2 Belgium Control Valves Market Revenues & Volume, By Industrial Plants, 2022 - 2032F |
6.4.3 Belgium Control Valves Market Revenues & Volume, By Petrochemical Industry, 2022 - 2032F |
6.4.4 Belgium Control Valves Market Revenues & Volume, By Municipal Utilities, 2022 - 2032F |
6.4.5 Belgium Control Valves Market Revenues & Volume, By Commercial Buildings, 2022 - 2032F |
7 Belgium Control Valves Market Import-Export Trade Statistics |
7.1 Belgium Control Valves Market Export to Major Countries |
7.2 Belgium Control Valves Market Imports from Major Countries |
8 Belgium Control Valves Market Key Performance Indicators |
8.1 Energy savings achieved through the use of control valves |
8.2 Reduction in downtime and maintenance costs with the implementation of control valve automation |
8.3 Increase in productivity and efficiency in industries using control valves |
9 Belgium Control Valves Market - Opportunity Assessment |
9.1 Belgium Control Valves Market Opportunity Assessment, By Product Type, 2022 & 2032F |
9.2 Belgium Control Valves Market Opportunity Assessment, By Valve Type, 2022 & 2032F |
9.3 Belgium Control Valves Market Opportunity Assessment, By Application Area, 2022 & 2032F |
9.4 Belgium Control Valves Market Opportunity Assessment, By End User, 2022 & 2032F |
10 Belgium Control Valves Market - Competitive Landscape |
10.1 Belgium Control Valves Market Revenue Share, By Companies, 2025 |
10.2 Belgium Control Valves Market Competitive Benchmarking, By Operating and Technical Parameters |
11 Company Profiles |
12 Recommendations |
13 Disclaimer |
Global Go To Market Strategy - 2030
Export potential enables firms to identify high-growth global markets with greater confidence by combining advanced trade intelligence with a structured quantitative methodology. The framework analyzes emerging demand trends and country-level import patterns while integrating macroeconomic and trade datasets such as GDP and population forecasts, bilateral import–export flows, tariff structures, elasticity differentials between developed and developing economies, geographic distance, and import demand projections. Using weighted trade values from 2020–2024 as the base period to project country-to-country export potential for 2030, these inputs are operationalized through calculated drivers such as gravity model parameters, tariff impact factors, and projected GDP per-capita growth. Through an analysis of hidden potentials, demand hotspots, and market conditions that are most favorable to success, this method enables firms to focus on target countries, maximize returns, and global expansion with data, backed by accuracy.
By factoring in the projected importer demand gap that is currently unmet and could be potential opportunity, it identifies the potential for the Exporter (Country) among 190 countries, against the general trade analysis, which identifies the biggest importer or exporter.
To discover high-growth global markets and optimize your business strategy:
Click Here
Pricing
- Single User License$ 1,995
- Department License$ 2,400
- Site License$ 3,120
- Global License$ 3,795

Leadership Perspectives from Industry Events
Search
Thought Leadership and Analyst Meet


Our Clients
6WResearch In News
- Doha a strategic location for EV manufacturing hub: IPA Qatar
- Demand for luxury TVs surging in the GCC, says Samsung
- Empowering Growth: The Thriving Journey of Bangladesh’s Cable Industry
- Demand for luxury TVs surging in the GCC, says Samsung
- Video call with a traditional healer? Once unthinkable, it’s now common in South Africa
- Intelligent Buildings To Smooth GCC’s Path To Net Zero
Latest Reports
- Cape Verde Portable Hand-Thrown Extinguisher Market (2026-2032)
- Canada Portable Hand-Thrown Extinguisher Market (2026-2032)
- Cameroon Portable Hand-Thrown Extinguisher Market (2026-2032)
- Burundi Portable Hand-Thrown Extinguisher Market (2026-2032)
- Burkina Faso Portable Hand-Thrown Extinguisher Market (2026-2032)
- Bulgaria Portable Hand-Thrown Extinguisher Market (2026-2032)
- Brunei Portable Hand-Thrown Extinguisher Market (2026-2032)
- Botswana Portable Hand-Thrown Extinguisher Market (2026-2032)
- Bosnia and Herzegovina Portable Hand-Thrown Extinguisher Market (2026-2032)
- Bolivia Portable Hand-Thrown Extinguisher Market (2026-2032)
Industry Events and Analyst Meet

HIMTEX 2026

India Refining Summit 2026

India EV Show 2026

EV tech India Expo 2026

Auto Tech Asia 2026
Whitepaper
- Middle East & Africa Commercial Security Market Click here to view more.
- Middle East & Africa Fire Safety Systems & Equipment Market Click here to view more.
- GCC Drone Market Click here to view more.
- Middle East Lighting Fixture Market Click here to view more.
- GCC Physical & Perimeter Security Market Click here to view more.