Brazil Computer Power Cable Assemblies Market (2026-2032) | Trends, Companies, Value, Revenue, Forecast, Size, Share, Growth, Outlook, Industry & Analysis
Market Forecast By Types (4-Pin Molex, 20-Pin ATX, 26-Pin MDR, 26-Pin SDR), By Applications (PC, Laptop, Super Computer, Others) And Competitive Landscape
| Product Code: ETC032422 | Publication Date: Oct 2020 | Updated Date: Jun 2026 | Product Type: Report | |
| Publisher: 6Wresearch | Author: Ravi Bhandari | No. of Pages: 70 | No. of Figures: 35 | No. of Tables: 5 |
Brazil Computer Power Cable Assemblies Market Summary
The brazil computer power cable assemblies market was estimated at USD 190 Million in 2025 and is projected to reach USD 225 Million by 2032, growing at a CAGR of 2.7% from 2026 to 2032.
Brazil Computer Power Cable Assemblies Market Growth Rate Analysis (2021-2032)
The Brazilian Computer Power Cable Assemblies market experienced a notable rebound from a decline of 1.8% in 2021, fueled primarily by increased domestic demand and investments in the technology sector. In 2022, growth surged to 5.0%, driven by expanding infrastructure projects and a shift toward digitalization, which necessitated enhanced connectivity solutions. As we moved into 2023, growth stabilized at 3.9%, reflecting ongoing consumer demand and an energy transition focused on sustainability. The forecast indicates a healthy 4.1% rise in 2024, before it moderates slightly over the following years. Continued investments in renewable energy and advancements in assembly technologies will likely sustain this upward trend through 2032.
Brazil Computer Power Cable Assemblies Market Year-wise Growth Rate and Key Drivers
This graph highlights how the Brazil Computer Power Cable Assemblies Market has steadily grown over the past five years, supported by major growth factors.
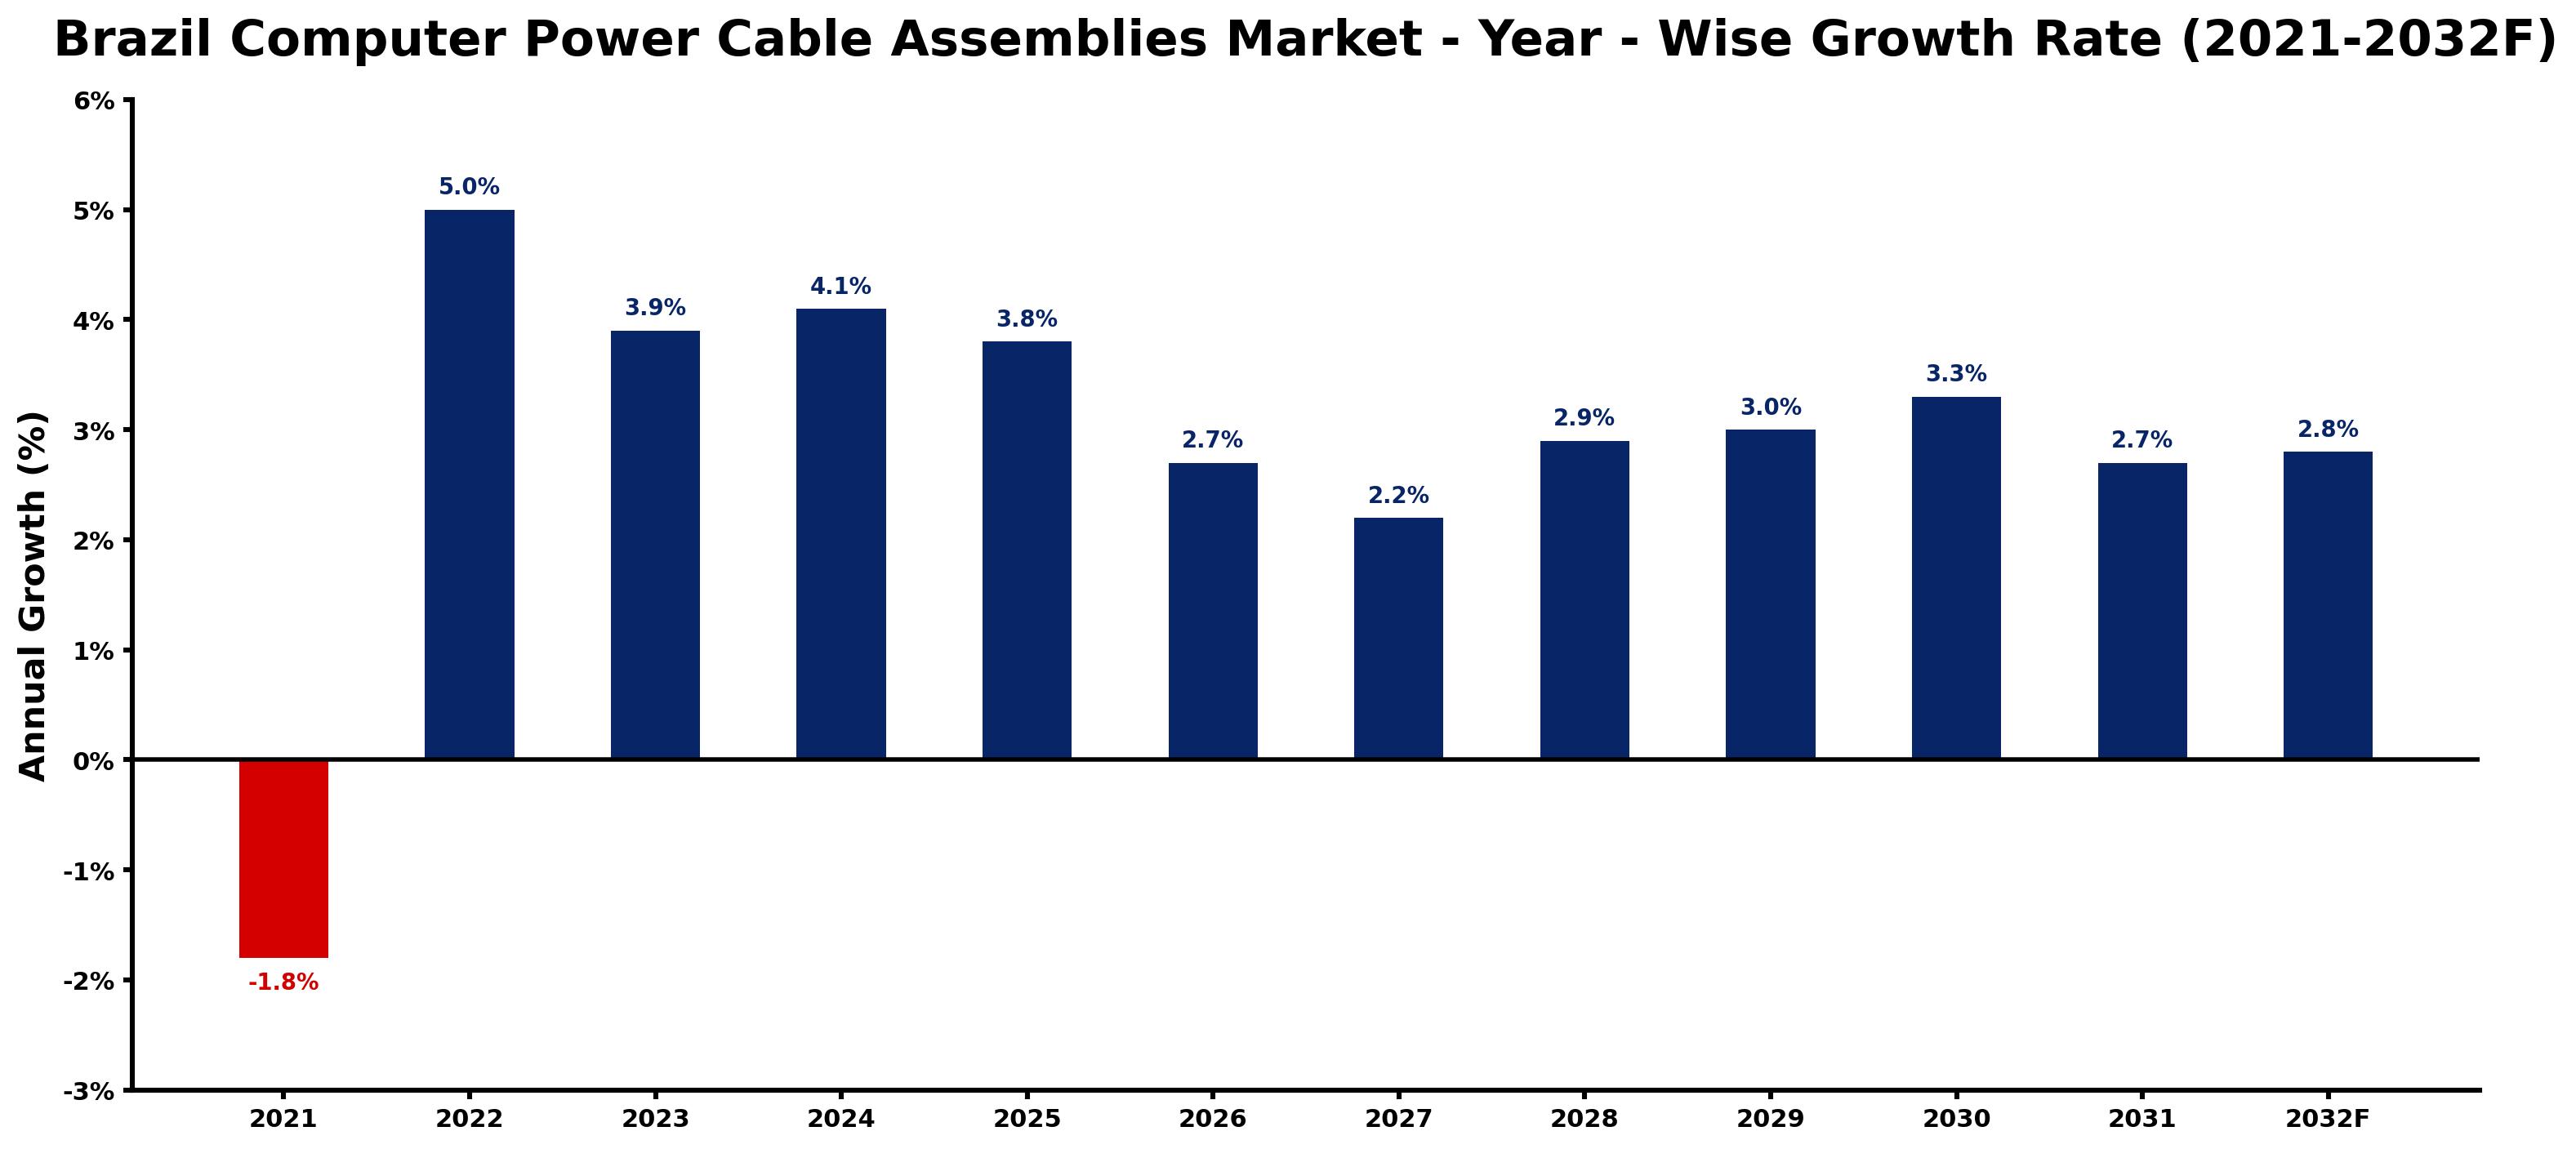
The table below presents the year wise growth rates along with the key drivers influencing the market
| Year | Growth Rate | Major Drivers |
| 2021 | -1.8% | Increased competition from alternative technologies diminished the demand for traditional computer power cable assemblies. |
| 2022 | 5.0% | Legacy copper grid failures highlighted the need for more resilient power solutions. |
| 2023 | 3.9% | Corporate budgets prioritizing energy efficiency started increasing investments in cable assemblies. |
| 2024 | 4.1% | The construction boom in cities boosted demand for reliable power distribution systems. |
| 2025 | 3.8% | Technological innovations led to the emergence of smarter cable assembly solutions. |
| 2026 | 2.7% | Integrating renewable energy sources intensified the need for specialized power cables. |
| 2027 | 2.2% | Local manufacturers began optimizing supply chains to enhance production efficiency. |
| 2028 | 2.9% | The rise of electric vehicles spotlighted the importance of high-capacity cable assemblies. |
| 2029 | 3.0% | Infrastructure projects aimed at sustainability reshaped market dynamics for cable suppliers. |
| 2030 | 3.3% | Global partnerships focused on technology transfer improved local manufacturing capabilities. |
| 2031 | 2.7% | Consumer electronics growth spurred demand for advanced power cable technologies. |
| 2032 | 2.8% | Investment in smart cities propelled innovations in power cable assembly designs. |
Note - Market size estimations and growth projections presented in this report are based on 6Wresearch's advanced forecasting approach, validated with industry datasets as of June 2026.
Brazil Computer Power Cable Assemblies Market Synopsis
The Brazil Computer Power Cable Assemblies Market is projected to reach 2.7% and witness significant growth during the forecast period (2026-2032). This expansion is primarily driven by the increasing reliance on information technology and the rising number of electronic devices across various sectors. As businesses and consumers alike seek reliable power connectivity solutions for computers and data centers, the demand for durable and compliant cable assemblies continues to surge. Manufacturers are positioned to enhance product safety and longevity to meet the stringent requirements set forth by the IT industry.
Brazil Computer Power Cable Assemblies Market Growth Drivers
The growth of the Brazil Computer Power Cable Assemblies Market can be attributed to several key factors that are driving demand for power connectivity solutions:
- The increasing dependence on electronic devices is a significant driver, as consumers and businesses continue to integrate advanced technologies into their operations.
- There is an escalating demand for reliable power connections within both personal computers and peripheral devices, which is pivotal to efficient operations.
- Manufacturers are placing a strong emphasis on meeting safety standards and ensuring compliance with local regulations, enhancing product acceptance in the market.
- The necessity for efficient power transmission systems contributes positively to the adoption of high-quality cable assemblies, further propelling market demand.
- The burgeoning data center sector in Brazil, which relies heavily on robust power cable solutions, is a major contributor to the overall growth of the market.
Brazil Computer Power Cable Assemblies Market Challenges and Restraints
Despite the positive growth trajectory, the Brazil Computer Power Cable Assemblies Market faces several challenges that could hinder its expansion:
- Rapid technological advancements present a challenge, as manufacturers must continuously evolve their products to keep pace with new developments.
- Compatibility issues among various devices pose a significant challenge, necessitating that cable assemblies are designed for versatility and adaptability.
- Demand for durable and efficient cables is high, placing pressure on manufacturers to innovate while maintaining cost-effectiveness in production.
- Market dynamics are complicated by fluctuating raw material costs, which can impact production and pricing strategies.
- The increasing need for energy-efficient solutions is creating an imperative for manufacturers to focus not only on performance but also on environmental sustainability.
Brazil Computer Power Cable Assemblies Market Government Investment and Initiatives
The Brazilian government is playing a proactive role in evolving the market through various policies and initiatives aimed at bolstering the electronics industry:
- Government policies that promote technological innovation have been pivotal in fostering a conducive environment for investment in the electronics sector, including computer power cable assemblies.
- Public spending on infrastructure developments, especially in the information technology domain, enhances demand for high-quality power cable solutions.
- The enforcement of stringent safety standards and regulations ensures that products meet safety and quality compliance, benefiting consumers and manufacturers alike.
- Incentives for adopting energy-efficient technologies are encouraging manufacturers to produce environmentally sustainable cable assemblies.
- Collaborative efforts between government bodies and industry stakeholders aim to enhance research and development efforts within Brazil's electronics sector, contributing to market growth.
Brazil Computer Power Cable Assemblies Market Latest Developments (May 2025 - June 2026)
Recent developments in the Brazil Computer Power Cable Assemblies Market reflect an industry in flux, shaped by various market and technological trends:
- Innovation in product design is becoming increasingly prevalent as manufacturers seek to differentiate their offerings through enhanced durability and performance.
- Adoption of smart technologies is influencing product development, with a growing focus on automation and smart grid solutions for efficient energy management.
- There has been a noticeable shift towards sustainability, with companies actively exploring eco-friendly materials for production to meet consumer and regulatory demands.
- Regional partnerships are emerging, aimed at sharing technological advancements and fostering collaboration between local manufacturers and international players.
- Industry conferences and forums in Brazil are serving as platforms for stakeholders to discuss challenges and innovations shaping the future of computer power cable assemblies.
Brazil Computer Power Cable Assemblies Market - Key Attractiveness of the Report
- 10 Years of Market Numbers
- Historical Data Starting from 2022 to 2025
- Base Year: 2025
- Forecast Data until 2032
- Key Performance Indicators Impacting the Market
- Major Upcoming Developments and Projects
Key Highlights of the Report:
- Brazil Computer Power Cable Assemblies Market Outlook
- Market Size of Brazil Computer Power Cable Assemblies Market, 2025
- Forecast of Brazil Computer Power Cable Assemblies Market, 2032
- Historical Data and Forecast of Brazil Computer Power Cable Assemblies Revenues & Volume for the Period 2022-2032F
- Brazil Computer Power Cable Assemblies Market Trend Evolution
- Brazil Computer Power Cable Assemblies Market Drivers and Challenges
- Brazil Computer Power Cable Assemblies Price Trends
- Brazil Computer Power Cable Assemblies Porter's Five Forces
- Brazil Computer Power Cable Assemblies Industry Life Cycle
- Historical Data and Forecast of Brazil Computer Power Cable Assemblies Market Revenues & Volume By Types for the Period 2022-2032F
- Historical Data and Forecast of Brazil Computer Power Cable Assemblies Market Revenues & Volume By 4-Pin Molex for the Period 2022-2032F
- Historical Data and Forecast of Brazil Computer Power Cable Assemblies Market Revenues & Volume By 20-Pin ATX for the Period 2022-2032F
- Historical Data and Forecast of Brazil Computer Power Cable Assemblies Market Revenues & Volume By 26-Pin MDR for the Period 2022-2032F
- Historical Data and Forecast of Brazil Computer Power Cable Assemblies Market Revenues & Volume By 26-Pin SDR for the Period 2022-2032F
- Historical Data and Forecast of Brazil Computer Power Cable Assemblies Market Revenues & Volume By Applications for the Period 2022-2032F
- Historical Data and Forecast of Brazil Computer Power Cable Assemblies Market Revenues & Volume By PC for the Period 2022-2032F
- Historical Data and Forecast of Brazil Computer Power Cable Assemblies Market Revenues & Volume By Laptop for the Period 2022-2032F
- Historical Data and Forecast of Brazil Computer Power Cable Assemblies Market Revenues & Volume By Super Computer for the Period 2022-2032F
- Historical Data and Forecast of Brazil Computer Power Cable Assemblies Market Revenues & Volume By Others for the Period 2022-2032F
- Brazil Computer Power Cable Assemblies Import Export Trade Statistics
- Market Opportunity Assessment By Types
- Market Opportunity Assessment By Applications
- Brazil Computer Power Cable Assemblies Top Companies Market Share
- Brazil Computer Power Cable Assemblies Competitive Benchmarking By Technical and Operational Parameters
- Brazil Computer Power Cable Assemblies Company Profiles
- Brazil Computer Power Cable Assemblies Key Strategic Recommendations
Frequently Asked Questions About the Market Study (FAQs):
The growth is primarily driven by the increasing reliance on electronic devices, the need for reliable power connections, emphasis on safety standards, and the expanding data center sector.
Challenges include rapid technological advancements, compatibility issues, fluctuating raw material costs, and the demand for environmentally sustainable solutions.
Government initiatives promoting innovation, public spending on infrastructure, and regulations ensuring product safety are crucial in shaping the market dynamics.
Recent developments include innovation in product design, adoption of smart technologies, a shift towards sustainability, and regional partnerships for collaborative growth.
6Wresearch actively monitors the Brazil Computer Power Cable Assemblies Market and publishes its comprehensive annual report, highlighting emerging trends, growth drivers, revenue analysis, and forecast outlook. Our insights help businesses to make data-backed strategic decisions with ongoing market dynamics. Our analysts track relevent industries related to the Brazil Computer Power Cable Assemblies Market, allowing our clients with actionable intelligence and reliable forecasts tailored to emerging regional needs.
Yes, we provide customisation as per your requirements. To learn more, feel free to contact us on sales@6wresearch.com
1 Executive Summary |
2 Introduction |
2.1 Key Highlights of the Report |
2.2 Report Description |
2.3 Market Scope & Segmentation |
2.4 Research Methodology |
2.5 Assumptions |
3 Brazil Computer Power Cable Assemblies Market Overview |
3.1 Brazil Country Macro Economic Indicators |
3.2 Brazil Computer Power Cable Assemblies Market Revenues & Volume, 2022 & 2032F |
3.3 Brazil Computer Power Cable Assemblies Market - Industry Life Cycle |
3.4 Brazil Computer Power Cable Assemblies Market - Porter's Five Forces |
3.5 Brazil Computer Power Cable Assemblies Market Revenues & Volume Share, By Types, 2022 & 2032F |
3.6 Brazil Computer Power Cable Assemblies Market Revenues & Volume Share, By Applications, 2022 & 2032F |
4 Brazil Computer Power Cable Assemblies Market Dynamics |
4.1 Impact Analysis |
4.2 Market Drivers |
4.2.1 Increasing demand for computers and related peripherals in Brazil |
4.2.2 Growth in the IT and electronics industry in Brazil |
4.2.3 Rising awareness about energy efficiency and safety in power cable assemblies |
4.3 Market Restraints |
4.3.1 Fluctuating prices of raw materials used in manufacturing power cable assemblies |
4.3.2 Stringent regulations and standards governing the production and sale of power cable assemblies |
5 Brazil Computer Power Cable Assemblies Market Trends |
6 Brazil Computer Power Cable Assemblies Market, By Types |
6.1 Brazil Computer Power Cable Assemblies Market, By Types |
6.1.1 Overview and Analysis |
6.1.2 Brazil Computer Power Cable Assemblies Market Revenues & Volume, By Types, 2022-2032F |
6.1.3 Brazil Computer Power Cable Assemblies Market Revenues & Volume, By 4-Pin Molex, 2022-2032F |
6.1.4 Brazil Computer Power Cable Assemblies Market Revenues & Volume, By 20-Pin ATX, 2022-2032F |
6.1.5 Brazil Computer Power Cable Assemblies Market Revenues & Volume, By 26-Pin MDR, 2022-2032F |
6.1.6 Brazil Computer Power Cable Assemblies Market Revenues & Volume, By 26-Pin SDR, 2022-2032F |
6.2 Brazil Computer Power Cable Assemblies Market, By Applications |
6.2.1 Overview and Analysis |
6.2.2 Brazil Computer Power Cable Assemblies Market Revenues & Volume, By PC, 2022-2032F |
6.2.3 Brazil Computer Power Cable Assemblies Market Revenues & Volume, By Laptop, 2022-2032F |
6.2.4 Brazil Computer Power Cable Assemblies Market Revenues & Volume, By Super Computer, 2022-2032F |
6.2.5 Brazil Computer Power Cable Assemblies Market Revenues & Volume, By Others, 2022-2032F |
7 Brazil Computer Power Cable Assemblies Market Import-Export Trade Statistics |
7.1 Brazil Computer Power Cable Assemblies Market Export to Major Countries |
7.2 Brazil Computer Power Cable Assemblies Market Imports from Major Countries |
8 Brazil Computer Power Cable Assemblies Market Key Performance Indicators |
8.1 Average selling price of computer power cable assemblies |
8.2 Number of new product launches in the computer power cable market in Brazil |
8.3 Adoption rate of energy-efficient power cable assemblies in Brazil |
9 Brazil Computer Power Cable Assemblies Market - Opportunity Assessment |
9.1 Brazil Computer Power Cable Assemblies Market Opportunity Assessment, By Types, 2022 & 2032F |
9.2 Brazil Computer Power Cable Assemblies Market Opportunity Assessment, By Applications, 2022 & 2032F |
10 Brazil Computer Power Cable Assemblies Market - Competitive Landscape |
10.1 Brazil Computer Power Cable Assemblies Market Revenue Share, By Companies, 2025 |
10.2 Brazil Computer Power Cable Assemblies Market Competitive Benchmarking, By Operating and Technical Parameters |
11 Company Profiles |
12 Recommendations |
13 Disclaimer |
Global Go To Market Strategy - 2030
Export potential enables firms to identify high-growth global markets with greater confidence by combining advanced trade intelligence with a structured quantitative methodology. The framework analyzes emerging demand trends and country-level import patterns while integrating macroeconomic and trade datasets such as GDP and population forecasts, bilateral import–export flows, tariff structures, elasticity differentials between developed and developing economies, geographic distance, and import demand projections. Using weighted trade values from 2020–2024 as the base period to project country-to-country export potential for 2030, these inputs are operationalized through calculated drivers such as gravity model parameters, tariff impact factors, and projected GDP per-capita growth. Through an analysis of hidden potentials, demand hotspots, and market conditions that are most favorable to success, this method enables firms to focus on target countries, maximize returns, and global expansion with data, backed by accuracy.
By factoring in the projected importer demand gap that is currently unmet and could be potential opportunity, it identifies the potential for the Exporter (Country) among 190 countries, against the general trade analysis, which identifies the biggest importer or exporter.
To discover high-growth global markets and optimize your business strategy:
Click Here
Pricing
- Single User License$ 1,995
- Department License$ 2,400
- Site License$ 3,120
- Global License$ 3,795

Leadership Perspectives from Industry Events
Search
Thought Leadership and Analyst Meet


Our Clients
6WResearch In News
- Doha a strategic location for EV manufacturing hub: IPA Qatar
- Demand for luxury TVs surging in the GCC, says Samsung
- Empowering Growth: The Thriving Journey of Bangladesh’s Cable Industry
- Demand for luxury TVs surging in the GCC, says Samsung
- Video call with a traditional healer? Once unthinkable, it’s now common in South Africa
- Intelligent Buildings To Smooth GCC’s Path To Net Zero
Latest Reports
- Cape Verde Portable Hand-Thrown Extinguisher Market (2026-2032)
- Canada Portable Hand-Thrown Extinguisher Market (2026-2032)
- Cameroon Portable Hand-Thrown Extinguisher Market (2026-2032)
- Burundi Portable Hand-Thrown Extinguisher Market (2026-2032)
- Burkina Faso Portable Hand-Thrown Extinguisher Market (2026-2032)
- Bulgaria Portable Hand-Thrown Extinguisher Market (2026-2032)
- Brunei Portable Hand-Thrown Extinguisher Market (2026-2032)
- Botswana Portable Hand-Thrown Extinguisher Market (2026-2032)
- Bosnia and Herzegovina Portable Hand-Thrown Extinguisher Market (2026-2032)
- Bolivia Portable Hand-Thrown Extinguisher Market (2026-2032)
Industry Events and Analyst Meet

HIMTEX 2026

India Refining Summit 2026

India EV Show 2026

EV tech India Expo 2026

Auto Tech Asia 2026
Whitepaper
- Middle East & Africa Commercial Security Market Click here to view more.
- Middle East & Africa Fire Safety Systems & Equipment Market Click here to view more.
- GCC Drone Market Click here to view more.
- Middle East Lighting Fixture Market Click here to view more.
- GCC Physical & Perimeter Security Market Click here to view more.