Mexico Computer Power Cable Assemblies Market (2026-2032) | Companies, Value, Analysis, Share, Revenue, Trends, Outlook, Industry, Forecast, Growth & Size
Market Forecast By Types (4-Pin Molex, 20-Pin ATX, 26-Pin MDR, 26-Pin SDR), By Applications (PC, Laptop, Super Computer, Others) And Competitive Landscape
| Product Code: ETC032423 | Publication Date: Oct 2020 | Updated Date: Jun 2026 | Product Type: Report | |
| Publisher: 6Wresearch | Author: Ravi Bhandari | No. of Pages: 70 | No. of Figures: 35 | No. of Tables: 5 |
Mexico Computer Power Cable Assemblies Market Summary
The mexico computer power cable assemblies market was estimated at USD 169 Million in 2025 and is projected to reach USD 195 Million by 2032, growing at a CAGR of 1.3% from 2026 to 2032.
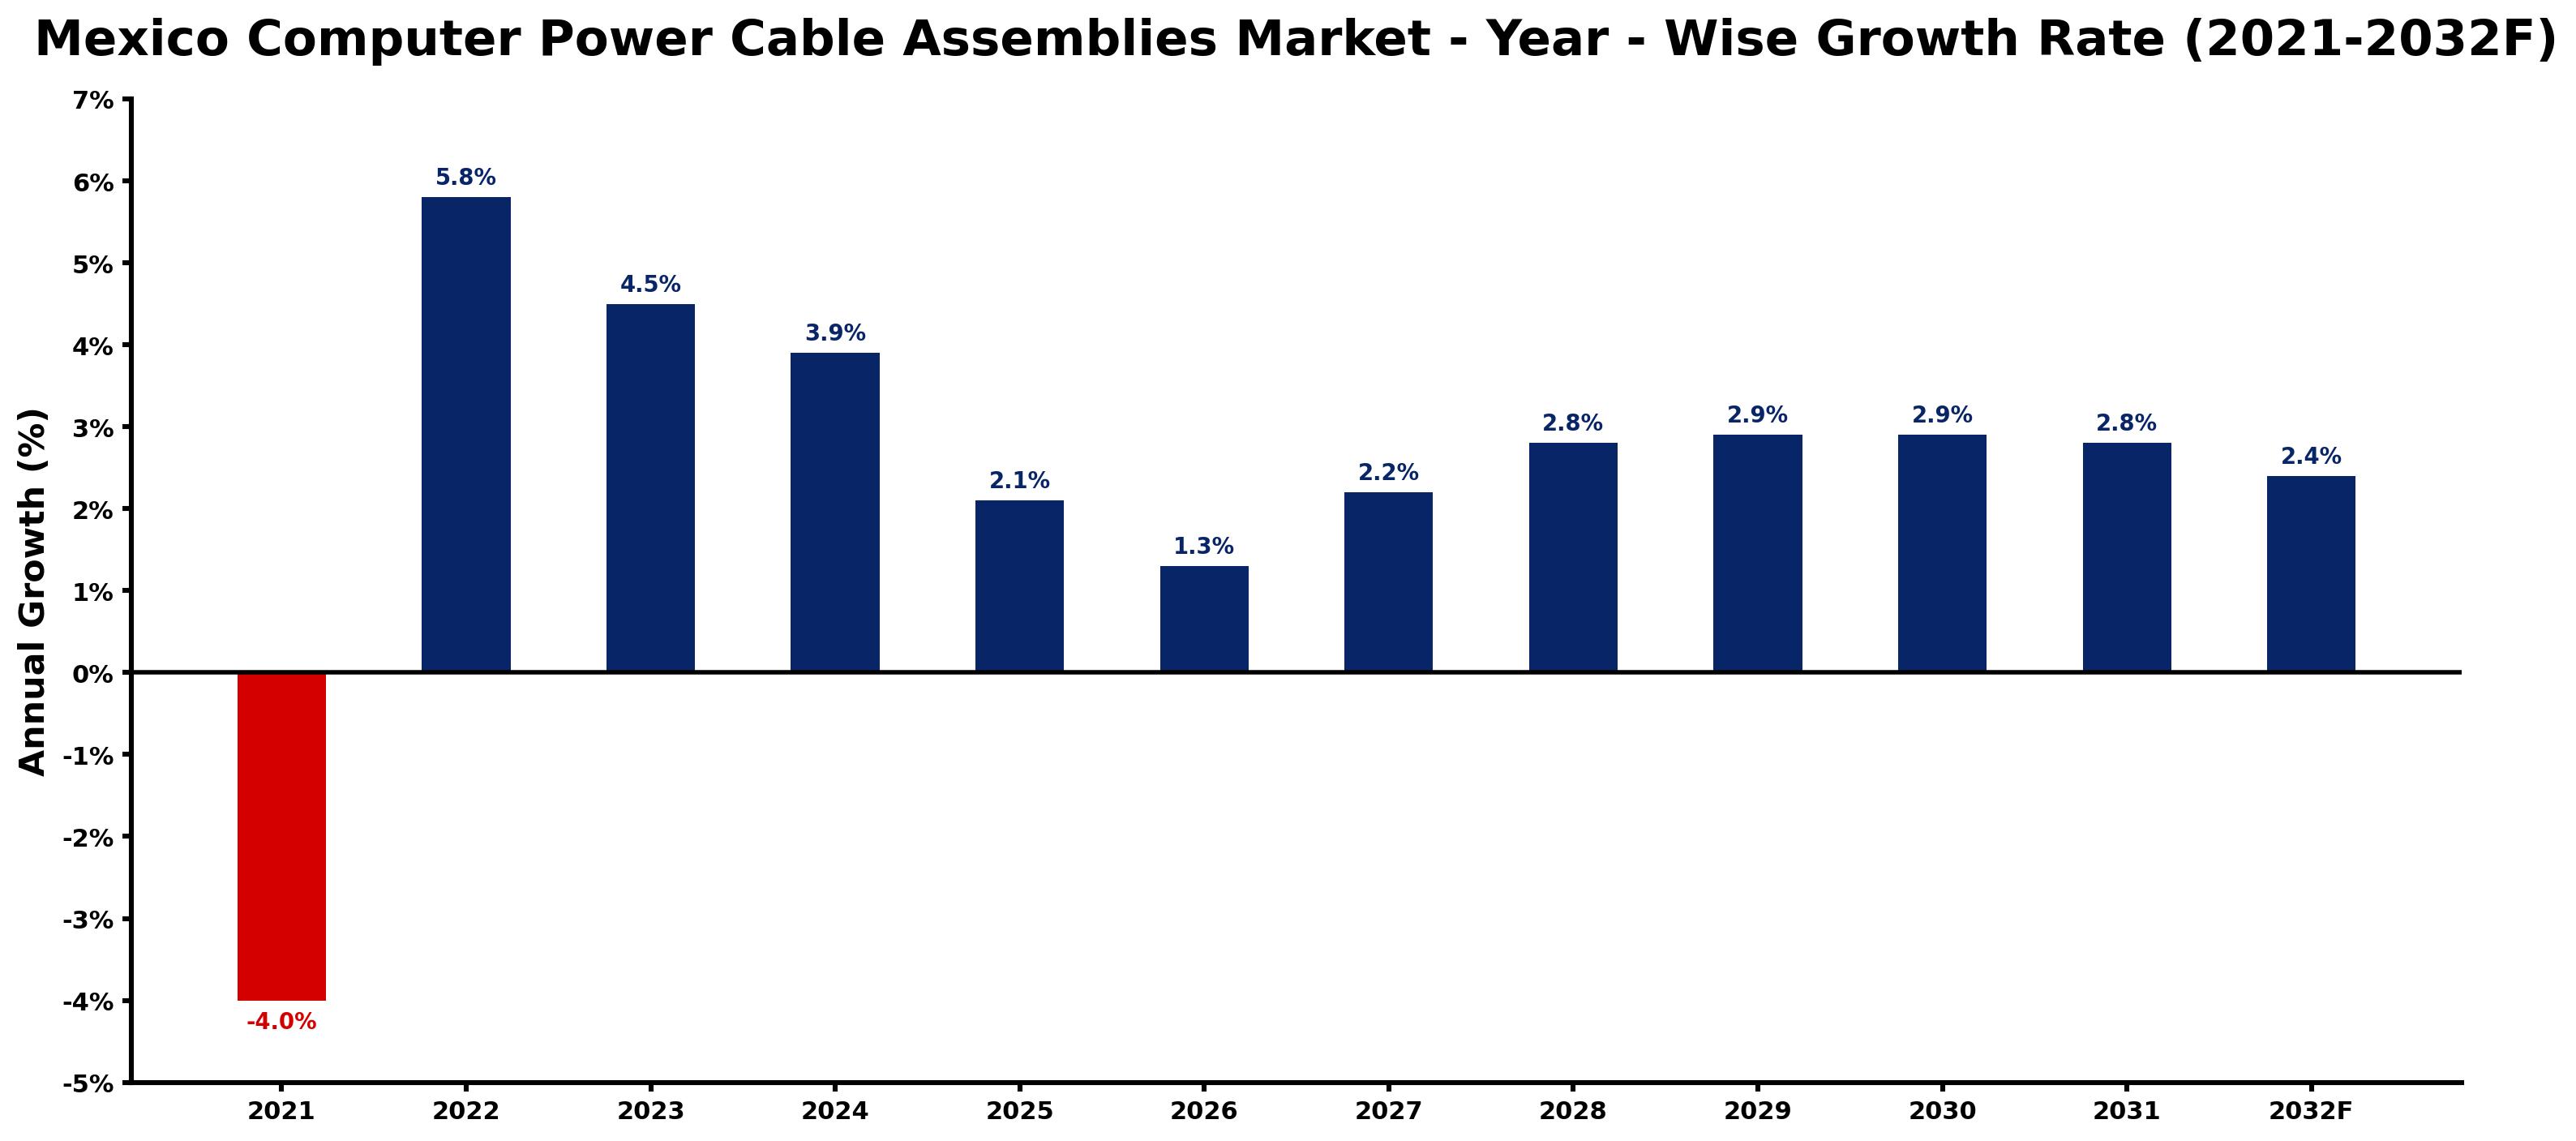
Mexico Computer Power Cable Assemblies Market Growth Rate Analysis (2021-2032)
The Mexico Computer Power Cable Assemblies market experienced a notable rebound after a challenging decline of 4.0% in 2021. This was followed by robust growth of 5.8% in 2022, driven by increasing investments in digital infrastructure and the expansion of the electronics sector. The market maintained a healthy pace with a growth rate of 4.5% in 2023 as consumer demand surged for reliable power solutions amidst ongoing energy transition initiatives. Although growth is projected to gradually slow down, stabilizing around 2.1% to 2.9% through 2032, the underlying advancements in technology and policy support for renewable energy systems continue to bolster market confidence and facilitate opportunities for growth in the evolving landscape.
Mexico Computer Power Cable Assemblies Market Year-wise Growth Rate and Key Drivers
This graph highlights how the Mexico Computer Power Cable Assemblies Market has steadily grown over the past five years, supported by major growth factors.
The table below presents the year wise growth rates along with the key drivers influencing the market
| Year | Growth Rate | Major Drivers |
| 2021 | -4.0% | Supply chain disruptions caused by pandemicrelated restrictions hindered production and delayed project completions in the sector. |
| 2022 | 5.8% | Technological upgrades in manufacturing processes highlighted the need for reliable power solutions. |
| 2023 | 4.5% | Increasing investments in renewable energy sources necessitated high-quality cable assemblies for efficiency. |
| 2024 | 3.9% | Emerging tech hubs in cities prompted a demand for advanced electrical infrastructure. |
| 2025 | 2.1% | Legacy copper grid failures underscored the urgency of modern cable assembly solutions. |
| 2026 | 1.3% | Automotive industry electrification emphasized the need for robust computer power cable assemblies. |
| 2027 | 2.2% | Growth in e-commerce expanded distribution centers, requiring extensive electrical upgrades. |
| 2028 | 2.8% | Urbanization trends led to heightened investments in smart city electrical frameworks. |
| 2029 | 2.9% | Manufacturing relocation to Mexico catalyzed demand for increased electrical assembly capacity. |
| 2030 | 2.9% | Telecommunications expansion spurred investment in high-performance power cable infrastructures. |
| 2031 | 2.8% | Local companies began prioritizing eco-friendly materials in cable assembly production processes. |
| 2032 | 2.4% | Competitive pressures in tech sectors drove innovation in power distribution technologies. |
Note - Market size estimations and growth projections presented in this report are based on 6Wresearch's advanced forecasting approach, validated with industry datasets as of June 2026.
Mexico Computer Power Cable Assemblies Market Synopsis
The Mexico Computer Power Cable Assemblies Market is projected to reach 1.3% and witness significant growth during the forecast period (2026-2032). This dynamic market is primarily driven by the increasing demand for high-quality power connectivity solutions in the IT and electronics sectors. As the proliferation of computers and electronic devices continues unabated, the need for reliable power cable assemblies has become essential to support their operations.
Mexico Computer Power Cable Assemblies Market Growth Drivers
The growth of the Mexico Computer Power Cable Assemblies Market is significantly influenced by several pivotal factors:
- Advancements in Technology: Continuous innovation in the IT and electronics industries drives the demand for computer power cable assemblies that meet modern performance standards.
- Increased Production of Electronic Devices: A rise in the manufacturing of computers and consumer electronics spurs the need for dependable power distribution systems.
- Compact Design Requirements: The trend towards smaller, high-performance computing solutions necessitates the development of specialized and efficient cable assemblies to optimize space utilization.
- Elevated Safety Standards: Compliance with stringent safety regulations influences manufacturers to enhance the quality and reliability of power cable assemblies.
- Market Expansion: The need to cater to both local and global markets compels manufacturers to innovate and adapt their offerings to meet diverse customer needs.
Mexico Computer Power Cable Assemblies Market Challenges and Restraints
Despite the promising growth trajectory of the Mexico Computer Power Cable Assemblies Market, several challenges persist:
- Technological Adaptation: Rapid advancements in computer hardware and connectivity standards present challenges for manufacturers aiming to produce compatible power cable assemblies.
- Cost Pressures: Fluctuations in raw material prices can impact production costs, affecting profit margins for manufacturers.
- Regulatory Compliance: Adhering to evolving international safety and performance standards can increase operational complexities for local manufacturers.
- Supply Chain Disruptions: Global supply chain issues can hinder the availability of essential components and materials, impacting overall production timelines.
- Market Competition: The entry of global players into the Mexican market intensifies competition, necessitating continuous innovation and differentiation.
Mexico Computer Power Cable Assemblies Market Government Investment and Initiatives
The Mexico Computer Power Cable Assemblies Market benefits from supportive government policies aimed at promoting technological advancements and maintaining competitiveness in manufacturing. Key initiatives include:
- Investment in R&D: The government encourages research and development in the electronics sector, facilitating innovations in computer power cable assembly manufacturing.
- Public-Private Partnerships: Collaborations between government entities and private manufacturers are encouraged to drive market growth and share resources effectively.
- Subsidies and Incentives: Financial incentives are offered to companies that adhere to international standards in product manufacture, promoting higher safety and performance levels.
- Trade Agreements: Mexico's participation in various trade agreements provides local manufacturers with access to broader markets, enhancing export opportunities.
- Educational Programs: The government supports technical education initiatives to develop a skilled workforce adept at meeting the evolving demands of the electronics industry.
Mexico Computer Power Cable Assemblies Market Latest Developments (May 2025 - June 2026)
The period from May 2025 to June 2026 has witnessed several noteworthy developments within the Mexico Computer Power Cable Assemblies Market:
- Emerging Technologies: Adoption of advanced manufacturing processes, such as automation and IoT integration, has begun to reshape production methodologies.
- Focus on Sustainability: Manufacturers are increasingly prioritizing eco-friendly materials and processes, responding to the growing demand for sustainable products.
- Increased Export Activity: There has been a notable uptick in exports of power cable assemblies, spurred by the favorable trade conditions and international demand.
- Consumer Electronics Growth: A surge in the consumer electronics market is amplifying the need for power cable assemblies, particularly in mobile and portable devices.
- Collaborative Innovations: Partnerships between technology firms and manufacturers are leading to the development of cutting-edge cable solutions tailored for new computing technologies.
Mexico Computer Power Cable Assemblies Market - Key Attractiveness of the Report
- 10 Years of Market Numbers
- Historical Data Starting from 2022 to 2025
- Base Year: 2025
- Forecast Data until 2032
- Key Performance Indicators Impacting the Market
- Major Upcoming Developments and Projects
Key Highlights of the Report:
- Mexico Computer Power Cable Assemblies Market Outlook
- Market Size of Mexico Computer Power Cable Assemblies Market, 2025
- Forecast of Mexico Computer Power Cable Assemblies Market, 2032
- Historical Data and Forecast of Mexico Computer Power Cable Assemblies Revenues & Volume for the Period 2022-2032F
- Mexico Computer Power Cable Assemblies Market Trend Evolution
- Mexico Computer Power Cable Assemblies Market Drivers and Challenges
- Mexico Computer Power Cable Assemblies Price Trends
- Mexico Computer Power Cable Assemblies Porter's Five Forces
- Mexico Computer Power Cable Assemblies Industry Life Cycle
- Historical Data and Forecast of Mexico Computer Power Cable Assemblies Market Revenues & Volume By Types for the Period 2022-2032F
- Historical Data and Forecast of Mexico Computer Power Cable Assemblies Market Revenues & Volume By 4-Pin Molex for the Period 2022-2032F
- Historical Data and Forecast of Mexico Computer Power Cable Assemblies Market Revenues & Volume By 20-Pin ATX for the Period 2022-2032F
- Historical Data and Forecast of Mexico Computer Power Cable Assemblies Market Revenues & Volume By 26-Pin MDR for the Period 2022-2032F
- Historical Data and Forecast of Mexico Computer Power Cable Assemblies Market Revenues & Volume By 26-Pin SDR for the Period 2022-2032F
- Historical Data and Forecast of Mexico Computer Power Cable Assemblies Market Revenues & Volume By Applications for the Period 2022-2032F
- Historical Data and Forecast of Mexico Computer Power Cable Assemblies Market Revenues & Volume By PC for the Period 2022-2032F
- Historical Data and Forecast of Mexico Computer Power Cable Assemblies Market Revenues & Volume By Laptop for the Period 2022-2032F
- Historical Data and Forecast of Mexico Computer Power Cable Assemblies Market Revenues & Volume By Super Computer for the Period 2022-2032F
- Historical Data and Forecast of Mexico Computer Power Cable Assemblies Market Revenues & Volume By Others for the Period 2022-2032F
- Mexico Computer Power Cable Assemblies Import Export Trade Statistics
- Market Opportunity Assessment By Types
- Market Opportunity Assessment By Applications
- Mexico Computer Power Cable Assemblies Top Companies Market Share
- Mexico Computer Power Cable Assemblies Competitive Benchmarking By Technical and Operational Parameters
- Mexico Computer Power Cable Assemblies Company Profiles
- Mexico Computer Power Cable Assemblies Key Strategic Recommendations
Frequently Asked Questions About the Market Study (FAQs):
The growth is primarily driven by advancements in technology, increased production of electronic devices, and the demand for compact and high-performance solutions.
Manufacturers face challenges such as rapid technological changes, cost pressures from raw material fluctuations, and the need for regulatory compliance.
The government supports the electronics sector through investments in R&D, public-private partnerships, and educational programs to foster a skilled workforce.
Recent trends include a focus on sustainability, the adoption of automation in manufacturing, and collaborative innovations between tech firms and manufacturers.
6Wresearch actively monitors the Mexico Computer Power Cable Assemblies Market and publishes its comprehensive annual report, highlighting emerging trends, growth drivers, revenue analysis, and forecast outlook. Our insights help businesses to make data-backed strategic decisions with ongoing market dynamics. Our analysts track relevent industries related to the Mexico Computer Power Cable Assemblies Market, allowing our clients with actionable intelligence and reliable forecasts tailored to emerging regional needs.
Yes, we provide customisation as per your requirements. To learn more, feel free to contact us on sales@6wresearch.com
1 Executive Summary |
2 Introduction |
2.1 Key Highlights of the Report |
2.2 Report Description |
2.3 Market Scope & Segmentation |
2.4 Research Methodology |
2.5 Assumptions |
3 Mexico Computer Power Cable Assemblies Market Overview |
3.1 Mexico Country Macro Economic Indicators |
3.2 Mexico Computer Power Cable Assemblies Market Revenues & Volume, 2022 & 2032F |
3.3 Mexico Computer Power Cable Assemblies Market - Industry Life Cycle |
3.4 Mexico Computer Power Cable Assemblies Market - Porter's Five Forces |
3.5 Mexico Computer Power Cable Assemblies Market Revenues & Volume Share, By Types, 2022 & 2032F |
3.6 Mexico Computer Power Cable Assemblies Market Revenues & Volume Share, By Applications, 2022 & 2032F |
4 Mexico Computer Power Cable Assemblies Market Dynamics |
4.1 Impact Analysis |
4.2 Market Drivers |
4.2.1 Increasing demand for computers and electronic devices in Mexico |
4.2.2 Growing emphasis on energy efficiency and sustainability |
4.2.3 Technological advancements leading to higher adoption of computer power cable assemblies |
4.3 Market Restraints |
4.3.1 Fluctuating raw material prices impacting production costs |
4.3.2 Intense competition among manufacturers affecting pricing strategies |
5 Mexico Computer Power Cable Assemblies Market Trends |
6 Mexico Computer Power Cable Assemblies Market, By Types |
6.1 Mexico Computer Power Cable Assemblies Market, By Types |
6.1.1 Overview and Analysis |
6.1.2 Mexico Computer Power Cable Assemblies Market Revenues & Volume, By Types, 2022-2032F |
6.1.3 Mexico Computer Power Cable Assemblies Market Revenues & Volume, By 4-Pin Molex, 2022-2032F |
6.1.4 Mexico Computer Power Cable Assemblies Market Revenues & Volume, By 20-Pin ATX, 2022-2032F |
6.1.5 Mexico Computer Power Cable Assemblies Market Revenues & Volume, By 26-Pin MDR, 2022-2032F |
6.1.6 Mexico Computer Power Cable Assemblies Market Revenues & Volume, By 26-Pin SDR, 2022-2032F |
6.2 Mexico Computer Power Cable Assemblies Market, By Applications |
6.2.1 Overview and Analysis |
6.2.2 Mexico Computer Power Cable Assemblies Market Revenues & Volume, By PC, 2022-2032F |
6.2.3 Mexico Computer Power Cable Assemblies Market Revenues & Volume, By Laptop, 2022-2032F |
6.2.4 Mexico Computer Power Cable Assemblies Market Revenues & Volume, By Super Computer, 2022-2032F |
6.2.5 Mexico Computer Power Cable Assemblies Market Revenues & Volume, By Others, 2022-2032F |
7 Mexico Computer Power Cable Assemblies Market Import-Export Trade Statistics |
7.1 Mexico Computer Power Cable Assemblies Market Export to Major Countries |
7.2 Mexico Computer Power Cable Assemblies Market Imports from Major Countries |
8 Mexico Computer Power Cable Assemblies Market Key Performance Indicators |
8.1 Percentage growth in the number of electronic devices sold in Mexico |
8.2 Energy efficiency ratings of computer power cable assemblies |
8.3 Adoption rate of advanced technologies in computer power cable assemblies production |
9 Mexico Computer Power Cable Assemblies Market - Opportunity Assessment |
9.1 Mexico Computer Power Cable Assemblies Market Opportunity Assessment, By Types, 2022 & 2032F |
9.2 Mexico Computer Power Cable Assemblies Market Opportunity Assessment, By Applications, 2022 & 2032F |
10 Mexico Computer Power Cable Assemblies Market - Competitive Landscape |
10.1 Mexico Computer Power Cable Assemblies Market Revenue Share, By Companies, 2025 |
10.2 Mexico Computer Power Cable Assemblies Market Competitive Benchmarking, By Operating and Technical Parameters |
11 Company Profiles |
12 Recommendations |
13 Disclaimer |
Global Go To Market Strategy - 2030
Export potential enables firms to identify high-growth global markets with greater confidence by combining advanced trade intelligence with a structured quantitative methodology. The framework analyzes emerging demand trends and country-level import patterns while integrating macroeconomic and trade datasets such as GDP and population forecasts, bilateral import–export flows, tariff structures, elasticity differentials between developed and developing economies, geographic distance, and import demand projections. Using weighted trade values from 2020–2024 as the base period to project country-to-country export potential for 2030, these inputs are operationalized through calculated drivers such as gravity model parameters, tariff impact factors, and projected GDP per-capita growth. Through an analysis of hidden potentials, demand hotspots, and market conditions that are most favorable to success, this method enables firms to focus on target countries, maximize returns, and global expansion with data, backed by accuracy.
By factoring in the projected importer demand gap that is currently unmet and could be potential opportunity, it identifies the potential for the Exporter (Country) among 190 countries, against the general trade analysis, which identifies the biggest importer or exporter.
To discover high-growth global markets and optimize your business strategy:
Click Here
Pricing
- Single User License$ 1,995
- Department License$ 2,400
- Site License$ 3,120
- Global License$ 3,795

Leadership Perspectives from Industry Events
Search
Thought Leadership and Analyst Meet


Our Clients
6WResearch In News
- Doha a strategic location for EV manufacturing hub: IPA Qatar
- Demand for luxury TVs surging in the GCC, says Samsung
- Empowering Growth: The Thriving Journey of Bangladesh’s Cable Industry
- Demand for luxury TVs surging in the GCC, says Samsung
- Video call with a traditional healer? Once unthinkable, it’s now common in South Africa
- Intelligent Buildings To Smooth GCC’s Path To Net Zero
Latest Reports
- Cape Verde Portable Hand-Thrown Extinguisher Market (2026-2032)
- Canada Portable Hand-Thrown Extinguisher Market (2026-2032)
- Cameroon Portable Hand-Thrown Extinguisher Market (2026-2032)
- Burundi Portable Hand-Thrown Extinguisher Market (2026-2032)
- Burkina Faso Portable Hand-Thrown Extinguisher Market (2026-2032)
- Bulgaria Portable Hand-Thrown Extinguisher Market (2026-2032)
- Brunei Portable Hand-Thrown Extinguisher Market (2026-2032)
- Botswana Portable Hand-Thrown Extinguisher Market (2026-2032)
- Bosnia and Herzegovina Portable Hand-Thrown Extinguisher Market (2026-2032)
- Bolivia Portable Hand-Thrown Extinguisher Market (2026-2032)
Industry Events and Analyst Meet

HIMTEX 2026

India Refining Summit 2026

India EV Show 2026

EV tech India Expo 2026

Auto Tech Asia 2026
Whitepaper
- Middle East & Africa Commercial Security Market Click here to view more.
- Middle East & Africa Fire Safety Systems & Equipment Market Click here to view more.
- GCC Drone Market Click here to view more.
- Middle East Lighting Fixture Market Click here to view more.
- GCC Physical & Perimeter Security Market Click here to view more.