Chile Transport Packaging Market (2026-2032) | Analysis, Outlook, Forecast, Value, Industry, Revenue, Trends, Companies, Growth, Share & Size
Market Forecast By Material Type (Plastic, Polyethylene (PE), Polypropylene (PP), Polyethylene Terephthalate (PET), Paper & Paperboard, Metal, Wood, Others), By Packaging Types (Cartons, Wooden crates, Containers, Corrugated boxes, Barrels, IBCs, Strapping, Others), By End-users (Agriculture, Automotive, Building & Construction, Chemicals & Pharmaceuticals, Food & Beverages, Metallurgical, Electrical & Electronics, Others) And Competitive Landscape
| Product Code: ETC006628 | Publication Date: Sep 2020 | Updated Date: Jun 2026 | Product Type: Report | |
| Publisher: 6Wresearch | Author: Ravi Bhandari | No. of Pages: 70 | No. of Figures: 35 | No. of Tables: 5 |
Chile Transport Packaging Market Summary
The chile transport packaging market was estimated at USD 489 Million in 2025 and is projected to reach USD 692 Million by 2032, growing at a CAGR of 5.7% from 2026 to 2032.
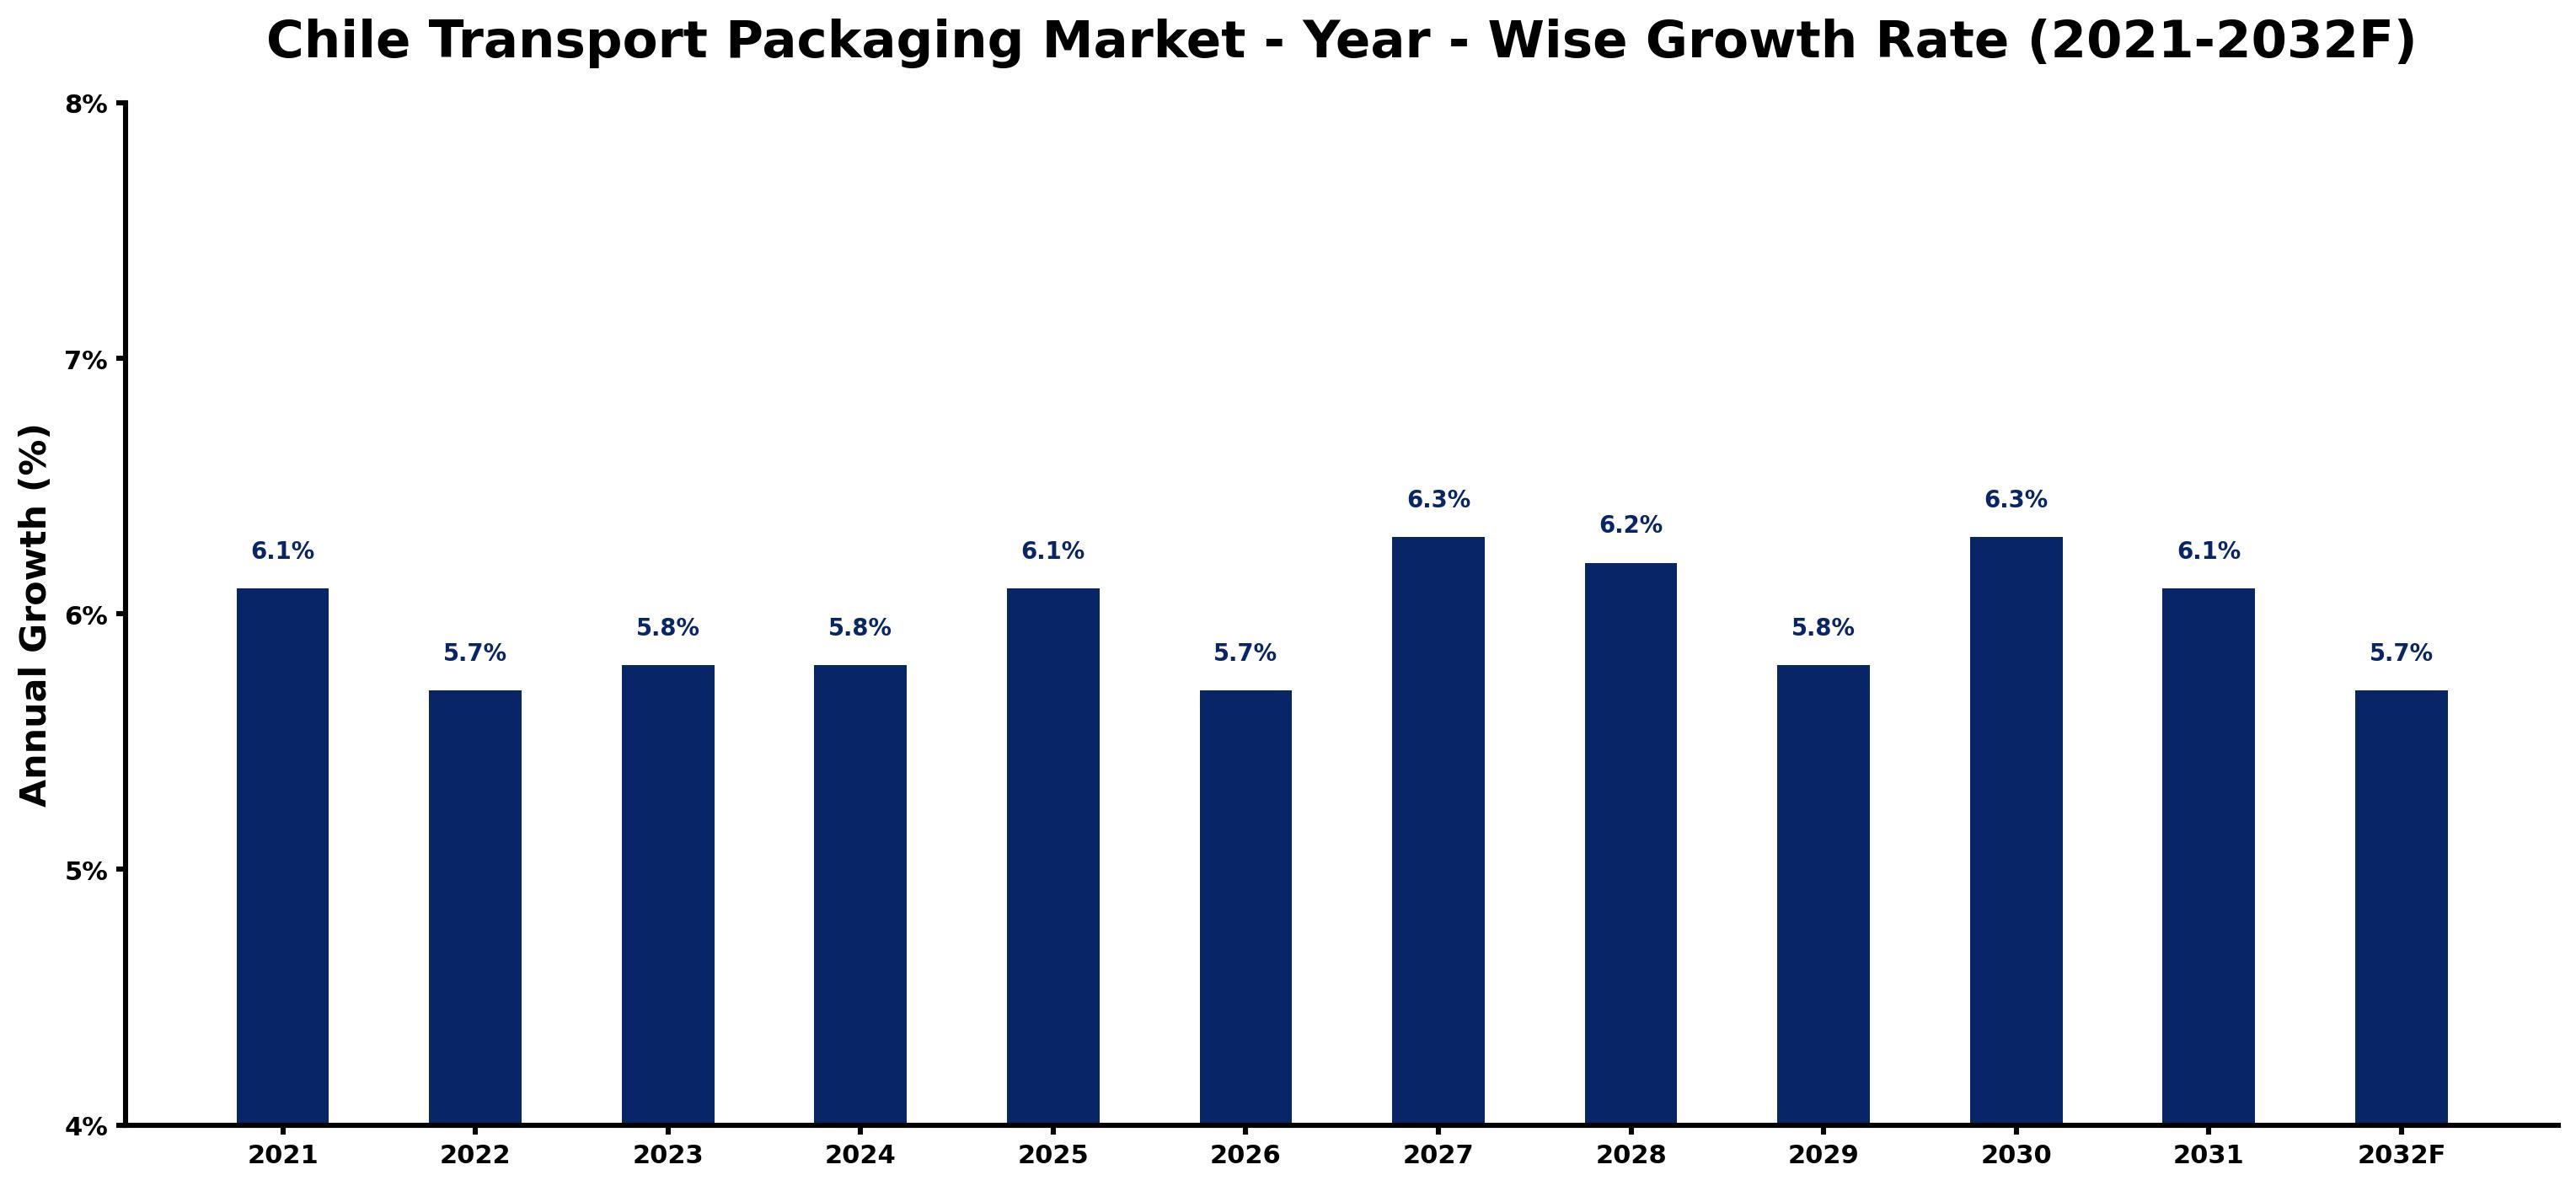
Chile Transport Packaging Market Growth Rate Analysis (2021-2032)
The Chile transport packaging market has exhibited stable growth, with yearly increases recorded at 6.1% in 2021, gradually tapering to 5.7% in 2022. This fluctuation can largely be attributed to the adaptation to evolving consumer demand and the influence of digitalization within supply chains. The market rebounded to a steady 5.8% growth in both 2023 and 2024, driven by investments in infrastructure and advancements in eco-friendly packaging solutions. Notably, a peak growth of 6.3% is anticipated in 2027 as companies align their strategies with emerging sustainable practices and adapt to energy transition policies. The overall trajectory suggests that the sector will continue to benefit from a combination of technological advancements and increasing investment in innovative packaging materials.
Chile Transport Packaging Market Year-wise Growth Rate and Key Drivers
This graph highlights how the Chile Transport Packaging Market has steadily grown over the past five years, supported by major growth factors.
The table below presents the year wise growth rates along with the key drivers influencing the market
| Year | Growth Rate | Major Drivers |
| 2021 | 6.1% | Emerging e-commerce platforms prompted a shift towards efficient transport packaging solutions. |
| 2022 | 5.7% | Increased focus on sustainability led to demand for biodegradable packaging materials. |
| 2023 | 5.8% | The logistics sector expanded significantly, enhancing packaging requirements across industries. |
| 2024 | 5.8% | Local manufacturers began investing in advanced technology for packaging production. |
| 2025 | 6.1% | Consumer preferences shifted towards customized packaging options for retail products. |
| 2026 | 5.7% | A substantial rise in exports demanded improved packaging standards and compliance. |
| 2027 | 6.3% | Urbanization trends intensified, necessitating innovative packaging solutions for city logistics. |
| 2028 | 6.2% | Supply chain disruptions highlighted the importance of durable and reliable packaging. |
| 2029 | 5.8% | Digital transformation in logistics encouraged smart packaging technologies and tracking. |
| 2030 | 6.3% | Circular economy practices gained traction, influencing packaging materials and design. |
| 2031 | 6.1% | Collaborations among businesses spurred innovations in transport packaging strategies. |
| 2032 | 5.7% | Competitive pressures drove continuous improvements in packaging efficiency and sustainability. |
Note - Market size estimations and growth projections presented in this report are based on 6Wresearch's advanced forecasting approach, validated with industry datasets as of June 2026.
Chile Transport Packaging Market Synopsis
The Chile Transport Packaging Market is projected to reach 5.7% and witness significant growth during the forecast period (2026-2032). Transport packaging serves a critical role in safeguarding goods throughout their journey in the supply chain, particularly in sectors like logistics, e-commerce, and manufacturing. These solutions are essential for maintaining product integrity and reducing losses during transit, which is increasingly vital as Chile's economy expands its reach into international markets.
Chile Transport Packaging Market Growth Drivers
The demand for transport packaging solutions in Chile is driven by several pivotal factors:
- The exponential growth of the e-commerce sector requires robust packaging solutions that can ensure products arrive undamaged.
- As logistics become more complex, companies are seeking packaging materials that enhance efficiency and minimize shipping costs.
- Existing and developing manufacturing sectors are expanding, creating a surge in need for effective transport solutions to support both domestic and export operations.
- Technological advancements in packaging materials offer innovative solutions that meet the protective and sustainability needs of manufacturers and retailers.
- The increasing consumer emphasis on product quality and unboxing experience fuels demand for aesthetically pleasing yet functional transport packaging.
Chile Transport Packaging Market Challenges and Restraints
Despite its growth, the Chile Transport Packaging Market faces notable challenges:
- Manufacturers are under pressure to develop sustainable packaging materials that address environmental concerns, which can complicate production processes.
- Supply chain efficiency remains a key hurdle, as businesses must balance cost-effectiveness with the need for high-quality packaging that minimizes damage.
- Fluctuations in raw material costs can impact profitability and lead to increased prices for end consumers, affecting overall market demand.
- Regulatory compliance regarding packaging materials and waste management is becoming increasingly stringent, necessitating adjustments in production methods.
- Consumer awareness regarding packaging waste continues to rise, prompting companies to adapt or risk losing market share to more environmentally friendly alternatives.
Chile Transport Packaging Market Government Investment and Initiatives
The Chilean government plays a pivotal role in shaping the transport packaging market through various investments and initiatives:
- Government policies focus on sustainable packaging solutions, encouraging businesses to adopt practices that reduce environmental impact.
- Public funding initiatives support research and development in innovative packaging technologies that enhance durability and recyclability.
- Regulatory frameworks are being established to standardize packaging materials, ensuring they meet durability and protection criteria for different goods.
- Incentives are provided for businesses that invest in sustainable practices, promoting a circular economy within the transport packaging sector.
- Collaborative projects may be initiated between government bodies and industry stakeholders to optimize supply chain operations and address packaging waste effectively.
Chile Transport Packaging Market Latest Developments (May 2025 - June 2026)
Over the period between May 2025 and June 2026, the Chile Transport Packaging Market has experienced significant shifts in focus:
- There has been an increased emphasis on sustainable packaging materials, with more companies launching eco-friendly options in response to consumer demand.
- Technological advancements such as automation in packaging processes are becoming more prevalent, enhancing efficiency and reducing labor costs.
- Partnerships between logistics providers and packaging manufacturers have strengthened, allowing for integrated solutions that optimize both packaging design and transport logistics.
- Government-led initiatives aimed at reducing packaging waste have prompted many businesses to reassess and innovate their packaging strategies.
- Trade agreements within the region have facilitated smoother cross-border movements, necessitating packaging solutions that adhere to varying international standards.
Chile Transport Packaging Market - Key Attractiveness of the Report
- 10 Years of Market Numbers
- Historical Data Starting from 2022 to 2025
- Base Year: 2025
- Forecast Data until 2032
- Key Performance Indicators Impacting the Market
- Major Upcoming Developments and Projects
Key Highlights of the Report:
- Chile Transport Packaging Market Outlook
- Market Size of Chile Transport Packaging Market, 2025
- Forecast of Chile Transport Packaging Market, 2032
- Historical Data and Forecast of Chile Transport Packaging Revenues & Volume for the Period 2022-2032F
- Chile Transport Packaging Market Trend Evolution
- Chile Transport Packaging Market Drivers and Challenges
- Chile Transport Packaging Price Trends
- Chile Transport Packaging Porter's Five Forces
- Chile Transport Packaging Industry Life Cycle
- Historical Data and Forecast of Chile Transport Packaging Market Revenues & Volume By Material Type for the Period 2022-2032F
- Historical Data and Forecast of Chile Transport Packaging Market Revenues & Volume By Plastic for the Period 2022-2032F
- Historical Data and Forecast of Chile Transport Packaging Market Revenues & Volume By Polyethylene (PE) for the Period 2022-2032F
- Historical Data and Forecast of Chile Transport Packaging Market Revenues & Volume By Polypropylene (PP) for the Period 2022-2032F
- Historical Data and Forecast of Chile Transport Packaging Market Revenues & Volume By Polyethylene Terephthalate (PET) for the Period 2022-2032F
- Historical Data and Forecast of Chile Transport Packaging Market Revenues & Volume By Paper & Paperboard for the Period 2022-2032F
- Historical Data and Forecast of Chile Transport Packaging Market Revenues & Volume By Metal for the Period 2022-2032F
- Historical Data and Forecast of Chile Transport Packaging Market Revenues & Volume By Wood for the Period 2022-2032F
- Historical Data and Forecast of Chile Plastic Transport Packaging Market Revenues & Volume By Others for the Period 2022-2032F
- Historical Data and Forecast of Chile Transport Packaging Market Revenues & Volume By Packaging Types for the Period 2022-2032F
- Historical Data and Forecast of Chile Transport Packaging Market Revenues & Volume By Cartons for the Period 2022-2032F
- Historical Data and Forecast of Chile Transport Packaging Market Revenues & Volume By Wooden crates for the Period 2022-2032F
- Historical Data and Forecast of Chile Transport Packaging Market Revenues & Volume By Containers for the Period 2022-2032F
- Historical Data and Forecast of Chile Transport Packaging Market Revenues & Volume By Corrugated boxes for the Period 2022-2032F
- Historical Data and Forecast of Chile Transport Packaging Market Revenues & Volume By Barrels for the Period 2022-2032F
- Historical Data and Forecast of Chile Transport Packaging Market Revenues & Volume By IBCs for the Period 2022-2032F
- Historical Data and Forecast of Chile Transport Packaging Market Revenues & Volume By Strapping for the Period 2022-2032F
- Historical Data and Forecast of Chile Transport Packaging Market Revenues & Volume By Others for the Period 2022-2032F
- Historical Data and Forecast of Chile Transport Packaging Market Revenues & Volume By End-users for the Period 2022-2032F
- Historical Data and Forecast of Chile Transport Packaging Market Revenues & Volume By Agriculture for the Period 2022-2032F
- Historical Data and Forecast of Chile Transport Packaging Market Revenues & Volume By Automotive for the Period 2022-2032F
- Historical Data and Forecast of Chile Transport Packaging Market Revenues & Volume By Building & Construction for the Period 2022-2032F
- Historical Data and Forecast of Chile Transport Packaging Market Revenues & Volume By Chemicals & Pharmaceuticals for the Period 2022-2032F
- Historical Data and Forecast of Chile Transport Packaging Market Revenues & Volume By Food & Beverages for the Period 2022-2032F
- Historical Data and Forecast of Chile Transport Packaging Market Revenues & Volume By Metallurgical for the Period 2022-2032F
- Historical Data and Forecast of Chile Transport Packaging Market Revenues & Volume By Electrical & Electronics for the Period 2022-2032F
- Historical Data and Forecast of Chile Transport Packaging Market Revenues & Volume By Others for the Period 2022-2032F
- Chile Transport Packaging Import Export Trade Statistics
- Market Opportunity Assessment By Material Type
- Market Opportunity Assessment By Packaging Types
- Market Opportunity Assessment By End-users
- Chile Transport Packaging Top Companies Market Share
- Chile Transport Packaging Competitive Benchmarking By Technical and Operational Parameters
- Chile Transport Packaging Company Profiles
- Chile Transport Packaging Key Strategic Recommendations
Frequently Asked Questions About the Market Study (FAQs):
The primary drivers include the growth of e-commerce, advancements in logistics, and the demand for sustainable packaging solutions.
The government provides incentives for sustainable practices and invests in research for innovative packaging technologies.
Challenges include the need for sustainability, regulatory compliance, and managing supply chain efficiency amid rising costs.
Recent developments include a shift towards sustainable materials, advancements in automation, and enhanced collaboration between packaging and logistics providers.
6Wresearch actively monitors the Chile Transport Packaging Market and publishes its comprehensive annual report, highlighting emerging trends, growth drivers, revenue analysis, and forecast outlook. Our insights help businesses to make data-backed strategic decisions with ongoing market dynamics. Our analysts track relevent industries related to the Chile Transport Packaging Market, allowing our clients with actionable intelligence and reliable forecasts tailored to emerging regional needs.
Yes, we provide customisation as per your requirements. To learn more, feel free to contact us on sales@6wresearch.com
1 Executive Summary |
2 Introduction |
2.1 Key Highlights of the Report |
2.2 Report Description |
2.3 Market Scope & Segmentation |
2.4 Research Methodology |
2.5 Assumptions |
3 Chile Transport Packaging Market Overview |
3.1 Chile Country Macro Economic Indicators |
3.2 Chile Transport Packaging Market Revenues & Volume, 2022 & 2032F |
3.3 Chile Transport Packaging Market - Industry Life Cycle |
3.4 Chile Transport Packaging Market - Porter's Five Forces |
3.5 Chile Transport Packaging Market Revenues & Volume Share, By Material Type, 2022 & 2032F |
3.6 Chile Transport Packaging Market Revenues & Volume Share, By Packaging Types, 2022 & 2032F |
3.7 Chile Transport Packaging Market Revenues & Volume Share, By End-users, 2022 & 2032F |
4 Chile Transport Packaging Market Dynamics |
4.1 Impact Analysis |
4.2 Market Drivers |
4.3 Market Restraints |
5 Chile Transport Packaging Market Trends |
6 Chile Transport Packaging Market, By Types |
6.1 Chile Transport Packaging Market, By Material Type |
6.1.1 Overview and Analysis |
6.1.2 Chile Transport Packaging Market Revenues & Volume, By Material Type, 2022-2032F |
6.1.3 Chile Transport Packaging Market Revenues & Volume, By Plastic, 2022-2032F |
6.1.4 Chile Transport Packaging Market Revenues & Volume, By Polyethylene (PE), 2022-2032F |
6.1.5 Chile Transport Packaging Market Revenues & Volume, By Polypropylene (PP), 2022-2032F |
6.1.6 Chile Transport Packaging Market Revenues & Volume, By Polyethylene Terephthalate (PET), 2022-2032F |
6.1.7 Chile Transport Packaging Market Revenues & Volume, By Paper & Paperboard, 2022-2032F |
6.1.8 Chile Transport Packaging Market Revenues & Volume, By Metal, 2022-2032F |
6.1.9 Chile Transport Packaging Market Revenues & Volume, By Others, 2022-2032F |
6.1.10 Chile Transport Packaging Market Revenues & Volume, By Others, 2022-2032F |
6.2 Chile Transport Packaging Market, By Packaging Types |
6.2.1 Overview and Analysis |
6.2.2 Chile Transport Packaging Market Revenues & Volume, By Cartons, 2022-2032F |
6.2.3 Chile Transport Packaging Market Revenues & Volume, By Wooden crates, 2022-2032F |
6.2.4 Chile Transport Packaging Market Revenues & Volume, By Containers, 2022-2032F |
6.2.5 Chile Transport Packaging Market Revenues & Volume, By Corrugated boxes, 2022-2032F |
6.2.6 Chile Transport Packaging Market Revenues & Volume, By Barrels, 2022-2032F |
6.2.7 Chile Transport Packaging Market Revenues & Volume, By IBCs, 2022-2032F |
6.2.8 Chile Transport Packaging Market Revenues & Volume, By Others, 2022-2032F |
6.2.9 Chile Transport Packaging Market Revenues & Volume, By Others, 2022-2032F |
6.3 Chile Transport Packaging Market, By End-users |
6.3.1 Overview and Analysis |
6.3.2 Chile Transport Packaging Market Revenues & Volume, By Agriculture, 2022-2032F |
6.3.3 Chile Transport Packaging Market Revenues & Volume, By Automotive, 2022-2032F |
6.3.4 Chile Transport Packaging Market Revenues & Volume, By Building & Construction, 2022-2032F |
6.3.5 Chile Transport Packaging Market Revenues & Volume, By Chemicals & Pharmaceuticals, 2022-2032F |
6.3.6 Chile Transport Packaging Market Revenues & Volume, By Food & Beverages, 2022-2032F |
6.3.7 Chile Transport Packaging Market Revenues & Volume, By Metallurgical, 2022-2032F |
6.3.8 Chile Transport Packaging Market Revenues & Volume, By Others, 2022-2032F |
6.3.9 Chile Transport Packaging Market Revenues & Volume, By Others, 2022-2032F |
7 Chile Transport Packaging Market Import-Export Trade Statistics |
7.1 Chile Transport Packaging Market Export to Major Countries |
7.2 Chile Transport Packaging Market Imports from Major Countries |
8 Chile Transport Packaging Market Key Performance Indicators |
9 Chile Transport Packaging Market - Opportunity Assessment |
9.1 Chile Transport Packaging Market Opportunity Assessment, By Material Type, 2022 & 2032F |
9.2 Chile Transport Packaging Market Opportunity Assessment, By Packaging Types, 2022 & 2032F |
9.3 Chile Transport Packaging Market Opportunity Assessment, By End-users, 2022 & 2032F |
10 Chile Transport Packaging Market - Competitive Landscape |
10.1 Chile Transport Packaging Market Revenue Share, By Companies, 2025 |
10.2 Chile Transport Packaging Market Competitive Benchmarking, By Operating and Technical Parameters |
11 Company Profiles |
12 Recommendations |
13 Disclaimer |
Global Go To Market Strategy - 2030
Export potential enables firms to identify high-growth global markets with greater confidence by combining advanced trade intelligence with a structured quantitative methodology. The framework analyzes emerging demand trends and country-level import patterns while integrating macroeconomic and trade datasets such as GDP and population forecasts, bilateral import–export flows, tariff structures, elasticity differentials between developed and developing economies, geographic distance, and import demand projections. Using weighted trade values from 2020–2024 as the base period to project country-to-country export potential for 2030, these inputs are operationalized through calculated drivers such as gravity model parameters, tariff impact factors, and projected GDP per-capita growth. Through an analysis of hidden potentials, demand hotspots, and market conditions that are most favorable to success, this method enables firms to focus on target countries, maximize returns, and global expansion with data, backed by accuracy.
By factoring in the projected importer demand gap that is currently unmet and could be potential opportunity, it identifies the potential for the Exporter (Country) among 190 countries, against the general trade analysis, which identifies the biggest importer or exporter.
To discover high-growth global markets and optimize your business strategy:
Click Here
Pricing
- Single User License$ 1,995
- Department License$ 2,400
- Site License$ 3,120
- Global License$ 3,795

Leadership Perspectives from Industry Events
Search
Thought Leadership and Analyst Meet


Our Clients
6WResearch In News
- India Air Conditioner Market Set for Strong Rebound in 2026 After Weather-Led Correction and GST-Driven Recovery: 6Wresearch
- ADAS in India: How Automatic Emergency Braking, Blind Spot Detection & Driver Monitoring are Transforming Road Safety
- Doha a strategic location for EV manufacturing hub: IPA Qatar
- Demand for luxury TVs surging in the GCC, says Samsung
- Empowering Growth: The Thriving Journey of Bangladesh’s Cable Industry
- Demand for luxury TVs surging in the GCC, says Samsung
Latest Reports
- Poland Fire Protection Systems Market (2026-2032)
- Cape Verde Portable Hand-Thrown Extinguisher Market (2026-2032)
- Canada Portable Hand-Thrown Extinguisher Market (2026-2032)
- Cameroon Portable Hand-Thrown Extinguisher Market (2026-2032)
- Burundi Portable Hand-Thrown Extinguisher Market (2026-2032)
- Burkina Faso Portable Hand-Thrown Extinguisher Market (2026-2032)
- Bulgaria Portable Hand-Thrown Extinguisher Market (2026-2032)
- Brunei Portable Hand-Thrown Extinguisher Market (2026-2032)
- Botswana Portable Hand-Thrown Extinguisher Market (2026-2032)
- Bosnia and Herzegovina Portable Hand-Thrown Extinguisher Market (2026-2032)
Industry Events and Analyst Meet

HIMTEX 2026

India Refining Summit 2026

India EV Show 2026

EV tech India Expo 2026

Auto Tech Asia 2026
Whitepaper
- Middle East & Africa Commercial Security Market Click here to view more.
- Middle East & Africa Fire Safety Systems & Equipment Market Click here to view more.
- GCC Drone Market Click here to view more.
- Middle East Lighting Fixture Market Click here to view more.
- GCC Physical & Perimeter Security Market Click here to view more.