China 3D Visualization Market Size & Growth Rate
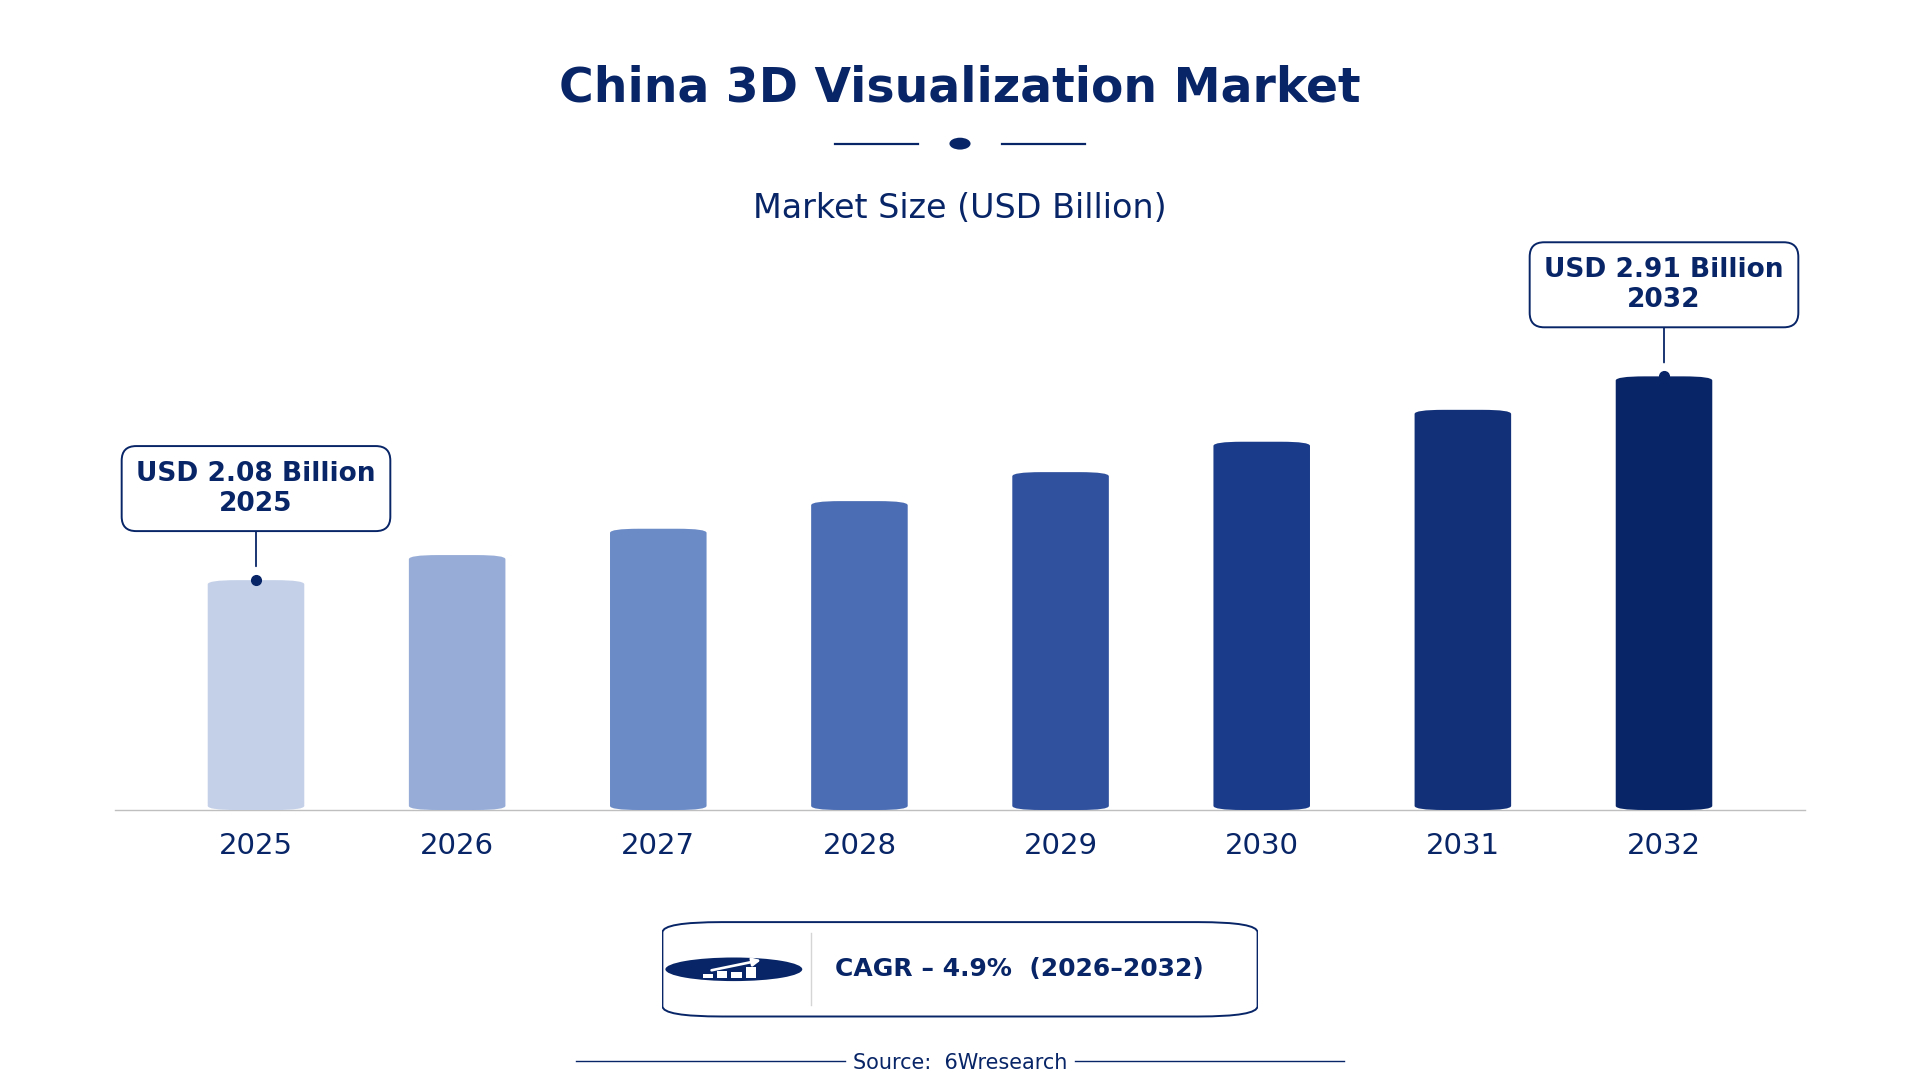
According to 6Wresearch internal database and industry insights, the China 3D Visualization Market was valued at USD 2.08 billion in 2025 and is projected to reach USD 2.91 billion by 2032, growing at a CAGR of approximately 4.9% during 2026–2032.
China 3D Visualization Market Highlights
| Report Metric | Details |
| Report Name | China 3D Visualization Market |
| Market Size 2025 | USD 2.08 billion |
| Market Size 2032 | USD 2.91 billion |
| Absolute Growth 2025–2032 | USD 0.83 billion |
| CAGR 2026–2032 | 4.9% |
| Peak Annual Growth | 7.0% in 2029 |
| Forecast Period | 2026–2032 |
| Historical Data | 2022–2025 |
| Base Year | 2025 |
| Leading Solution Type, 2025 | 3D Modeling Software (43% share) |
| Leading Deployment Mode, 2025 | Cloud-Based (44% share) |
| Leading Platform Type, 2025 | Desktop (46% share) |
| Leading Distribution Channel, 2025 | Direct Sales (44% share) |
| Leading End User Industry, 2025 | Gaming (41% share) |
| Fastest-Growing Solution Type | AR/VR Integration (7.3% CAGR) |
| Fastest-Growing Platform Type | Mobile (6.1% CAGR) |
| Fastest-Growing Distribution Channel | Online Subscription (6.4% CAGR) |
| Fastest-Growing End User Industry | Architecture (7.7% CAGR) |
| Growing Sector | Architecture |
| Key End Users | Gaming, Architecture, Real Estate, Film & Animation |
China 3D Visualization Market Year-wise Growth Rate and Key Drivers (2022–2032)
This graph illustrates the annual growth rates of the market from 2022 to 2032, highlighting a steady upward trajectory and projected market expansion over the forecast period.
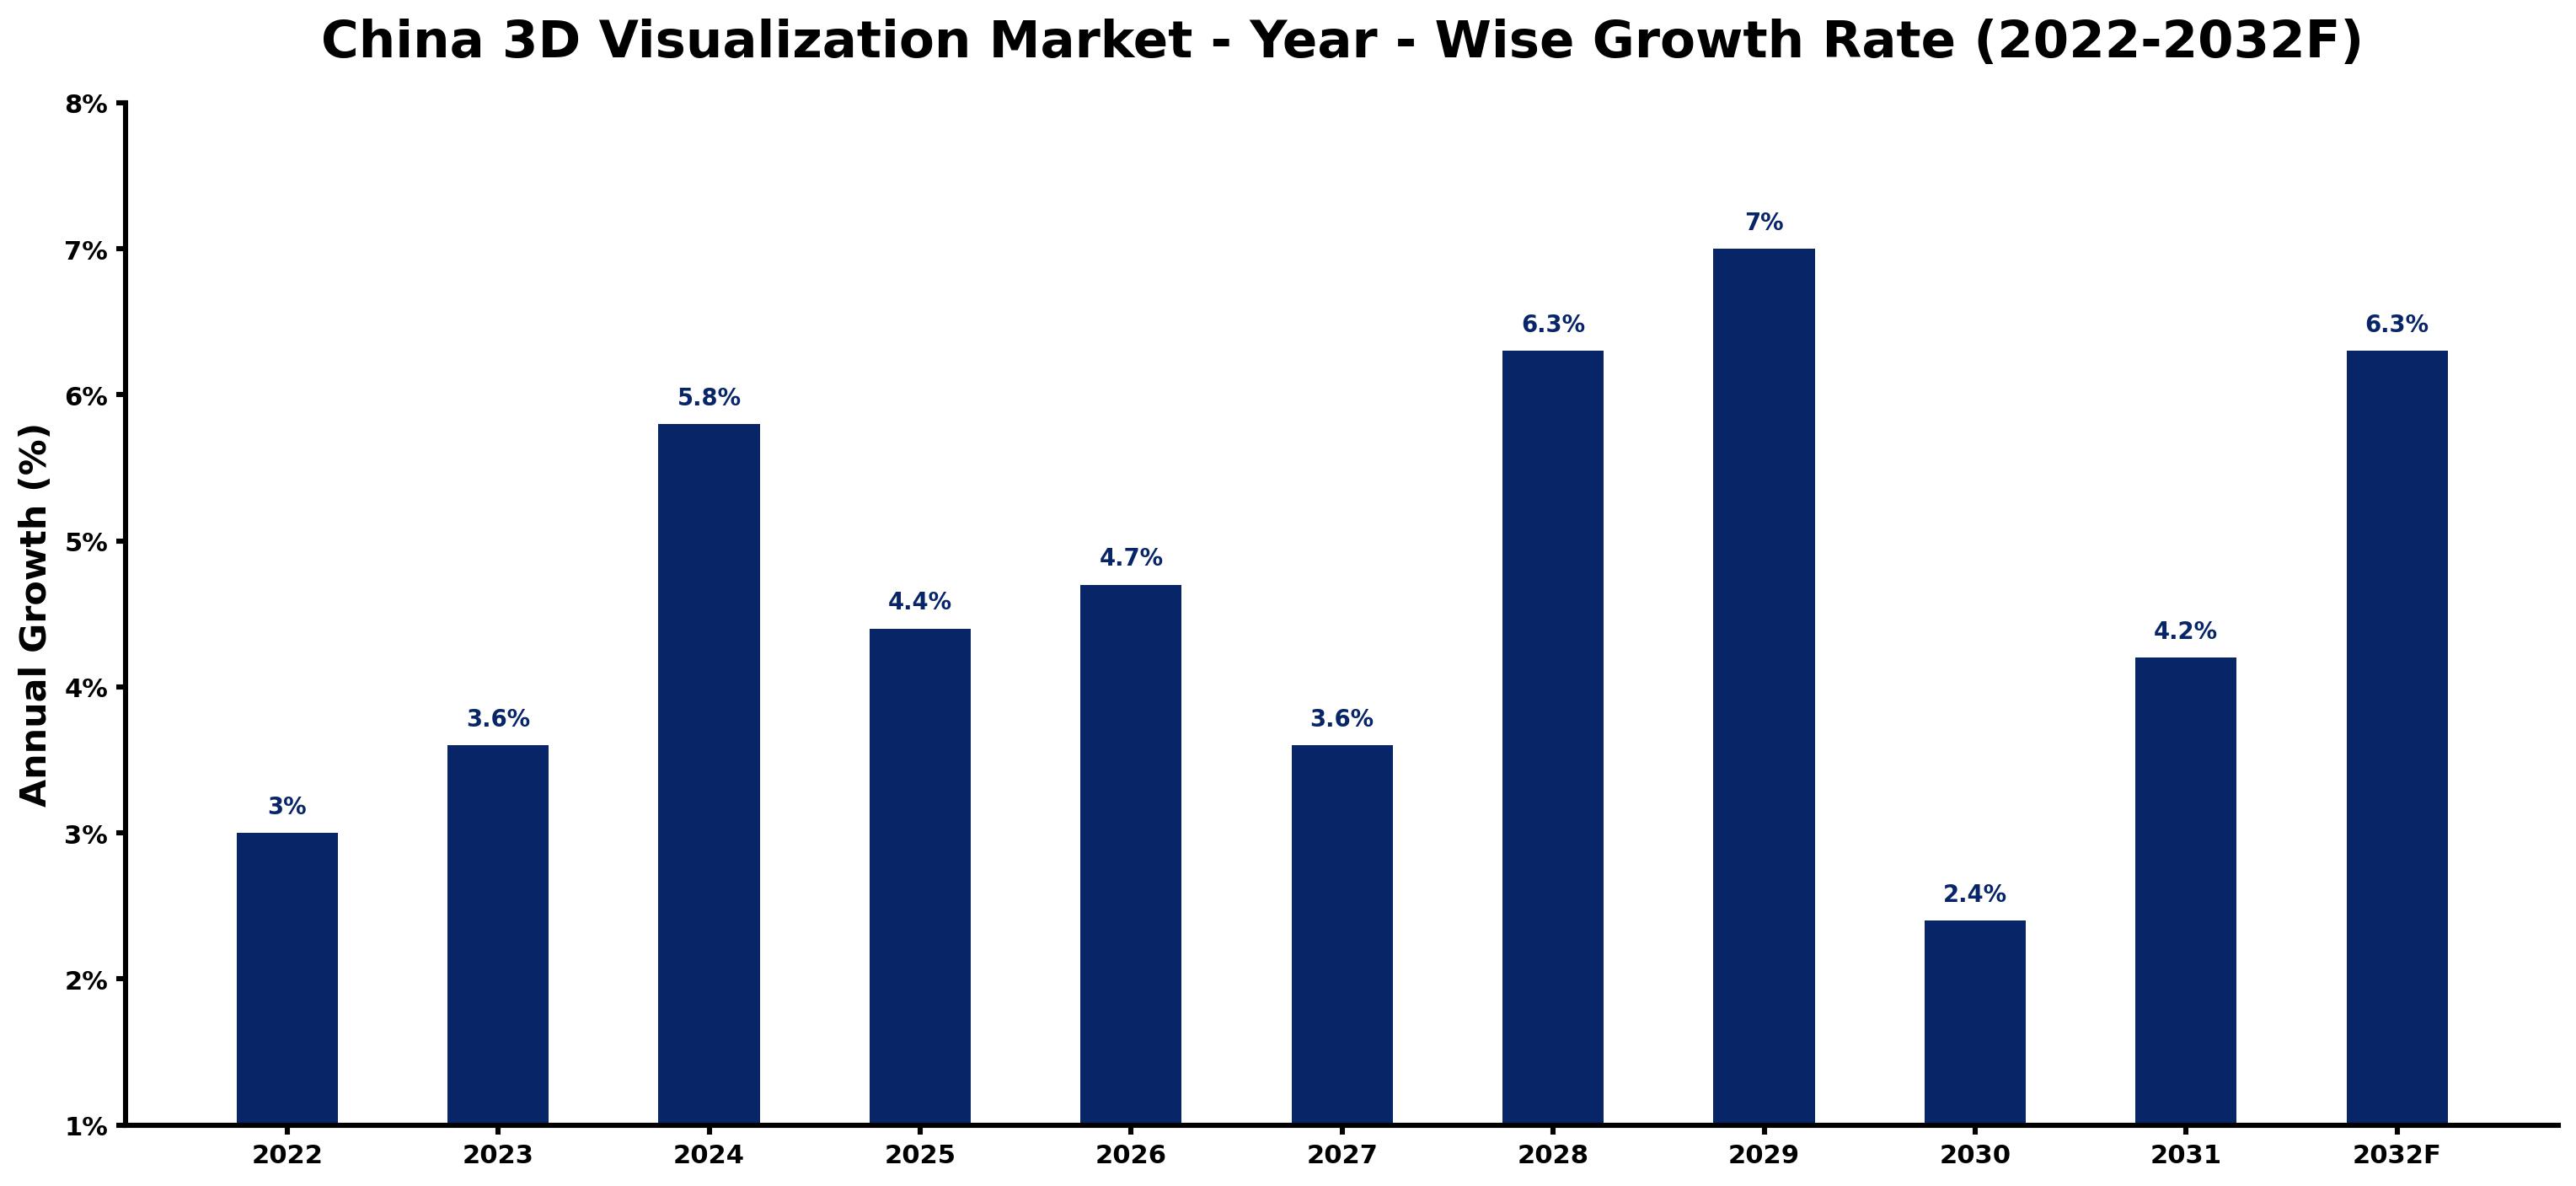
The following table presents the estimated annual growth rate for each year together with the principal factor influencing market performance.
| Year | Estimated Annual Growth (%) | Market Rationale |
| 2022 | 3.0 | The gaming industry generated over 400 billion CNY, boosting demand for visualization tools. |
| 2023 | 3.6 | The number of VR headset users reached 30 million, increasing AR/VR integration needs. |
| 2024 | 5.8 | The architectural sector's growth saw over 50,000 firms adopting 3D technologies. |
| 2025 | 4.4 | The architectural visualization market is projected to reach 15 billion CNY by 2025, influencing growth rates. |
| 2026 | 4.7 | The 'Digital China' initiative is expected to drive technology adoption across sectors. |
| 2027 | 3.6 | The architectural visualization market continues to expand, supporting steady growth. |
| 2028 | 6.3 | Increased investment in AR/VR technologies is anticipated to boost market demand. |
| 2029 | 7.0 | The peak growth is driven by innovations in 3D modeling and simulation software. |
| 2030 | 2.4 | The architectural sector's growth is projected to slow, but remains positive. |
| 2031 | 4.2 | The film industry continues to produce advanced 3D content, driving further demand. |
| 2032 | 6.3 | A growing number of architecture firms are expected to adopt 3D visualization tools. |
Note: Market size estimations and growth projections presented in this report are based on 6Wresearch's proprietary forecasting methodology, utilizing the latest available industry data, government publications, and primary research inputs.
China 3D Visualization Market Synopsis
The 3D Visualization Market in China encompasses technologies that create three-dimensional representations of data and environments. This technology is essential for design visualization, training simulations, and immersive experiences in sectors such as gaming and architecture. The market is growing due to the booming gaming industry, which generated over 400 billion CNY in 2022, and the architectural sector, with over 60% of firms utilizing 3D tools. Initiatives like 'Digital China' are promoting technology adoption, further driving demand for 3D visualization solutions.
Market Dynamics Impact Analysis (2026–2032)
| Factor | Type | Impact | Primary Segment Affected |
| The gaming industry's rapid growth is driving demand for advanced 3D visualization solutions. | Driver | High | Gaming |
| The architectural sector's expansion is increasing the need for visualization tools. | Driver | High | Architecture |
| The rising number of VR headset users presents opportunities for immersive applications. | Opportunity | High | AR/VR Integration |
| The growth of architectural visualization offers significant investment potential. | Opportunity | High | Architecture |
| Limited awareness of advanced 3D technologies can hinder market growth. | Restraint | Medium | 3D Modeling Software |
| High initial costs for advanced software solutions may restrict some buyers. | Restraint | Medium | Simulation Software |
| The market faces challenges in integrating AI technologies effectively. | Challenge | High | AR/VR Integration |
| Competition from international firms poses a threat to local producers. | Challenge | Medium | 3D Modeling Software |
Evaluation of Drivers in China 3D Visualization Market (2026–2032)
Key forces behind demand, with the segment each one moves most, are listed below.
| Drivers | Primary Segment Affected | Why It Matters (Evidence) |
| The gaming industry generated over 400 billion CNY in 2022, driving demand for 3D visualization. | Gaming | This growth leads to increased purchases of visualization tools for game development. |
| The architectural sector is projected to grow, with over 60% of firms utilizing 3D tools. | Architecture | More firms adopting these technologies results in higher demand for software solutions. |
| The number of VR headset users in China reached 30 million in 2023, boosting AR/VR integration demand. | AR/VR Integration | This rise in users encourages investments in immersive 3D applications. |
| The 'Digital China' initiative launched in 2023 is expected to drive technology adoption. | 3D Modeling Software | Increased government support leads to more investments in advanced visualization solutions. |
| Cloud-based solutions accounted for 35% of the 3D software market in 2023, reflecting a shift towards flexible software options. | Cloud-Based | This trend towards flexibility drives demand for cloud-based visualization tools. |
Growth in the 3D Visualization market in China comes from the booming gaming industry, which generated over 400 billion CNY in 2022, leading to increased demand for visualization tools. The architectural sector is also expanding, with over 60% of firms adopting 3D technologies, further driving software purchases. The number of VR headset users reached 30 million in 2023, boosting demand for AR/VR integration. The shift towards cloud-based solutions, which accounted for 35% of the market in 2023, reflects a growing preference for flexible software options.
Evaluation of Restraints in China 3D Visualization Market
The following restraints limit how fast demand can grow.
| Market Restraint | Primary Segment Affected | Why It Matters (Evidence) |
| High costs associated with advanced 3D software limit access for smaller firms. | 3D Modeling Software | The average investment in 3D software exceeds 100,000 CNY, making it difficult for smaller players. |
| Regulatory compliance with updated standards can delay project timelines. | Simulation Software | Firms must navigate complex regulations, impacting their ability to deliver projects on time. |
| Limited integration capabilities with existing systems hinder adoption. | AR/VR Integration | Many firms struggle to incorporate new technologies with their legacy systems. |
| Shortage of skilled professionals affects project execution. | CAD Tools | The demand for trained personnel exceeds supply, slowing down project progress. |
| Market fragmentation leads to inconsistent quality among providers. | Cloud-Based | Diverse offerings create challenges for buyers in selecting reliable solutions. |
China 3D Visualization Market Challenges
The China 3D Visualization market faces several practical issues, with technology adoption being a primary concern. Many firms continue to rely on outdated software, hindering their competitiveness in a rapidly evolving environment. Competition is intense, with over 50,000 architectural firms using 3D tools, pressuring suppliers to lower prices and squeezing profit margins. Buyers often face high costs for advanced software, with average investments exceeding 100,000 CNY per firm. Regulatory challenges arise from compliance with updated national standards, which can extend project timelines for both producers and buyers.
Trends in the China 3D Visualization Market
Several trends are reshaping the China 3D Visualization Market; the most important are set out below.
- Rise in Cloud-Based Solutions: Cloud-based 3D visualization tools are gaining popularity in China, accounting for 35% of the market in 2023. This shift enables firms to access advanced software with lower upfront costs, enhancing flexibility.
- Growth in AR/VR Integration: The integration of AR/VR technologies in 3D visualization is on the rise, driven by a user base of 30 million VR headset users in 2023. This trend is transforming how immersive experiences are delivered across various sectors.
- Increased Adoption in Architecture: The architectural sector is experiencing notable growth, with over 60% of firms utilising 3D visualization tools. This trend is likely to persist as firms aim to enhance design presentations and client engagement.
- Advancements in 3D Modeling Software: Developments in 3D modeling software are propelling market growth, with the architectural sector increasingly depending on these tools for high-quality visual representations. This trend highlights the rising demand for detailed design capabilities.
Investment Opportunities in the China 3D Visualization Market
Investors looking at the China 3D Visualization Market should consider the following areas.
- Investment in 3D Modeling Software: The demand for advanced 3D modeling software is on the rise, with over 60% of architecture firms expected to adopt these tools. Investing in this area can capture substantial market share and improve project delivery.
- Expansion of Cloud-Based Solutions: With cloud-based solutions representing 35% of the market, there is a strong opportunity to provide flexible software options. Targeting small to medium enterprises can yield high returns and enhance accessibility.
- Growth in AR/VR Applications: The emergence of AR/VR technologies offers opportunities for firms to develop immersive applications. Engaging with the gaming sector can drive innovation and boost market presence, encouraging collaboration and creativity.
- Support for Architectural Firms: With the architectural sector projected to grow significantly, suppliers can focus on delivering tailored solutions. Collaborating with local firms can improve market entry and ensure alignment with industry needs.
Government Initiatives in the China 3D Visualization Market
The 'Digital Economy Development Plan' launched by the Ministry of Industry and Information Technology in 2023 aims to promote 3D visualization technologies. This initiative emphasises innovation and investment, encouraging firms to adopt advanced tools and solutions. The plan is set to enhance the overall competitiveness of the industry, leading to increased demand for 3D visualization products. Additionally, the 'Artificial Intelligence Development Plan' approved in 2021 targets a 30% increase in industry adoption by 2025, improving the integration of AI in visualization applications.
The 'New Infrastructure Plan' initiated in 2020 by the National Development and Reform Commission includes a budget of 100 billion CNY for AR/VR technology development. This funding supports projects that enhance technology integration across various sectors, including 3D visualization. Agencies involved will oversee resource allocation to ensure effective implementation of these initiatives, enabling producers to access essential support for their projects.
Future Insight of the China 3D Visualization Market
By 2032, buyers and suppliers in the China 3D Visualization market can expect considerable advancements driven by several key initiatives. The 'Digital China' initiative will accelerate technology integration across various sectors, creating new opportunities for immersive experiences. Architectural visualization is projected to reach 15 billion CNY by 2025, indicating robust growth potential. The rise of cloud-based solutions, which accounted for 35% of the market in 2023, will streamline operations for firms, while the establishment of industry standards will promote quality and consistency across practices.
Market Segmentation Analysis
The report offers a comprehensive study of the following market segments and their leading categories in the market.
By Solution Type – 3D Modeling Software Dominated, AR/VR Integration Expected to Grow Fastest
According to Shubham Deep, Research Manager at 6Wresearch, 3D Modeling Software held a 43% share of the China 3D Visualization Market by solution type in 2025. 3D Modeling Software holds the largest share due to its critical role in creating detailed three-dimensional representations, particularly in architecture and gaming. For instance, the architectural sector extensively utilises this software to visualise designs before construction, ensuring precision and efficiency. AR/VR Integration is projected to grow fastest, at a CAGR of 7.3% during 2026–2032. AR/VR Integration is experiencing rapid growth as it significantly enhances user experience in applications, especially in gaming and training simulations. The increase in VR headset users, reaching 30 million in 2023, is a major factor propelling this demand. Suppliers should focus on developing AR/VR capabilities to meet the rising expectations of users in the 3D visualization market.
By Deployment Mode – Cloud-Based Dominated and Is Expected to Record the Fastest Growth
Cloud-Based accounted for a 44% market share by deployment mode in 2025. Cloud-Based solutions dominate the market as they provide flexibility and accessibility, allowing users to access 3D visualization tools from anywhere. This mode accounted for 35% of the 3D software market in China in 2023, reflecting its widespread adoption. Its lead should widen, with a projected CAGR of 6.1% during 2026–2032, the highest in this split. Cloud-Based solutions are also the fastest-growing segment, driven by the increasing demand for scalable and cost-effective software options. The ongoing 'Digital China' initiative further supports this trend by promoting technology adoption across sectors. Buyers will benefit from the convenience and scalability of cloud-based 3D visualization solutions as they continue to gain traction.
By Platform Type – Desktop Dominated, Mobile Expected to Grow Fastest
In 2025, Desktop led the platform type split with a 46% share. Desktop is the leading platform for 3D visualization software, primarily due to its traditional use in professional settings where detailed work is essential. Many architecture and design firms favour desktop applications for their robust capabilities and comprehensive features. Over 2026–2032, Mobile is expected to post the fastest growth, at a CAGR of 6.1%. Mobile is the fastest-growing platform as users increasingly demand on-the-go access to visualization tools. This trend is driven by the rise in mobile device usage, enabling professionals to work remotely and easily access their projects. Suppliers should optimise their offerings for mobile platforms to capture the growing segment of users seeking flexibility.
By Distribution Channel – Direct Sales Dominated, Online Subscription Expected to Grow Fastest
The largest distribution channel category in 2025 was Direct Sales, with a 44% share of total revenue. Direct Sales is the predominant channel for distributing 3D visualization software, facilitating personal interaction and tailored solutions for clients. This approach is particularly effective in professional sectors that require specific software functionalities and support. Online Subscription is set to record the highest CAGR in this split, 6.4% over 2026–2032. Online Subscription is the fastest-growing distribution channel, appealing to users who prefer flexible payment options and immediate access to software. The increasing trend towards digital solutions is driving this model forward, making it more attractive to a wider audience. Suppliers must enhance their online subscription offerings to align with the market's shift towards more flexible purchasing options.
By End User Industry – Gaming Dominated, Architecture Expected to Grow Fastest
Gaming took a 41% share of end user industry in 2025, more than any other category. Gaming is the largest user of 3D visualization technologies, driven by the industry's massive revenue generation of over 400 billion CNY in 2022. This sector's demand for high-quality graphics and immersive experiences fuels its dominance. Architecture is projected to grow fastest, at a CAGR of 7.7% during 2026–2032. Architecture is the fastest-growing end-user industry, as it becomes increasingly essential for design and client presentations. The architectural visualization market is projected to reach 15 billion CNY by 2025, indicating strong growth potential. Suppliers should tailor their solutions to meet the specific needs of the architecture sector, which is rapidly adopting advanced 3D visualization tools.
Key Attractiveness of the Report
- 10 Years of Market Numbers
- Historical Data Starting from 2022 to 2025
- Base Year 2025
- Forecast Data until 2032
- Key Performance Indicators Impacting the Market
- Major Upcoming Developments and Projects
Key Highlights of the Report:
- China 3D Visualization Market Outlook
- Market Size of China 3D Visualization Market, 2025
- Forecast of China 3D Visualization Market, 2032
- Historical Data and Forecast of China 3D Visualization Revenues & Volume for the Period 2022 - 2032F
- China 3D Visualization Market Trend Evolution
- China 3D Visualization Market Drivers and Challenges
- China 3D Visualization Price Trends
- China 3D Visualization Porter's Five Forces
- China 3D Visualization Industry Life Cycle
- Historical Data and Forecast of China 3D Visualization Market Revenues & Volume By Solution Type for the Period 2022 - 2032F
- Historical Data and Forecast of China 3D Visualization Market Revenues & Volume By 3D Modeling Software for the Period 2022 - 2032F
- Historical Data and Forecast of China 3D Visualization Market Revenues & Volume By Simulation Software for the Period 2022 - 2032F
- Historical Data and Forecast of China 3D Visualization Market Revenues & Volume By AR/VR Integration for the Period 2022 - 2032F
- Historical Data and Forecast of China 3D Visualization Market Revenues & Volume By CAD Tools for the Period 2022 - 2032F
- Historical Data and Forecast of China 3D Visualization Market Revenues & Volume By Deployment Mode for the Period 2022 - 2032F
- Historical Data and Forecast of China 3D Visualization Market Revenues & Volume By On-Premise for the Period 2022 - 2032F
- Historical Data and Forecast of China 3D Visualization Market Revenues & Volume By Cloud-Based for the Period 2022 - 2032F
- Historical Data and Forecast of China 3D Visualization Market Revenues & Volume By Hybrid for the Period 2022 - 2032F
- Historical Data and Forecast of China 3D Visualization Market Revenues & Volume By SaaS for the Period 2022 - 2032F
- Historical Data and Forecast of China 3D Visualization Market Revenues & Volume By Platform Type for the Period 2022 - 2032F
- Historical Data and Forecast of China 3D Visualization Market Revenues & Volume By Desktop for the Period 2022 - 2032F
- Historical Data and Forecast of China 3D Visualization Market Revenues & Volume By Mobile for the Period 2022 - 2032F
- Historical Data and Forecast of China 3D Visualization Market Revenues & Volume By VR Headsets for the Period 2022 - 2032F
- Historical Data and Forecast of China 3D Visualization Market Revenues & Volume By Web-Based for the Period 2022 - 2032F
- Historical Data and Forecast of China 3D Visualization Market Revenues & Volume By Distribution Channel for the Period 2022 - 2032F
- Historical Data and Forecast of China 3D Visualization Market Revenues & Volume By Direct Sales for the Period 2022 - 2032F
- Historical Data and Forecast of China 3D Visualization Market Revenues & Volume By Online Subscription for the Period 2022 - 2032F
- Historical Data and Forecast of China 3D Visualization Market Revenues & Volume By Specialized Resellers for the Period 2022 - 2032F
- Historical Data and Forecast of China 3D Visualization Market Revenues & Volume By B2B Platforms for the Period 2022 - 2032F
- Historical Data and Forecast of China 3D Visualization Market Revenues & Volume By End User Industry for the Period 2022 - 2032F
- Historical Data and Forecast of China 3D Visualization Market Revenues & Volume By Film & Animation for the Period 2022 - 2032F
- Historical Data and Forecast of China 3D Visualization Market Revenues & Volume By Gaming for the Period 2022 - 2032F
- Historical Data and Forecast of China 3D Visualization Market Revenues & Volume By Real Estate for the Period 2022 - 2032F
- Historical Data and Forecast of China 3D Visualization Market Revenues & Volume By Architecture for the Period 2022 - 2032F
- China 3D Visualization Import Export Trade Statistics
- Market Opportunity Assessment By Solution Type
- Market Opportunity Assessment By Deployment Mode
- Market Opportunity Assessment By Platform Type
- Market Opportunity Assessment By Distribution Channel
- Market Opportunity Assessment By End User Industry
- China 3D Visualization Top Companies Market Share
- China 3D Visualization Competitive Benchmarking By Technical and Operational Parameters
- China 3D Visualization Company Profiles
- China 3D Visualization Key Strategic Recommendations
Market Covered
The report offers an extensive study of the following market segments.
By Solution Type
- 3D Modeling Software
- Simulation Software
- AR/VR Integration
- CAD Tools
By Deployment Mode
- On-Premise
- Cloud-Based
- Hybrid
- SaaS
By Platform Type
- Desktop
- Mobile
- VR Headsets
- Web-Based
By Distribution Channel
- Direct Sales
- Online Subscription
- Specialized Resellers
- B2B Platforms
By End User Industry
- Film & Animation
- Gaming
- Real Estate
- Architecture































