China Inorganic Compounds Market Size & Growth Rate
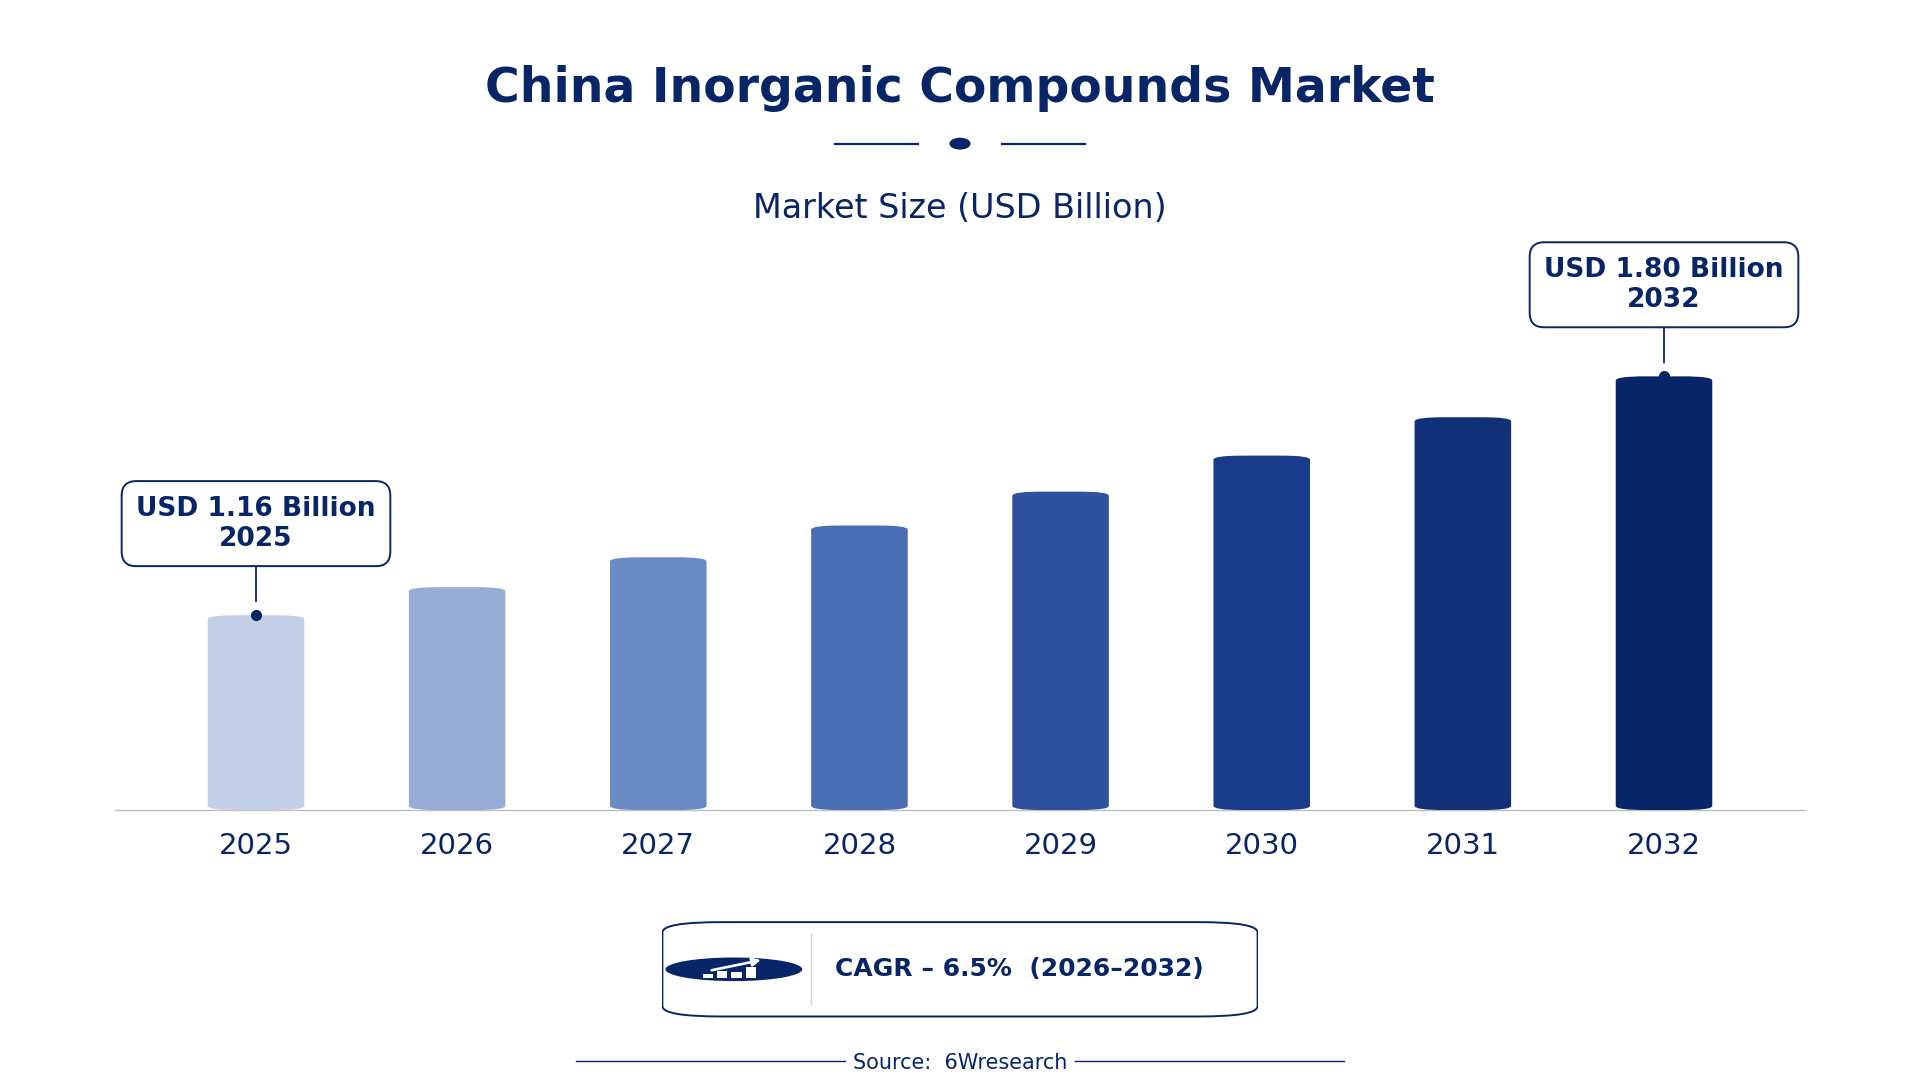
According to 6Wresearch internal database and industry insights, the China Inorganic Compounds Market was valued at USD 1.16 billion in 2025 and is projected to reach USD 1.80 billion by 2032, growing at a CAGR of approximately 6.5% during 2026–2032.
China Inorganic Compounds Market Highlights
| Report Metric | Details |
| Report Name | China Inorganic Compounds Market |
| Market Size 2025 | USD 1.16 billion |
| Market Size 2032 | USD 1.80 billion |
| Absolute Growth 2025–2032 | USD 0.64 billion |
| CAGR 2026–2032 | 6.5% |
| Peak Annual Growth | 8.4% in 2029 |
| Forecast Period | 2026–2032 |
| Historical Data | 2022–2025 |
| Base Year | 2025 |
| Leading Compound Type, 2025 | Inorganic Acids (49% share) |
| Leading Element Class, 2025 | Fe (15% share) |
| Leading Industrial Use, 2025 | Fertilizer (36% share) |
| Leading Form Factor, 2025 | Granular (41% share) |
| Leading Sector, 2025 | Agriculture (44% share) |
| Fastest-Growing Compound Type | Salts (8.5% CAGR) |
| Fastest-Growing Element Class | Zn (9.2% CAGR) |
| Fastest-Growing Industrial Use | Cleaning Agents (8.8% CAGR) |
| Fastest-Growing Form Factor | Liquid/Powder (8.0% CAGR) |
| Fastest-Growing Sector | Pharma (8.7% CAGR) |
| Growing Sector | Agriculture |
| Key End Users | Agricultural producers, pharmaceutical manufacturers, cleaning product manufacturers, chemical producers |
China Inorganic Compounds Market Year-wise Growth Rate and Key Drivers (2022–2032)
This graph illustrates the annual growth rates of the market from 2022 to 2032, highlighting a steady upward trajectory and projected market expansion over the forecast period.
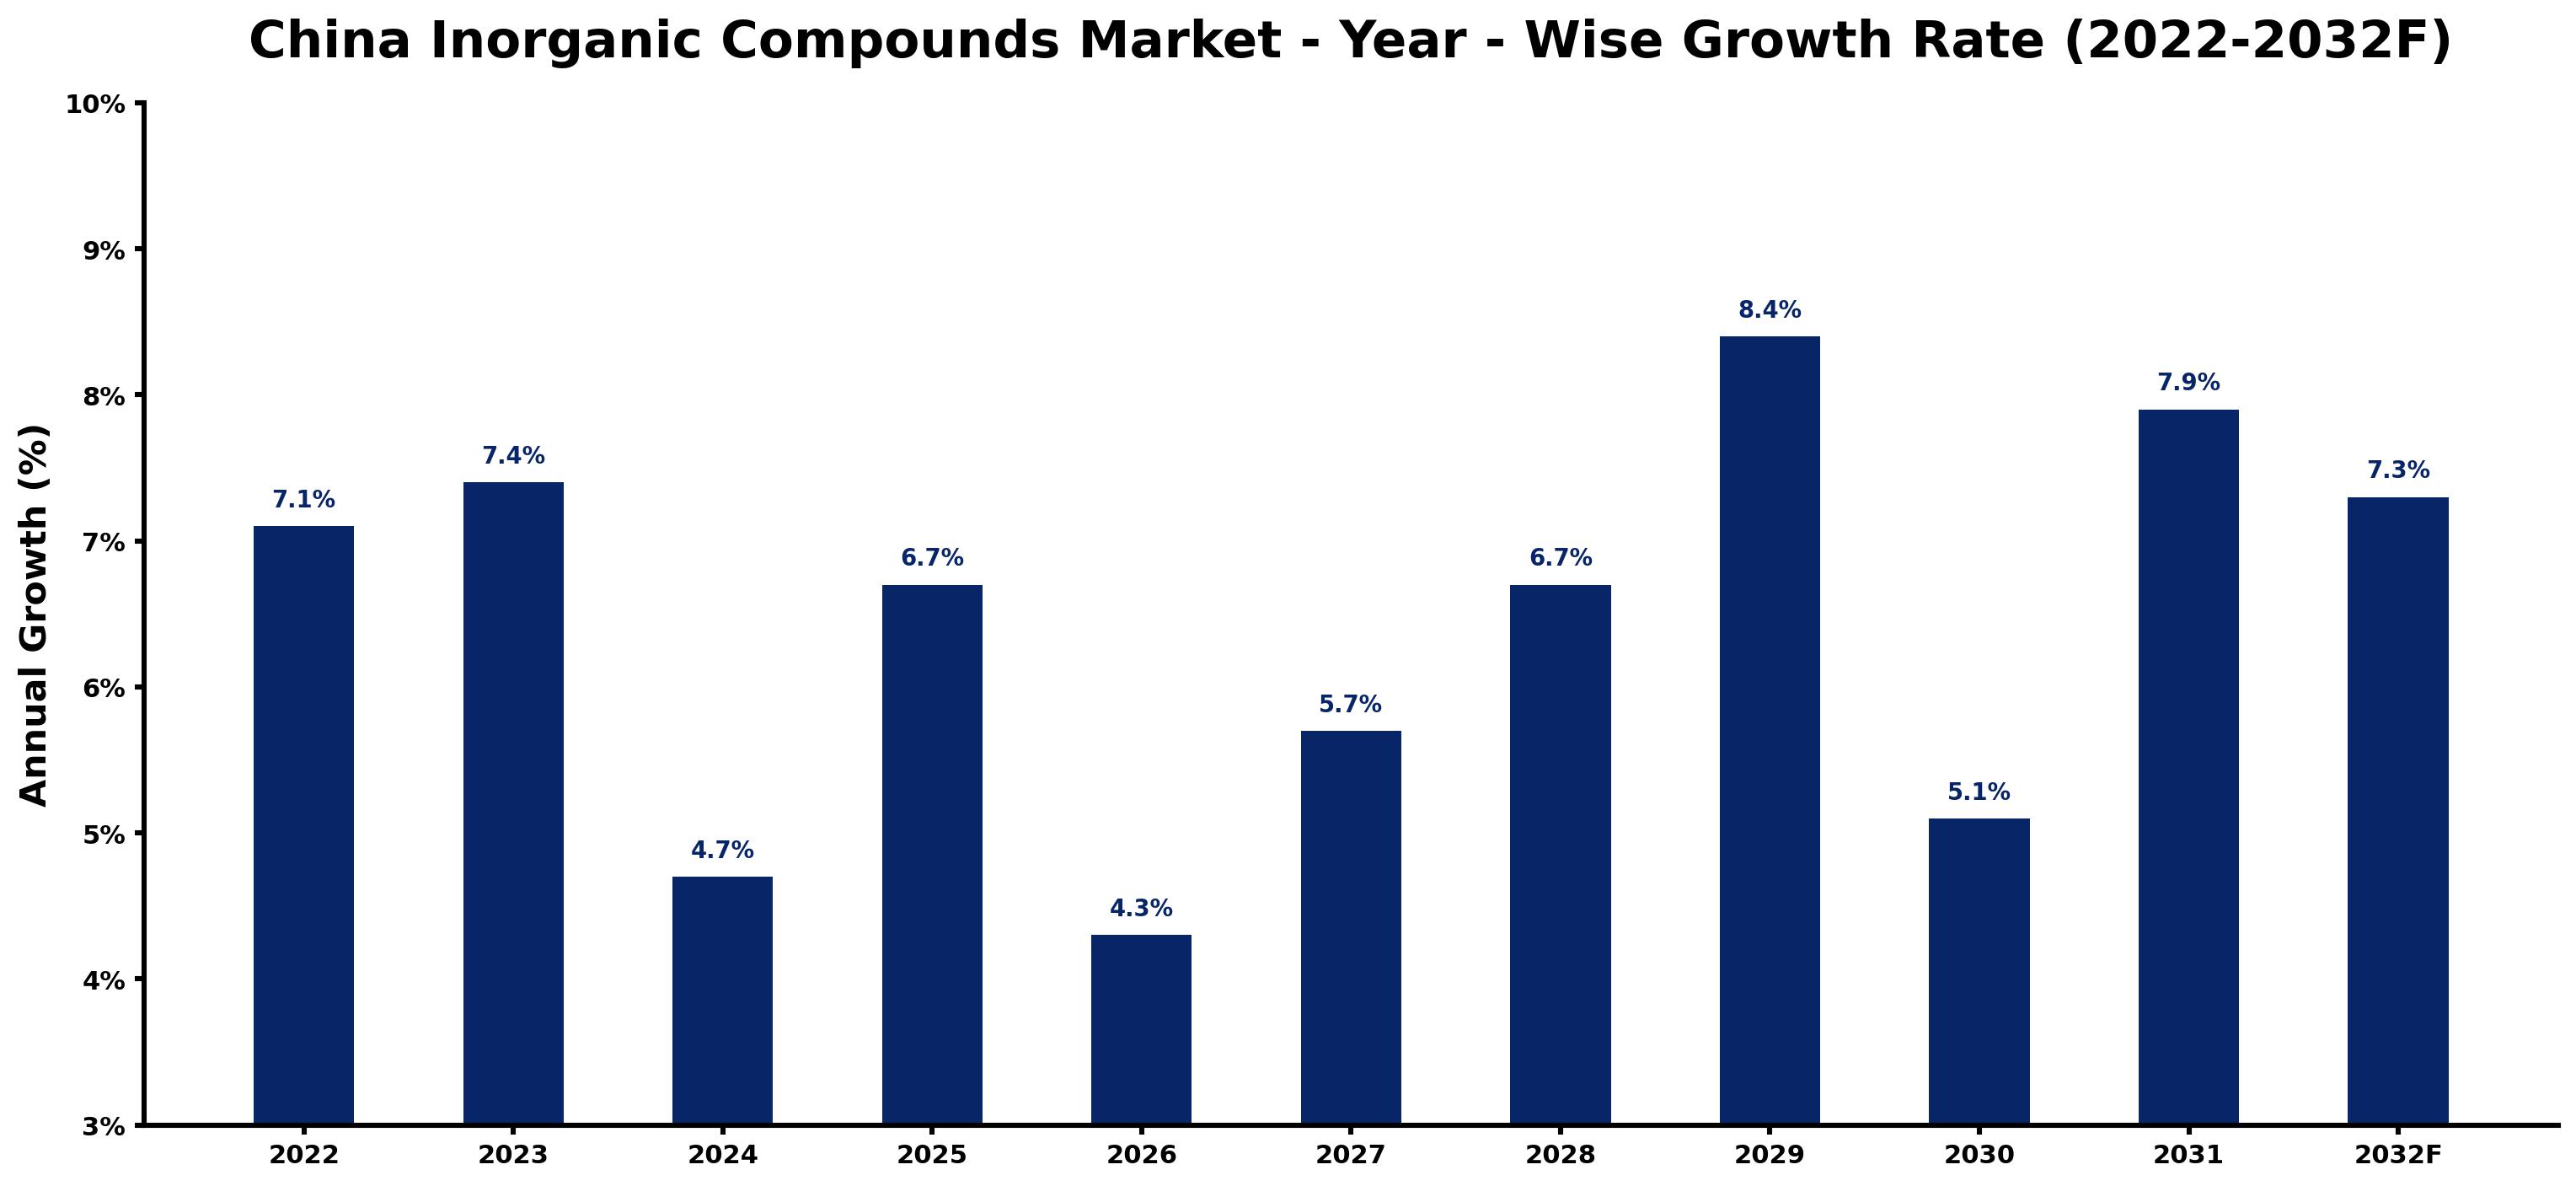
The following table presents the estimated annual growth rate for each year together with the principal factor influencing market performance.
| Year | Estimated Annual Growth (%) | Market Rationale |
| 2022 | 7.1 | The market experienced steady growth due to strong demand from the agricultural sector. |
| 2023 | 7.4 | Growth accelerated as the agricultural sector consumed approximately 30 million tons of fertilizers. |
| 2024 | 4.7 | The growth rate slowed as the market adjusted to previous high consumption levels. |
| 2025 | 6.7 | Demand increased again, driven by the Soil Health Improvement Program promoting fertilizer use. |
| 2026 | 4.3 | Growth is expected to slow as the market faces challenges in production efficiency and regulatory compliance. |
| 2027 | 5.7 | The market is projected to rebound with faster growth from rising demand in the cleaning agents segment. |
| 2028 | 6.7 | Demand is expected to continue to rise, supported by the Green Agriculture Development Plan's initiatives. |
| 2029 | 8.4 | Growth is projected to peak due to heightened agricultural activity and increased fertilizer efficiency. |
| 2030 | 5.1 | The growth rate is expected to slow as the market stabilises after the previous peak. |
| 2031 | 7.9 | Demand is projected to increase again, driven by the pharmaceutical sector's rising needs. |
| 2032 | 7.3 | Growth is expected to slow as the market adjusts to evolving regulatory requirements. |
Note: Market size estimations and growth projections presented in this report are based on 6Wresearch's proprietary forecasting methodology, utilizing the latest available industry data, government publications, and primary research inputs.
China Inorganic Compounds Market Synopsis
Inorganic Compounds in China include a range of chemical substances crucial for agriculture, manufacturing, and pharmaceuticals. These compounds are produced through synthesis and extraction processes, finding applications in fertilizers and cleaning agents. The China Inorganic Compounds Market is growing due to rising agricultural productivity demands and an expanding pharmaceutical sector. The agricultural sector's fertilizer consumption, which reached around 30 million tons in 2022, drives this growth. Government initiatives like the Soil Health Improvement Program encourage sustainable practices, further expanding market potential.
Market Dynamics Impact Analysis (2026–2032)
| Factor | Type | Impact | Primary Segment Affected |
| Rising agricultural productivity demands | Driver | High | Fertilizer |
| Increasing pharmaceutical sector needs | Driver | High | Pharma |
| Investment in sustainable agriculture | Opportunity | High | Fertilizer |
| Growing demand for cleaning agents | Opportunity | Medium | Cleaning Agents |
| Production inefficiencies due to regulations | Restraint | High | Inorganic Acids |
| High costs associated with compliance | Restraint | Medium | Metal Oxides |
| Market faces challenges from regulatory compliance | Challenge | High | Nonmetal Compounds |
| Technological advancements lagging behind demand | Challenge | Medium | Salts |
Evaluation of Drivers in China Inorganic Compounds Market (2026–2032)
Below mentioned are some major drivers and their influence on market dynamics.
| Drivers | Primary Segment Affected | Why It Matters (Evidence) |
| Increased agricultural productivity | Fertilizer | The agricultural sector consumed approximately 30 million tons of fertilizers in 2022, driving demand for inorganic compounds. |
| Growing pharmaceutical sector | Pharma | The expansion of the pharmaceutical sector in China is increasing the need for inorganic compounds in drug formulation, with demand projected to rise significantly. |
| Government initiatives promoting sustainable practices | Fertilizer | The Soil Health Improvement Program launched in 2023 encourages the use of inorganic fertilizers to improve soil quality. |
| Rising demand for cleaning agents | Cleaning Agents | The installed base of cleaning agents in China is estimated to exceed 1 billion liters annually, with a significant portion being inorganic. |
| Technological advancements in fertilizer efficiency | Fertilizer | The Green Agriculture Development Plan, with a budget of 2 billion yuan, aims to improve fertilizer efficiency and reduce environmental impact. |
Market growth in China for Inorganic Compounds relies on increased agricultural productivity, heightened needs from the pharmaceutical sector, and investments in sustainable practices. The agricultural sector consumed about 30 million tons of fertilizers in 2022, generating strong demand for these compounds. The pharmaceutical industry is rapidly evolving, leading to a greater requirement for inorganic substances in drug formulation. The installed base of cleaning agents in China is estimated to surpass 1 billion litres annually, further driving demand for inorganic compounds.
Evaluation of Restraints in China Inorganic Compounds Market
The table below lists the restraints and the evidence behind each.
| Market Restraint | Primary Segment Affected | Why It Matters (Evidence) |
| Regulatory compliance costs | Inorganic Acids | Compliance with the Chemical Safety Management Regulation increases production costs for manufacturers. |
| Production inefficiencies | Metal Oxides | Regulatory requirements can lead to inefficiencies in production processes, affecting supply. |
| High costs of raw materials | Nonmetal Compounds | Rising prices of essential raw materials impact the profitability of producers. |
| Limited technological advancements | Salts | Technological advancements have not kept pace with demand, limiting production capacity. |
| Market entry barriers due to regulations | Fertilizer | Strict regulations can hinder new entrants from accessing the market effectively. |
China Inorganic Compounds Market Challenges
The China Inorganic Compounds Market faces several practical issues, with a notable skills shortage being one. Many producers struggle to recruit qualified personnel due to the rapid expansion of the chemical sector, which delays production timelines and increases training costs for employers. Supply chain disruptions also present challenges, as fluctuations in raw material availability can elevate input costs, affecting pricing strategies for suppliers. Regulatory hurdles complicate operations, with stringent standards such as GB 2760-2014 raising operational costs for manufacturers, ultimately influencing product pricing for buyers. Competition from imported inorganic compounds pressures local producers, compelling them to lower prices and potentially diminishing profit margins.
Trends in the China Inorganic Compounds Market
Below mentioned are some of the trends shaping the China Inorganic Compounds Market growth.
- Shift towards Sustainable Fertilizer Use: Farmers are increasingly adopting sustainable practices under the Soil Health Improvement Program, which promotes the use of inorganic fertilizers. This initiative has a budget of 2 billion yuan, aiming to improve soil quality.
- Growing Demand for Cleaning Agents: The demand for cleaning agents is rising in urban areas, with over 1 billion litres consumed annually. This trend reflects a shift towards more efficient cleaning solutions in households and industries.
- Increase in Granular Fertilizer Usage: The use of granular fertilizers has increased by 15% in the last five years, driven by their efficiency in agricultural practices. This trend highlights a shift towards more effective fertilizer application methods.
- Expansion of the Pharmaceutical Sector: The pharmaceutical sector is rapidly growing, with increasing demand for inorganic compounds in drug formulation. This growth is supported by a projected increase in pharmaceutical production capacity.
Investment Opportunities in the China Inorganic Compounds Market
Several openings in the China Inorganic Compounds Market merit attention from investors.
- Joint Ventures for Sustainable Practices: Now is an ideal time for joint ventures in the fertilizer sector, especially under the Soil Health Improvement Program, which promotes sustainable practices. Collaborating with local agricultural cooperatives can facilitate market entry.
- Investing in Cleaning Agent Production: The demand for cleaning agents is rising, presenting an opportunity to invest in production facilities. Urban areas are key markets, where partnerships with local distributors can facilitate entry.
- Supplying Granular Fertilizers: With the increased usage of granular fertilizers, there is an opportunity to supply these products. Engaging with agricultural cooperatives in provinces like Jiangsu can improve market penetration.
- Enhancing Inorganic Acid Production: Investing in the production of inorganic acids can meet the growing demands of the chemical industry. Collaborating with local manufacturers can streamline the approval process and improve production efficiency.
Government Initiatives in the China Inorganic Compounds Market
The Environmental Protection Law, amended in 2020, strengthens regulations on the production and use of inorganic compounds to protect public health. This law mandates stricter compliance measures for producers, ensuring safer practices in the industry. Additionally, the National Fertilizer Development Plan, approved in 2020, aims for a 20% increase in fertilizer efficiency by 2025, promoting the use of inorganic fertilizers in agriculture. This initiative encourages manufacturers to adopt more efficient production techniques and improve product quality.
In 2023, the Ministry of Agriculture allocated 2 billion yuan for the Green Agriculture Development Plan, aimed at improving fertilizer efficiency and reducing environmental impact. This funding supports initiatives that promote sustainable agricultural practices and improve soil health. The Ministry of Ecology and Environment oversees the implementation of the Chemical Safety Management Regulation, ensuring that producers adhere to safety standards in chemical production. This regulation establishes safety protocols and protects public health.
Future Insight of the China Inorganic Compounds Market
The China Inorganic Compounds Market is poised for positive changes over the coming years, driven by several key initiatives. The government's 'Soil Health Improvement Program' will enhance fertilizer use efficiency, benefiting agricultural productivity. The 'Green Agriculture Development Plan' aims to improve fertilizer effectiveness, positively impacting suppliers and buyers alike. By 2032, the pharmaceutical sector's demand for inorganic compounds is expected to rise significantly, reflecting the industry's growth. The introduction of the 'Chemical Safety Management Regulation' will establish higher safety standards, fostering a more competitive environment for domestic producers.
Market Segmentation Analysis
Each segment group is reviewed below, with the leader by share and the fastest grower by CAGR.
By Compound Type – Inorganic Acids Dominated, Salts Expected to Grow Fastest
According to Shubham Deep, Research Manager at 6Wresearch, the largest compound type category in 2025 was Inorganic Acids, with a 49% share of total revenue. Inorganic acids dominate the market share as they are critical for chemical synthesis and cleaning agents, which are essential across various industries. For instance, sulfuric acid plays a vital role in fertilizer production, highlighting its significance in the inorganic compounds market. The quickest growth will come from Salts, forecast to expand at a CAGR of 8.5% between 2026 and 2032. Salts are experiencing rapid growth, largely due to their extensive applications in food processing and agriculture, where efficiency is increasingly prioritised. The recent 15% rise in granular fertilizer use over the past five years exemplifies this trend. Suppliers should focus on increasing the production and distribution of salts to meet the surging demand in agriculture and food processing.
By Element Class – Fe Dominated, Zn Expected to Grow Fastest
In 2025, Fe led the element class split with a 15% share. Iron (Fe) holds the largest market share owing to its widespread use in steel production and catalysts, forming the backbone of numerous industrial processes. The robust demand for iron in construction and manufacturing further solidifies its leading position. Over 2026–2032, Zn is expected to post the fastest growth, at a CAGR of 9.2%. Zinc (Zn) is witnessing the fastest growth due to its importance in galvanization and fertilizers, which are vital for agricultural productivity. The increasing emphasis on sustainable farming practices is further driving zinc's demand in the market. Buyers should secure zinc supplies to leverage its growing significance in agriculture and manufacturing.
By Industrial Use – Fertilizer Dominated, Cleaning Agents Expected to Grow Fastest
Fertilizer accounted for a 36% market share by industrial use in 2025. Fertilizers lead the market share as they are essential for agricultural productivity, with around 30 million tons consumed in 2022. This substantial consumption underscores the crucial role fertilizers play in satisfying the food requirements of China's 1.4 billion population. Cleaning Agents are set to record the highest CAGR in this split, 8.8% over 2026–2032. Cleaning agents are rapidly growing, driven by their widespread use in both industrial and household cleaning applications. The estimated installed base of over 1 billion litres of cleaning agents annually indicates robust demand for these products. Suppliers should enhance their offerings in cleaning agents to capitalise on the expanding market driven by hygiene and sanitation needs.
By Form Factor – Granular Dominated, Liquid/Powder Expected to Grow Fastest
With a 41% revenue share in 2025, Granular was the largest form factor category. Granular forms capture the largest market share as they are commonly utilised for fertilizers and chemicals, making them a preferred option among manufacturers. Their effectiveness in application and storage contributes to their widespread adoption in the industry. Liquid/Powder is projected to grow fastest, at a CAGR of 8.0% during 2026–2032. Liquid and powder forms are experiencing rapid growth due to their versatility in various applications, particularly in agriculture. This shift towards more efficient application methods in farming is driving their increased demand. Manufacturers should invest in developing liquid and powder formulations to meet the evolving preferences of users in agriculture.
By Sector – Agriculture Dominated, Pharma Expected to Grow Fastest
Agriculture held a 44% share of the China Inorganic Compounds Market by sector in 2025. The agriculture sector commands the largest share as it is the primary user of fertilizers, crucial for boosting crop yields. Government initiatives like the 'Soil Health Improvement Program' ensure that the sector's demand for inorganic compounds remains robust. The quickest growth will come from Pharma, forecast to expand at a CAGR of 8.7% between 2026 and 2032. The pharmaceutical sector is witnessing the fastest growth, propelled by the rising demand for inorganic compounds in drug manufacturing and formulation. This growth is supported by the rapid expansion of the pharmaceutical industry in China. Suppliers should explore opportunities in the pharmaceutical sector to capitalise on the increasing demand for inorganic compounds in drug formulation.
Key Attractiveness of the Report
- 10 Years of Market Numbers
- Historical Data Starting from 2022 to 2025
- Base Year 2025
- Forecast Data until 2032
- Key Performance Indicators Impacting the Market
- Major Upcoming Developments and Projects
Key Highlights of the Report:
- China Inorganic Compounds Market Outlook
- Market Size of China Inorganic Compounds Market, 2025
- Forecast of China Inorganic Compounds Market, 2032
- Historical Data and Forecast of China Inorganic Compounds Revenues & Volume for the Period 2022 - 2032F
- China Inorganic Compounds Market Trend Evolution
- China Inorganic Compounds Market Drivers and Challenges
- China Inorganic Compounds Price Trends
- China Inorganic Compounds Porter's Five Forces
- China Inorganic Compounds Industry Life Cycle
- Historical Data and Forecast of China Inorganic Compounds Market Revenues & Volume By Compound Type for the Period 2022 - 2032F
- Historical Data and Forecast of China Inorganic Compounds Market Revenues & Volume By Metal Oxides for the Period 2022 - 2032F
- Historical Data and Forecast of China Inorganic Compounds Market Revenues & Volume By Nonmetal Compounds for the Period 2022 - 2032F
- Historical Data and Forecast of China Inorganic Compounds Market Revenues & Volume By Salts for the Period 2022 - 2032F
- Historical Data and Forecast of China Inorganic Compounds Market Revenues & Volume By Inorganic Acids for the Period 2022 - 2032F
- Historical Data and Forecast of China Inorganic Compounds Market Revenues & Volume By Element Class for the Period 2022 - 2032F
- Historical Data and Forecast of China Inorganic Compounds Market Revenues & Volume By Fe, Zn, Cu for the Period 2022 - 2032F
- Historical Data and Forecast of China Inorganic Compounds Market Revenues & Volume By P, S, Cl for the Period 2022 - 2032F
- Historical Data and Forecast of China Inorganic Compounds Market Revenues & Volume By Na, K, Mg for the Period 2022 - 2032F
- Historical Data and Forecast of China Inorganic Compounds Market Revenues & Volume By HNO3, H3PO4 for the Period 2022 - 2032F
- Historical Data and Forecast of China Inorganic Compounds Market Revenues & Volume By Industrial Use for the Period 2022 - 2032F
- Historical Data and Forecast of China Inorganic Compounds Market Revenues & Volume By Ceramics, Catalysts for the Period 2022 - 2032F
- Historical Data and Forecast of China Inorganic Compounds Market Revenues & Volume By Disinfectants, Fertilizer for the Period 2022 - 2032F
- Historical Data and Forecast of China Inorganic Compounds Market Revenues & Volume By Reactants for the Period 2022 - 2032F
- Historical Data and Forecast of China Inorganic Compounds Market Revenues & Volume By Cleaning Agents for the Period 2022 - 2032F
- Historical Data and Forecast of China Inorganic Compounds Market Revenues & Volume By Form Factor for the Period 2022 - 2032F
- Historical Data and Forecast of China Inorganic Compounds Market Revenues & Volume By Granular for the Period 2022 - 2032F
- Historical Data and Forecast of China Inorganic Compounds Market Revenues & Volume By Liquid/Powder for the Period 2022 - 2032F
- Historical Data and Forecast of China Inorganic Compounds Market Revenues & Volume By Crystal for the Period 2022 - 2032F
- Historical Data and Forecast of China Inorganic Compounds Market Revenues & Volume By Liquid for the Period 2022 - 2032F
- Historical Data and Forecast of China Inorganic Compounds Market Revenues & Volume By Sector for the Period 2022 - 2032F
- Historical Data and Forecast of China Inorganic Compounds Market Revenues & Volume By Automotive & Electronics for the Period 2022 - 2032F
- Historical Data and Forecast of China Inorganic Compounds Market Revenues & Volume By Agriculture for the Period 2022 - 2032F
- Historical Data and Forecast of China Inorganic Compounds Market Revenues & Volume By Food, Pharma for the Period 2022 - 2032F
- Historical Data and Forecast of China Inorganic Compounds Market Revenues & Volume By Industrial Cleaning for the Period 2022 - 2032F
- China Inorganic Compounds Import Export Trade Statistics
- Market Opportunity Assessment By Compound Type
- Market Opportunity Assessment By Element Class
- Market Opportunity Assessment By Industrial Use
- Market Opportunity Assessment By Form Factor
- Market Opportunity Assessment By Sector
- China Inorganic Compounds Top Companies Market Share
- China Inorganic Compounds Competitive Benchmarking By Technical and Operational Parameters
- China Inorganic Compounds Company Profiles
- China Inorganic Compounds Key Strategic Recommendations
Market Covered
Segments analysed in this report are listed below.
By Compound Type
- Metal Oxides
- Nonmetal Compounds
- Salts
- Inorganic Acids
By Element Class
- Fe
- Zn
- Cu
- P
- S
- Cl
- Na
- K
- Mg
- HNO3
- H3PO4
By Industrial Use
- Ceramics
- Catalysts
- Disinfectants
- Fertilizer
- Reactants
- Cleaning Agents
By Form Factor
- Granular
- Liquid/Powder
- Crystal
- Liquid
By Sector
- Automotive & Electronics
- Agriculture
- Food
- Pharma
- Industrial Cleaning































