China Satellite Mapping Market Size & Growth Rate
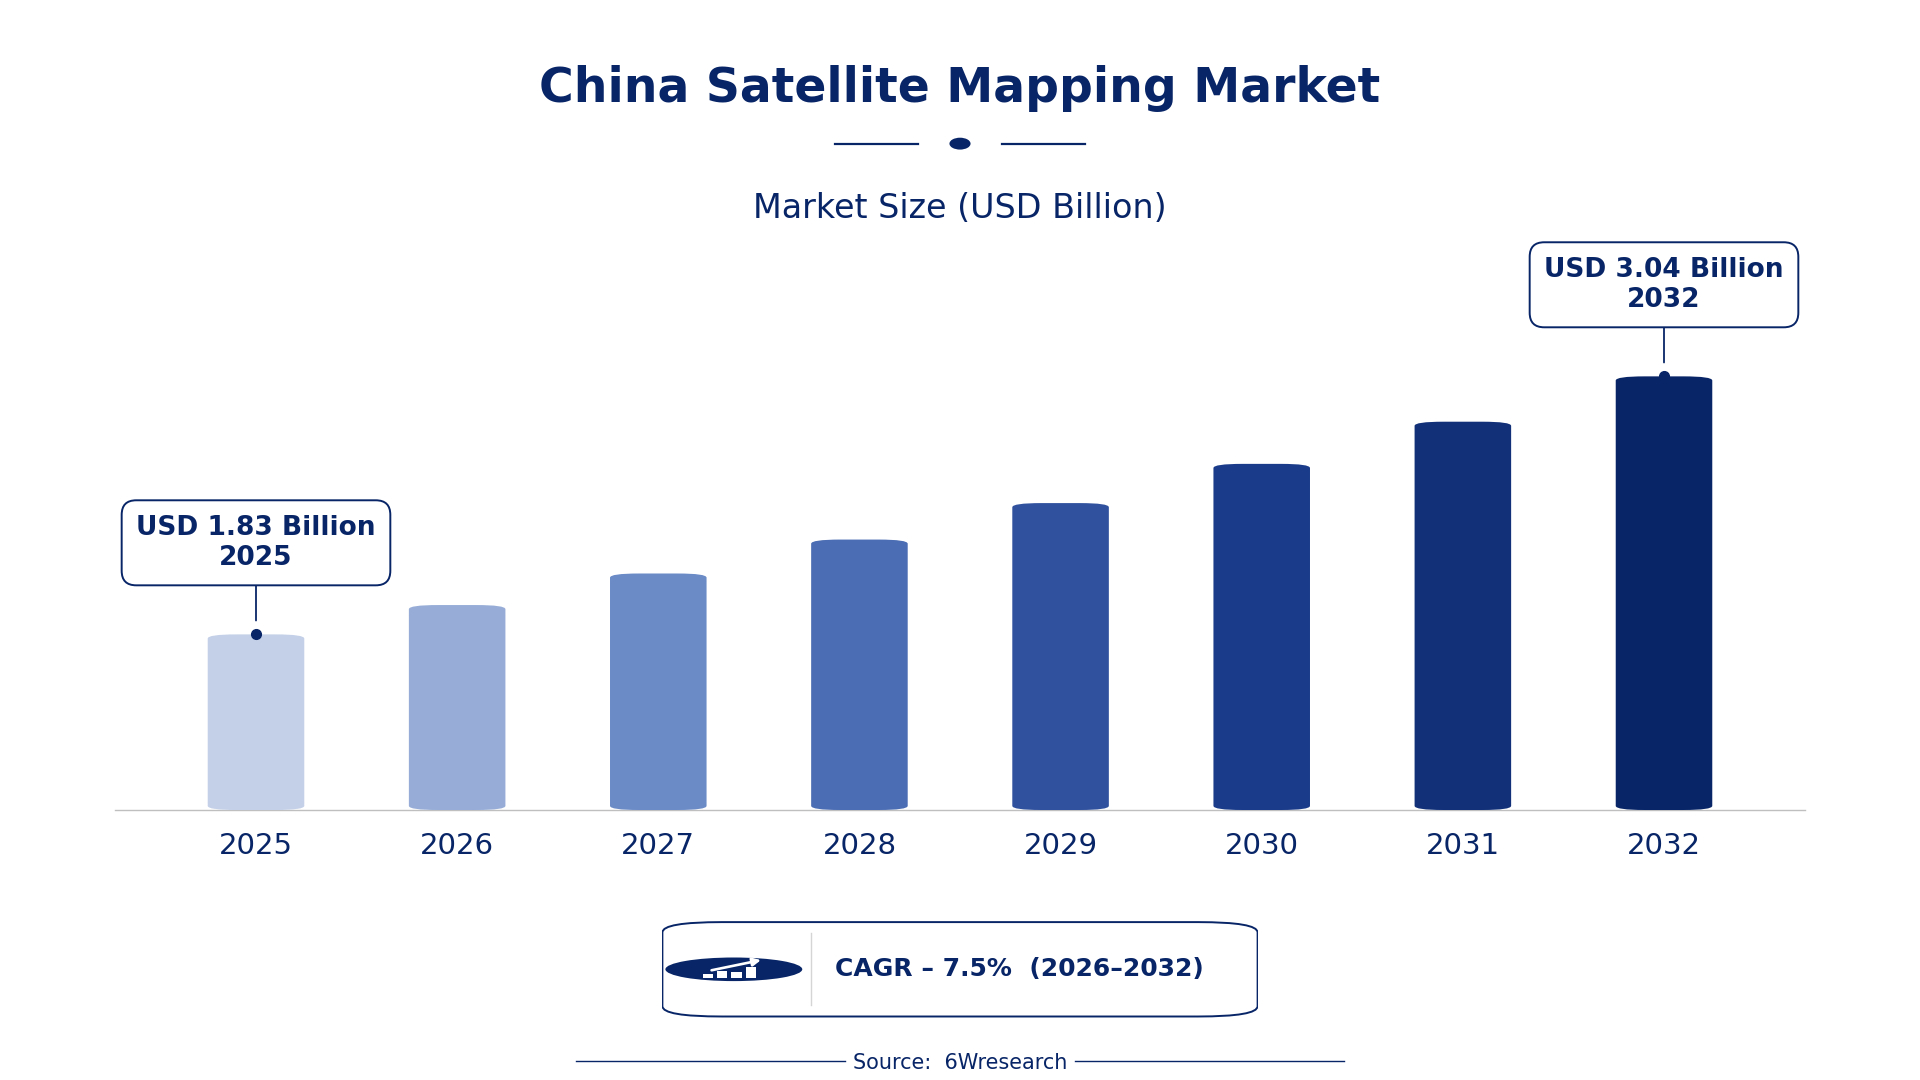
According to 6Wresearch internal database and industry insights, the China Satellite Mapping Market was valued at USD 1.83 billion in 2025 and is projected to reach USD 3.04 billion by 2032, growing at a CAGR of approximately 7.5% during 2026–2032.
China Satellite Mapping Market Highlights
| Report Metric | Details |
| Report Name | China Satellite Mapping Market |
| Market Size 2025 | USD 1.83 billion |
| Market Size 2032 | USD 3.04 billion |
| Absolute Growth 2025–2032 | USD 1.21 billion |
| CAGR 2026–2032 | 7.5% |
| Peak Annual Growth | 9.9% in 2031 |
| Forecast Period | 2026–2032 |
| Historical Data | 2022–2025 |
| Base Year | 2025 |
| Leading Mapping Type, 2025 | Topographic Mapping (41% share) |
| Leading Data Source, 2025 | Optical Imagery (43% share) |
| Leading Output Format, 2025 | Digital Elevation Maps (51% share) |
| Leading End User, 2025 | Civil Engineering Firms (51% share) |
| Fastest-Growing Mapping Type | Land Use Mapping (9.6% CAGR) |
| Fastest-Growing Data Source | Multispectral Data (9.5% CAGR) |
| Fastest-Growing Output Format | GIS Format (9.1% CAGR) |
| Fastest-Growing End User | Urban Planners (9.8% CAGR) |
| Growing Sector | Civil Engineering |
| Key End Users | Civil Engineering Firms, Urban Planners, Environmental Scientists, Mining Industry |
China Satellite Mapping Market Year-wise Growth Rate and Key Drivers (2022–2032)
This graph illustrates the annual growth rates of the market from 2022 to 2032, highlighting a steady upward trajectory and projected market expansion over the forecast period.
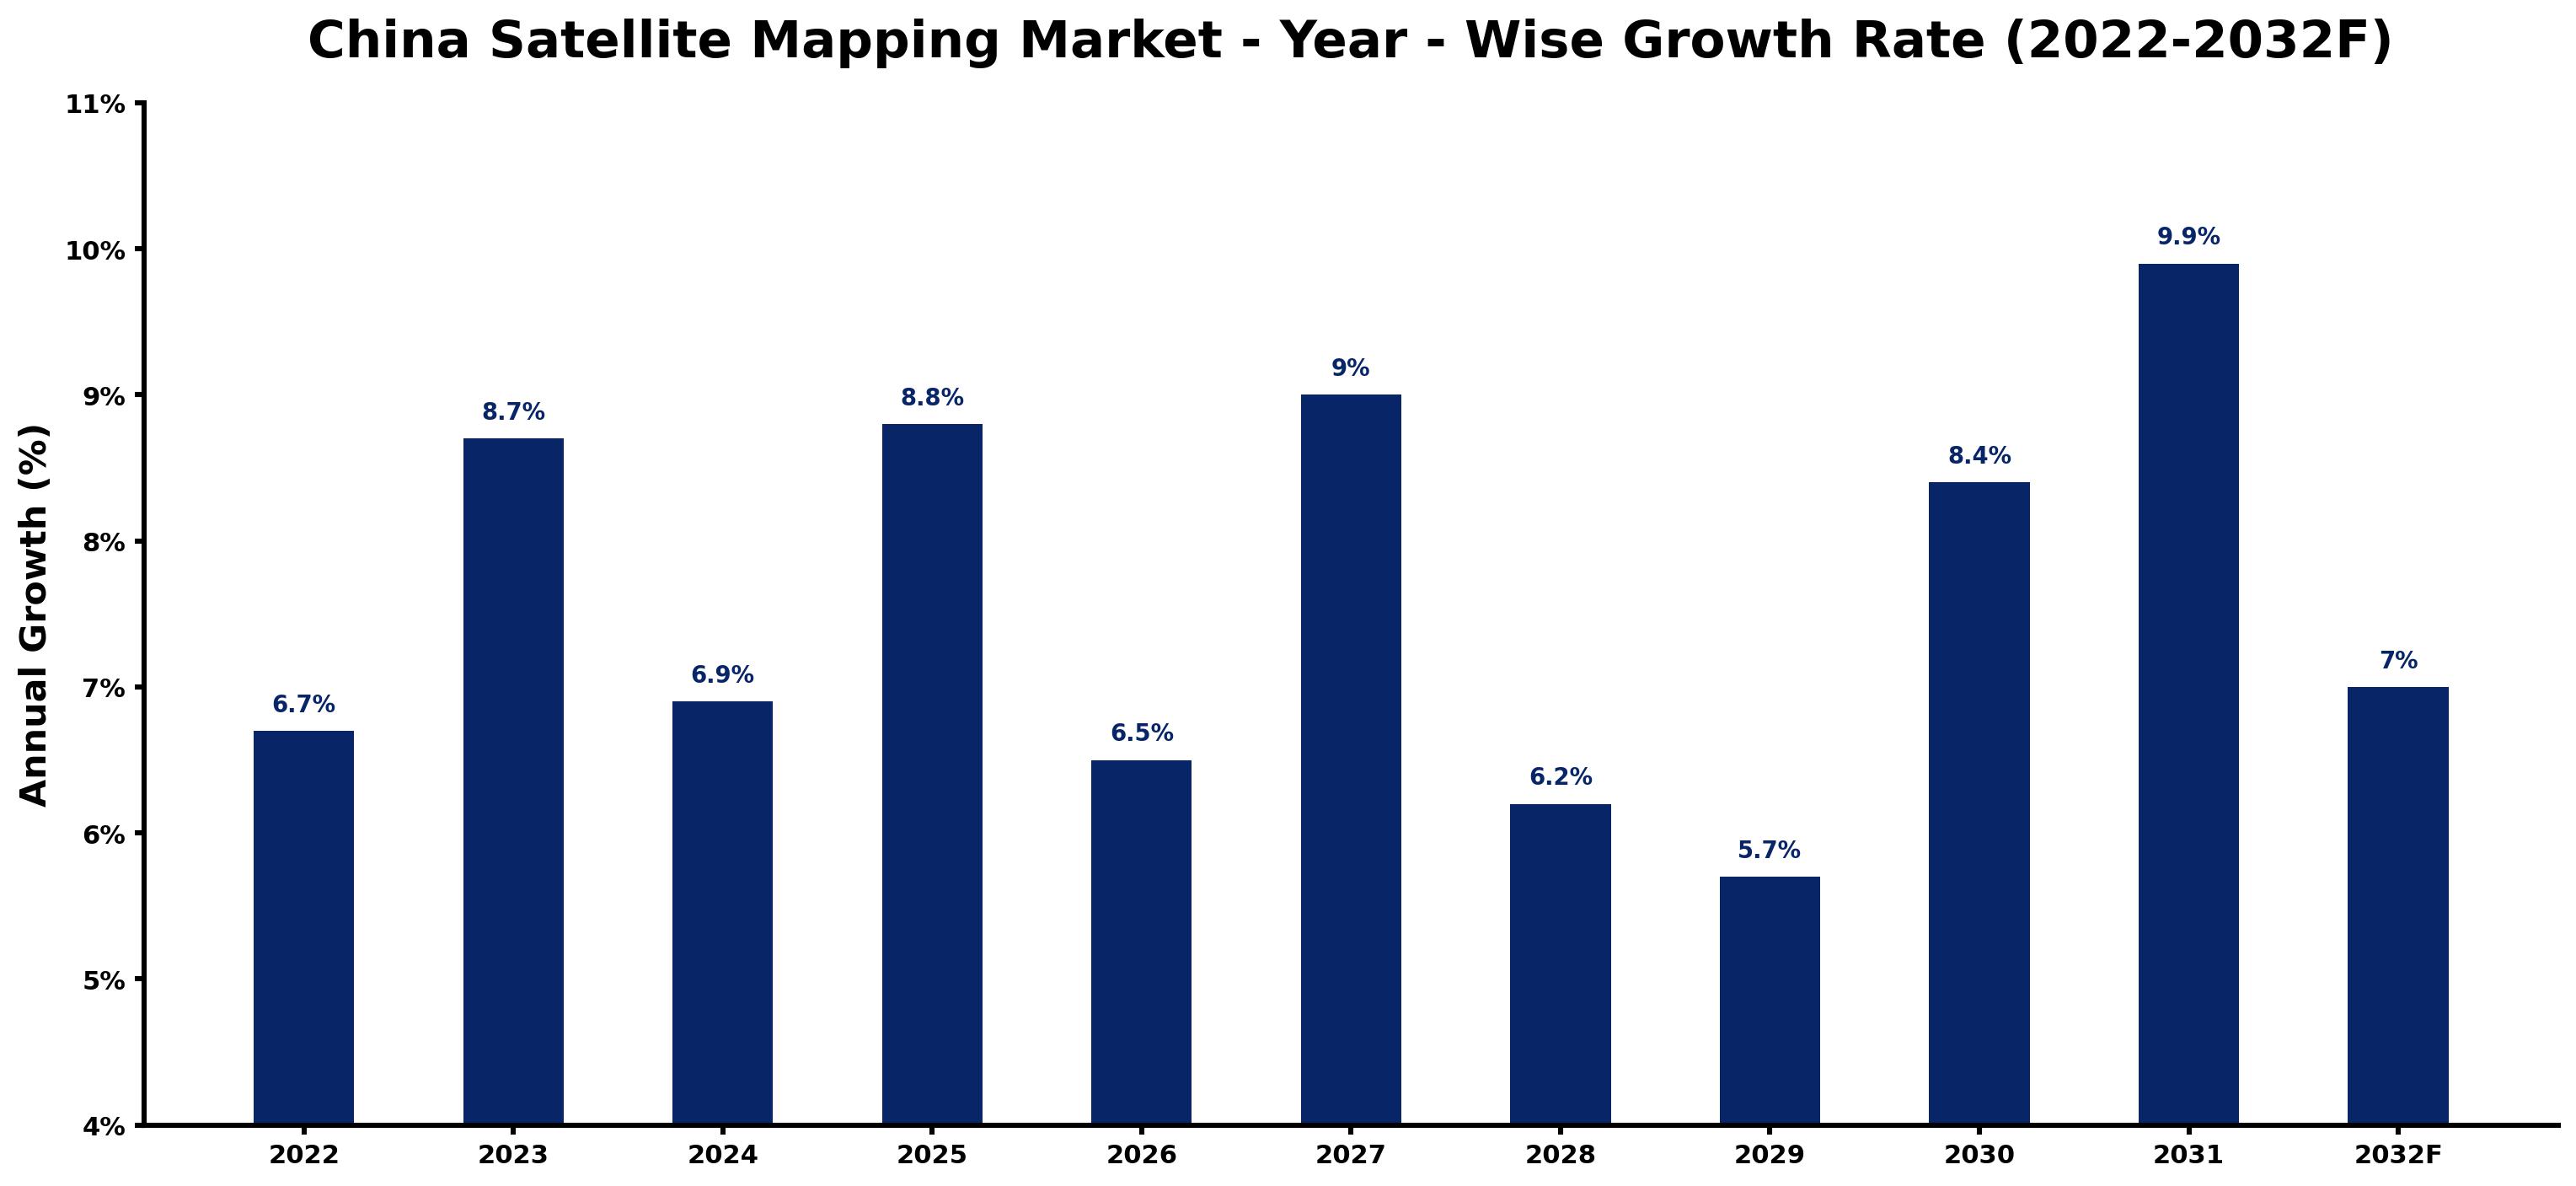
Year by year, the estimates below pair each growth rate with the development that shaped it.
| Year | Estimated Annual Growth (%) | Market Rationale |
| 2022 | 6.7 | The market experienced steady growth due to increasing urbanisation and infrastructure projects. |
| 2023 | 8.7 | Demand accelerated as urban planners and civil engineering firms sought advanced mapping solutions. |
| 2024 | 6.9 | Growth slowed slightly as some projects faced delays in funding and approvals. |
| 2025 | 8.8 | A surge in demand was driven by the implementation of the National Land Use Planning Program. |
| 2026 | 6.5 | Growth is expected to decelerate as the market adjusts to the completion of several major projects. |
| 2027 | 9.0 | Demand is projected to rebound with new initiatives in urban management and infrastructure development. |
| 2028 | 6.2 | A slowdown is anticipated as the market stabilises after rapid expansions in previous years. |
| 2029 | 5.7 | Growth is expected to continue slowing as the market matures and competition intensifies. |
| 2030 | 8.4 | Demand is projected to increase again as new technologies and standards are adopted in mapping. |
| 2031 | 9.9 | The market is expected to peak with substantial investments in satellite mapping technologies and applications. |
| 2032 | 7.0 | Growth is projected to slow as the market begins to stabilise after reaching its peak. |
Note: Market size estimations and growth projections presented in this report are based on 6Wresearch's proprietary forecasting methodology, utilizing the latest available industry data, government publications, and primary research inputs.
China Satellite Mapping Market Synopsis
The China Satellite Mapping Market involves utilising satellite imagery to produce accurate maps of the Earth's surface. This technology relies on data collected from satellites equipped with various sensors. Demand is rising among urban planners, civil engineering firms, and government projects. Key initiatives like the National Land Use Planning program and the China Geospatial Industry Development Plan are driving this demand, integrating satellite mapping into urban management and resource planning.
Market Dynamics Impact Analysis (2026–2032)
| Factor | Type | Impact | Primary Segment Affected |
| Rising demand from civil engineering firms for accurate mapping solutions | Driver | High | Civil Engineering Firms |
| Increased government investment in urban planning initiatives | Driver | High | Urban Planners |
| Growing need for land use data in urban development projects | Opportunity | High | Land Use Mapping |
| Expansion of geospatial analytics in the mining sector | Opportunity | Medium | Geospatial Analytics |
| Limited access to satellite data for smaller firms | Restraint | High | Optical Imagery |
| High costs associated with satellite mapping technology implementation | Restraint | Medium | Digital Elevation Maps |
| Challenges in data integration from various satellite sources | Challenge | High | Geospatial Analytics |
| Regulatory hurdles in obtaining necessary approvals for projects | Challenge | Medium | Land Use Mapping |
Evaluation of Drivers in China Satellite Mapping Market (2026–2032)
The factors lifting demand, and the evidence behind each, are summarised below.
| Drivers | Primary Segment Affected | Why It Matters (Evidence) |
| Increasing urbanisation driving demand for detailed mapping | Topographic Mapping | As urban areas expand, accurate topographic maps are essential for planning and development. |
| Government initiatives promoting satellite mapping integration | Land Use Mapping | The National Land Use Planning program drives the need for precise land use data, enhancing urban planning efforts. |
| Rising investments in environmental monitoring technologies | Climate Mapping | The growing focus on climate change necessitates accurate climate mapping data for policy-making. |
| Adoption of geospatial analytics in resource management | Geospatial Analytics | The mining sector's increasing reliance on data analytics drives demand for satellite mapping. |
| Demand for high-resolution imagery for urban planning | Optical Imagery | Urban planners require high-quality images for effective city planning and zoning. |
Market growth in China for Satellite Mapping is driven by increasing demand from urban planners and civil engineering firms, along with heightened investment in mapping technologies. As of 2023, more than 50 satellites dedicated to Earth observation have been launched, enhancing data availability. The mining sector has experienced a 30% rise in the use of geospatial analytics for resource management. The integration of satellite mapping into urban management is set to improve efficiency for urban planners, leading to greater purchases of satellite mapping services.
Evaluation of Restraints in China Satellite Mapping Market
The main factors holding the market back are set out below.
| Market Restraint | Primary Segment Affected | Why It Matters (Evidence) |
| Limited access to satellite data for smaller firms | Optical Imagery | Smaller firms struggle to obtain high-quality satellite data, limiting their competitiveness in the market. |
| High costs associated with satellite mapping technology implementation | Digital Elevation Maps | The initial investment required for satellite mapping technology can deter smaller buyers from entering the market. |
| Dependence on government funding for major projects | Civil Engineering Firms | Many civil engineering projects rely on government funding, which can be unpredictable and affect timelines. |
| Regulatory hurdles in obtaining necessary approvals for projects | Land Use Mapping | Complex approval processes can delay project initiation and increase costs for buyers. |
| Challenges in data integration from various satellite sources | Geospatial Analytics | Integrating data from multiple satellite sources complicates analysis and can slow project timelines. |
China Satellite Mapping Market Challenges
The China Satellite Mapping Market encounters several practical challenges, with cost being a primary concern. The expenses associated with satellite data acquisition have increased by 20% this year, impacting government projects and imposing budget constraints on urban planners. A shortage of skilled professionals hampers progress, as the rapid growth in demand has outpaced training, leaving research institutions struggling to find qualified personnel. Buyers face project delays due to compliance with the National Standard for Geographic Information, which can extend approval processes by up to six months. Regulatory hurdles also create friction, as evolving standards can lead to increased compliance costs, affecting suppliers' pricing strategies.
Trends in the China Satellite Mapping Market
Buyers and suppliers in the China Satellite Mapping Market are adjusting to the following trends.
- Increase in Multispectral Data Usage: The use of multispectral data has increased by 30% in agricultural monitoring, improving crop health analysis. This trend is evident in regions like the Yangtze River Delta, where farmers are adopting advanced monitoring techniques.
- Shift Towards Integrated Geospatial Solutions: China is moving towards integrated geospatial solutions that combine satellite mapping with other technologies. The Geospatial Information Industry Development Plan promotes this integration, aiming for improved urban management by 2025.
- Expansion of Climate Mapping Initiatives: Climate mapping initiatives are expanding significantly, driven by the China Environmental Protection Agency's focus on environmental monitoring. In 2023, over 1 million square kilometers were mapped for land use planning.
- Growing Demand for GIS Formats in Urban Development: The Smart City initiative is promoting the use of GIS formats in urban development projects. This trend is reflected in the increasing adoption of GIS technologies across major urban centres.
Investment Opportunities in the China Satellite Mapping Market
Some of the investment opportunities in the China Satellite Mapping Market are mentioned below.
- Rising Urbanisation Driving Mapping Needs: With urbanisation rates reaching 60% in 2023, there is a pressing need for accurate mapping solutions. Civil engineering firms are key buyers, and local partnerships can facilitate market entry.
- Investment in Environmental Monitoring Technologies: The Chinese government allocated substantial funding for environmental monitoring in 2023, creating opportunities for satellite mapping providers. Collaboration with environmental agencies can enhance service offerings.
- Growing Demand for Land Use Data: As the area mapped for land use planning exceeded 1 million square kilometres, there is a strong demand for mapping services. Urban planners are actively seeking advanced solutions to support their projects.
- Expansion of Geospatial Analytics in Mining: The mining sector is increasingly adopting geospatial analytics, with a 30% rise in usage. Companies can enter this market by providing tailored mapping solutions to mining firms.
Government Initiatives in the China Satellite Mapping Market
The 'National Remote Sensing Development Plan' approved in 2021 by the Ministry of Science and Technology improves satellite mapping capabilities, focusing on environmental monitoring. This measure builds on previous laws by integrating advanced technologies to enhance data accuracy and accessibility for producers and users alike. In 2022, the 'Geospatial Information Industry Development Plan' was launched to promote satellite mapping in urban planning, aiming to increase integration by 2025. This initiative seeks to streamline processes and improve the quality of mapping services available to urban planners.
The Ministry of Natural Resources oversees the 'National Land Use Planning Program', which funds satellite mapping initiatives for urban planners. This program ensures that local governments receive the necessary resources to implement effective land use assessments and planning strategies. In 2023, the government allocated additional funding to support satellite data accessibility for universities and research institutions, enhancing collaboration between academia and industry.
Future Insight of the China Satellite Mapping Market
The China Satellite Mapping Market will experience transformative changes by 2032, primarily driven by advancements in satellite technology. The integration of satellite mapping into urban management will be fully realised under the 'China Geospatial Industry Development Plan' by 2025, improving operational efficiency for urban planners. By 2032, the total area mapped for land use planning is projected to exceed 2 million square kilometers, providing critical data for environmental monitoring. The growing use of geospatial analytics in resource management will empower producers to make informed decisions, enhancing overall market competitiveness.
Market Segmentation Analysis
The analysis below covers each segmentation, its leading category in 2025 and its fastest-growing category through 2032.
By Mapping Type – Topographic Mapping Dominated, Land Use Mapping Expected to Grow Fastest
According to Shubham Padhi, Research Analyst at 6Wresearch, Topographic Mapping held a 41% share of the China Satellite Mapping Market by mapping type in 2025. Topographic Mapping holds the largest share as it is essential for creating detailed terrain maps that support planning and development. Its significance is particularly highlighted in large-scale construction projects, where accurate topographical data is crucial for success. Land Use Mapping is set to record the highest CAGR in this split, 9.6% over 2026–2032. Land Use Mapping is experiencing rapid growth, propelled by initiatives like the National Land Use Planning program that enhances mapping efforts. The increasing reliance of urban planners on this data is driving the demand for land use mapping services. Suppliers should focus on expanding their land use mapping capabilities to meet the rising demand from urban planners.
By Data Source – Optical Imagery Dominated, Multispectral Data Expected to Grow Fastest
In 2025, Optical Imagery led the data source split with a 43% share. Optical Imagery commands the largest share as it is vital for capturing high-resolution images necessary for accurate mapping. Its extensive application across sectors such as urban planning and environmental monitoring reinforces its leading position. The quickest growth will come from Multispectral Data, forecast to expand at a CAGR of 9.5% between 2026 and 2032. Multispectral Data is the fastest-growing segment, with a notable increase in its use for analysing land cover and vegetation health. This growth is fuelled by the rising need for precise agricultural monitoring and environmental assessments. Buyers should explore multispectral data solutions to leverage its growing importance in environmental monitoring and resource management.
By Output Format – Digital Elevation Maps Dominated, GIS Format Expected to Grow Fastest
With a 51% revenue share in 2025, Digital Elevation Maps was the largest output format category. Digital Elevation Maps lead the market due to their ability to provide 3D representations of terrain, which are crucial for civil engineering projects. Their essential role in infrastructure development solidifies their importance for engineering firms. GIS Format is projected to grow fastest, at a CAGR of 9.1% during 2026–2032. GIS Format is rapidly gaining traction owing to its widespread application for spatial data analysis and visualisation in urban planning. As urban planners increasingly adopt GIS technologies, the demand for this format is set to grow. Suppliers must ensure their GIS solutions are robust and user-friendly to cater to the increasing number of urban planners adopting this format.
By End User – Civil Engineering Firms Dominated, Urban Planners Expected to Grow Fastest
Civil Engineering Firms took a 51% share of end user in 2025, more than any other category. Civil Engineering Firms dominate the market share as they heavily rely on mapping for infrastructure development and project planning. Their ongoing need for precise mapping data reinforces their leading position in the satellite mapping market. Over 2026–2032, Urban Planners are expected to post the fastest growth, at a CAGR of 9.8%. Urban Planners represent the fastest-growing end user group, driven by the escalating demand for effective city planning and zoning. As urbanisation accelerates, the reliance on mapping services by urban planners will intensify. Suppliers should tailor their offerings to meet the specific needs of urban planners, who are becoming increasingly vital in the satellite mapping ecosystem.
Key Attractiveness of the Report
- 10 Years of Market Numbers
- Historical Data Starting from 2022 to 2025
- Base Year 2025
- Forecast Data until 2032
- Key Performance Indicators Impacting the Market
- Major Upcoming Developments and Projects
Key Highlights of the Report:
- China Satellite Mapping Market Outlook
- Market Size of China Satellite Mapping Market, 2025
- Forecast of China Satellite Mapping Market, 2032
- Historical Data and Forecast of China Satellite Mapping Revenues & Volume for the Period 2022 - 2032F
- China Satellite Mapping Market Trend Evolution
- China Satellite Mapping Market Drivers and Challenges
- China Satellite Mapping Price Trends
- China Satellite Mapping Porter's Five Forces
- China Satellite Mapping Industry Life Cycle
- Historical Data and Forecast of China Satellite Mapping Market Revenues & Volume By Mapping Type for the Period 2022 - 2032F
- Historical Data and Forecast of China Satellite Mapping Market Revenues & Volume By Topographic Mapping for the Period 2022 - 2032F
- Historical Data and Forecast of China Satellite Mapping Market Revenues & Volume By Land Use Mapping for the Period 2022 - 2032F
- Historical Data and Forecast of China Satellite Mapping Market Revenues & Volume By Geospatial Analytics for the Period 2022 - 2032F
- Historical Data and Forecast of China Satellite Mapping Market Revenues & Volume By Climate Mapping for the Period 2022 - 2032F
- Historical Data and Forecast of China Satellite Mapping Market Revenues & Volume By Data Source for the Period 2022 - 2032F
- Historical Data and Forecast of China Satellite Mapping Market Revenues & Volume By Optical Imagery for the Period 2022 - 2032F
- Historical Data and Forecast of China Satellite Mapping Market Revenues & Volume By Multispectral Data for the Period 2022 - 2032F
- Historical Data and Forecast of China Satellite Mapping Market Revenues & Volume By SAR + Optical for the Period 2022 - 2032F
- Historical Data and Forecast of China Satellite Mapping Market Revenues & Volume By Hyperspectral for the Period 2022 - 2032F
- Historical Data and Forecast of China Satellite Mapping Market Revenues & Volume By Output Format for the Period 2022 - 2032F
- Historical Data and Forecast of China Satellite Mapping Market Revenues & Volume By Digital Elevation Maps for the Period 2022 - 2032F
- Historical Data and Forecast of China Satellite Mapping Market Revenues & Volume By GIS Format for the Period 2022 - 2032F
- Historical Data and Forecast of China Satellite Mapping Market Revenues & Volume By Analytical Reports for the Period 2022 - 2032F
- Historical Data and Forecast of China Satellite Mapping Market Revenues & Volume By Satellite Models for the Period 2022 - 2032F
- Historical Data and Forecast of China Satellite Mapping Market Revenues & Volume By End User for the Period 2022 - 2032F
- Historical Data and Forecast of China Satellite Mapping Market Revenues & Volume By Civil Engineering Firms for the Period 2022 - 2032F
- Historical Data and Forecast of China Satellite Mapping Market Revenues & Volume By Urban Planners for the Period 2022 - 2032F
- Historical Data and Forecast of China Satellite Mapping Market Revenues & Volume By Mining Industry for the Period 2022 - 2032F
- Historical Data and Forecast of China Satellite Mapping Market Revenues & Volume By Environmental Scientists for the Period 2022 - 2032F
- China Satellite Mapping Import Export Trade Statistics
- Market Opportunity Assessment By Mapping Type
- Market Opportunity Assessment By Data Source
- Market Opportunity Assessment By Output Format
- Market Opportunity Assessment By End User
- China Satellite Mapping Top Companies Market Share
- China Satellite Mapping Competitive Benchmarking By Technical and Operational Parameters
- China Satellite Mapping Company Profiles
- China Satellite Mapping Key Strategic Recommendations
Market Covered
The report offers an extensive study of the following market segments.
By Mapping Type
- Topographic Mapping
- Land Use Mapping
- Geospatial Analytics
- Climate Mapping
By Data Source
- Optical Imagery
- Multispectral Data
- SAR + Optical
- Hyperspectral
By Output Format
- Digital Elevation Maps
- GIS Format
- Analytical Reports
- Satellite Models
By End User
- Civil Engineering Firms
- Urban Planners
- Mining Industry
- Environmental Scientists































