Croatia Control Valves Market (2026-2032) | Trends, Supply, Pricing Analysis, Share, Segments, Drivers, Investment Trends, Forecast, Growth, Consumer Insights, Analysis, Size, Strategy, Restraints, Outlook, Industry, Challenges, Competitive, Companies, Revenue, Segmentation, Value, Demand, Competition, Strategic Insights, Opportunities
Market Forecast By Product Type (Ball Valves, Globe Valves, Gate Valves, Butterfly Valves), By Valve Type (Manual Control, Automatic Control, Pneumatic Control, Electric Control), By Application Area (Oil & Gas, Chemical Processing, Water Treatment, HVAC Systems), By End User (Industrial Plants, Petrochemical Industry, Municipal Utilities, Commercial Buildings) And Competitive Landscape
| Product Code: ETC10540757 | Publication Date: Apr 2025 | Updated Date: Apr 2026 | Product Type: Market Research Report | |
| Publisher: 6Wresearch | Author: Bhawna Singh | No. of Pages: 65 | No. of Figures: 34 | No. of Tables: 19 |
Croatia Control Valves Market Size (2020-2030)
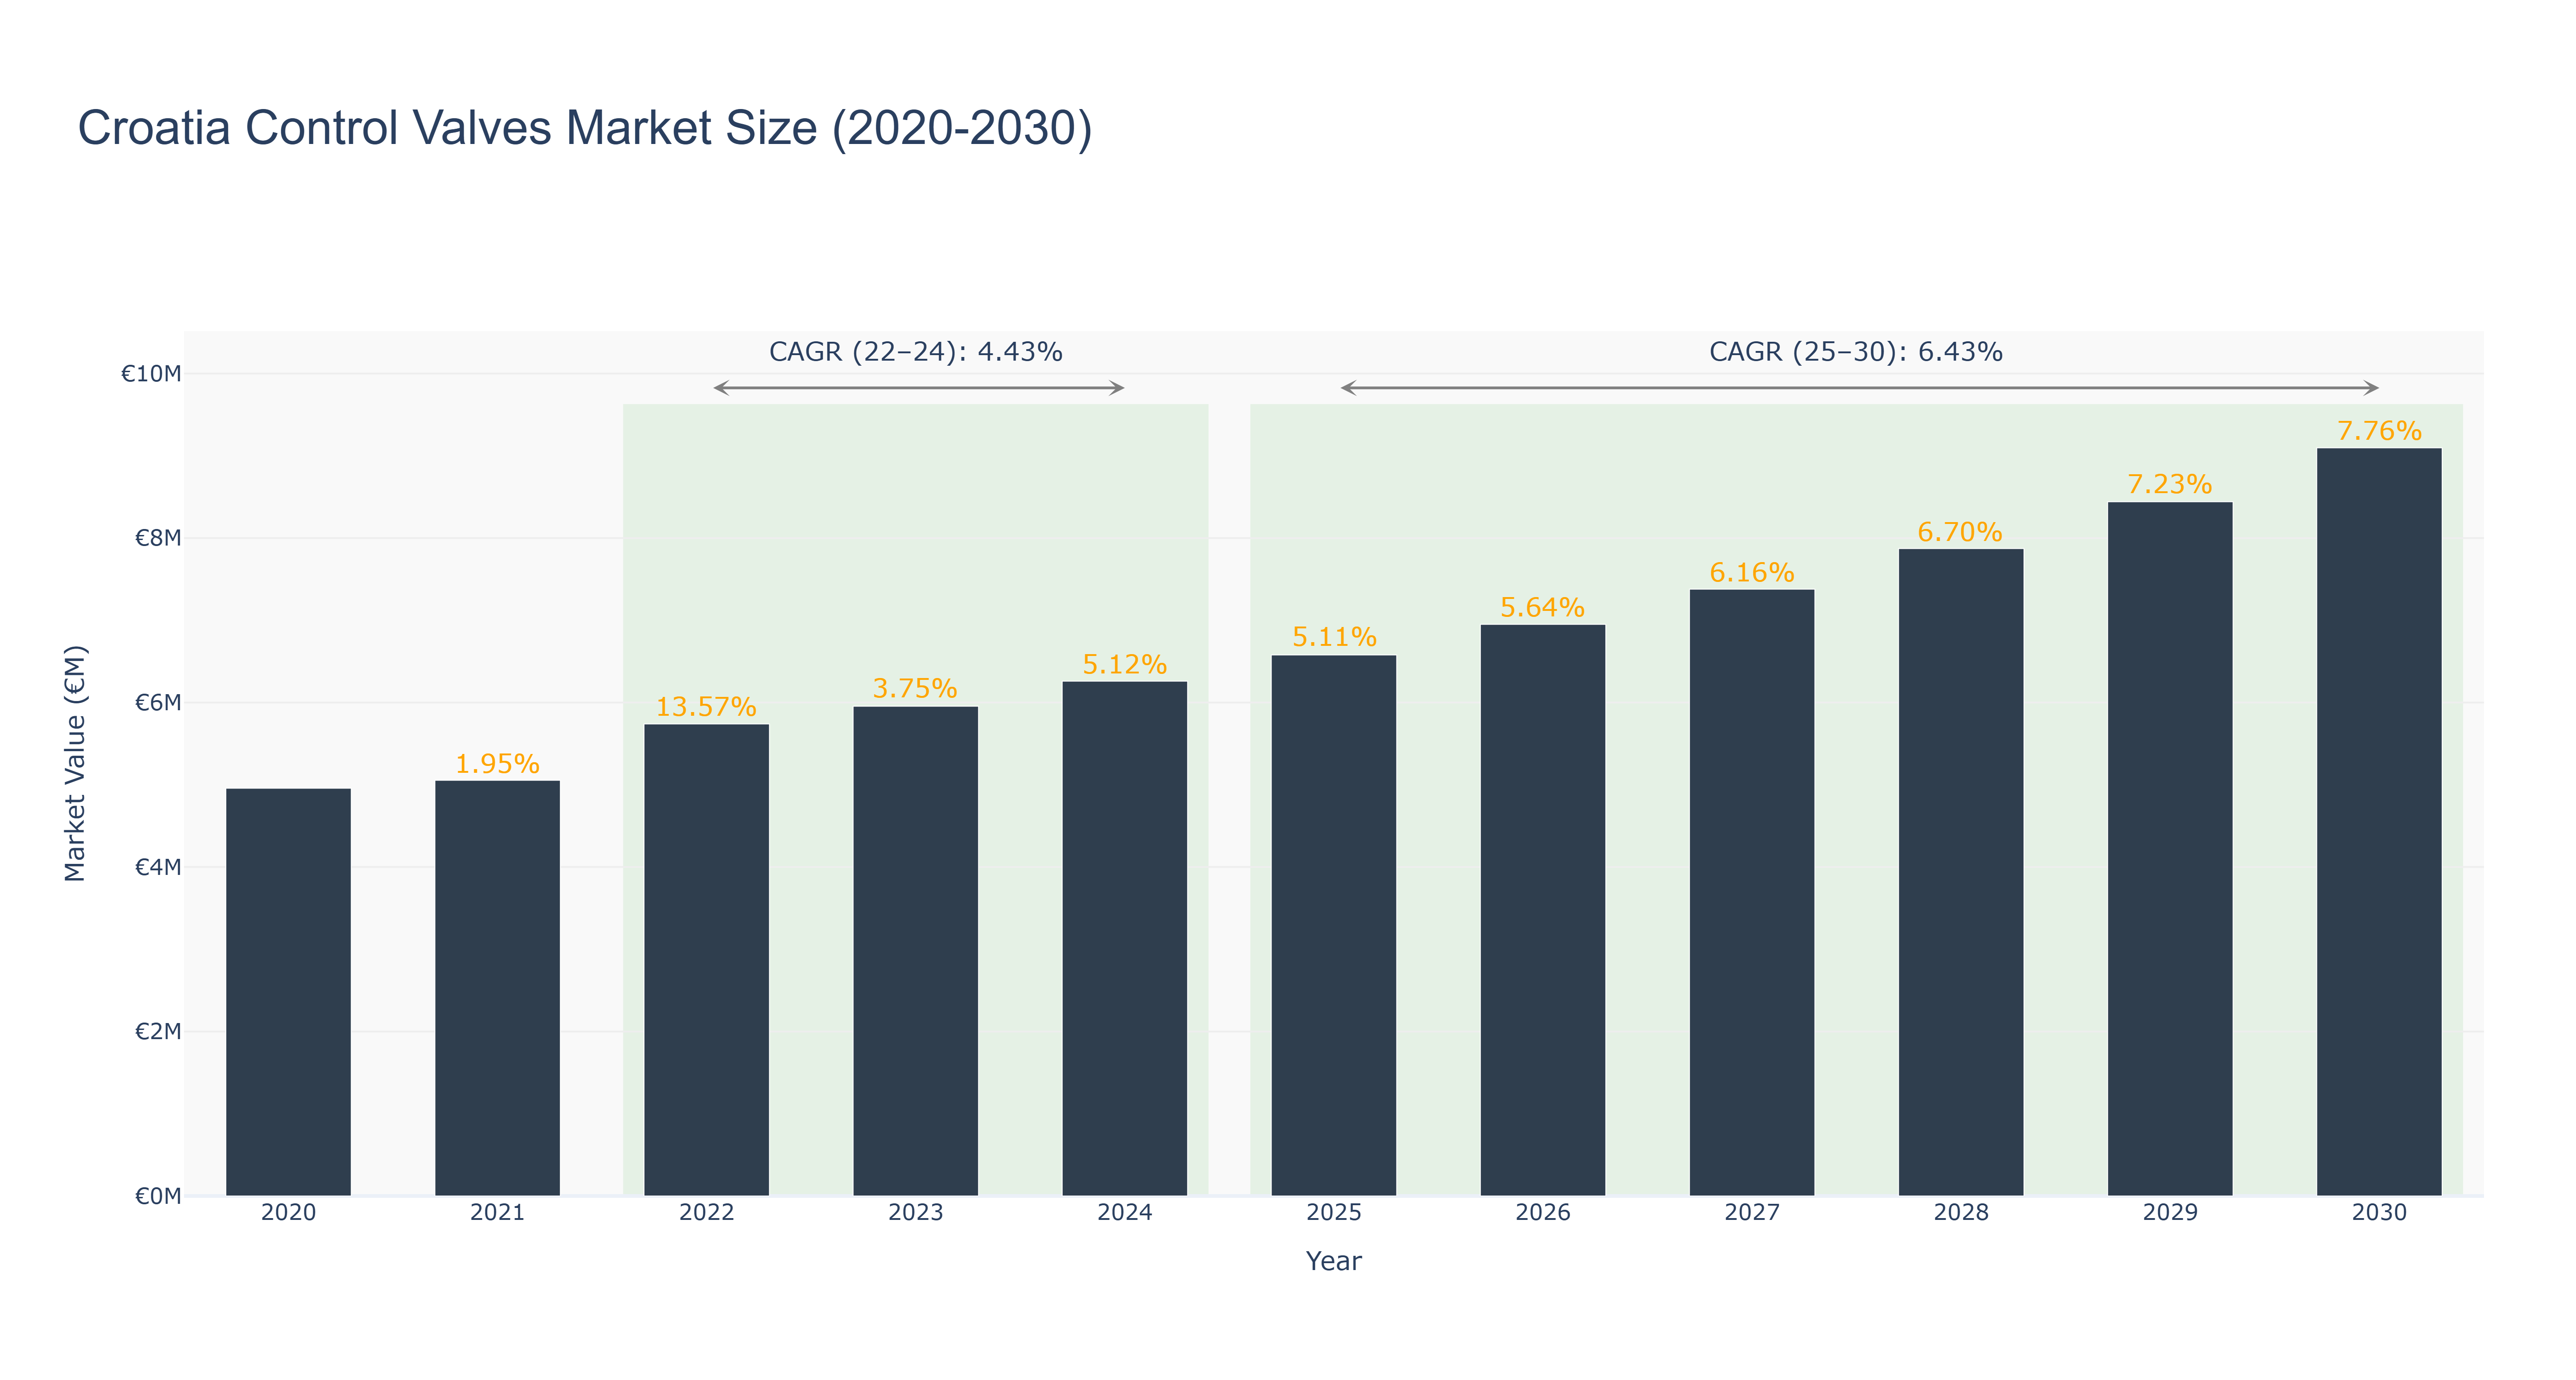
Croatia Control Valves Market has shown a steady growth trajectory over the years. The peak market size of €9.10 million is forecasted for 2030, with a CAGR of 6.43% from 2025 to 2030. The market size has increased from €4.96 million in 2020 to €6.26 million in 2024, showcasing a consistent upward trend. The CAGR from 2022 to 2024 is 4.43%. The market's growth can be attributed to increasing industrial automation and the need for efficient control systems in various sectors. Looking ahead, Croatia is set to implement a national infrastructure development plan that includes upgrading key manufacturing facilities, which is expected to drive further demand for control valves in the country.
Croatia Control Valves Market: Production & Trade Performance (2019-2025)
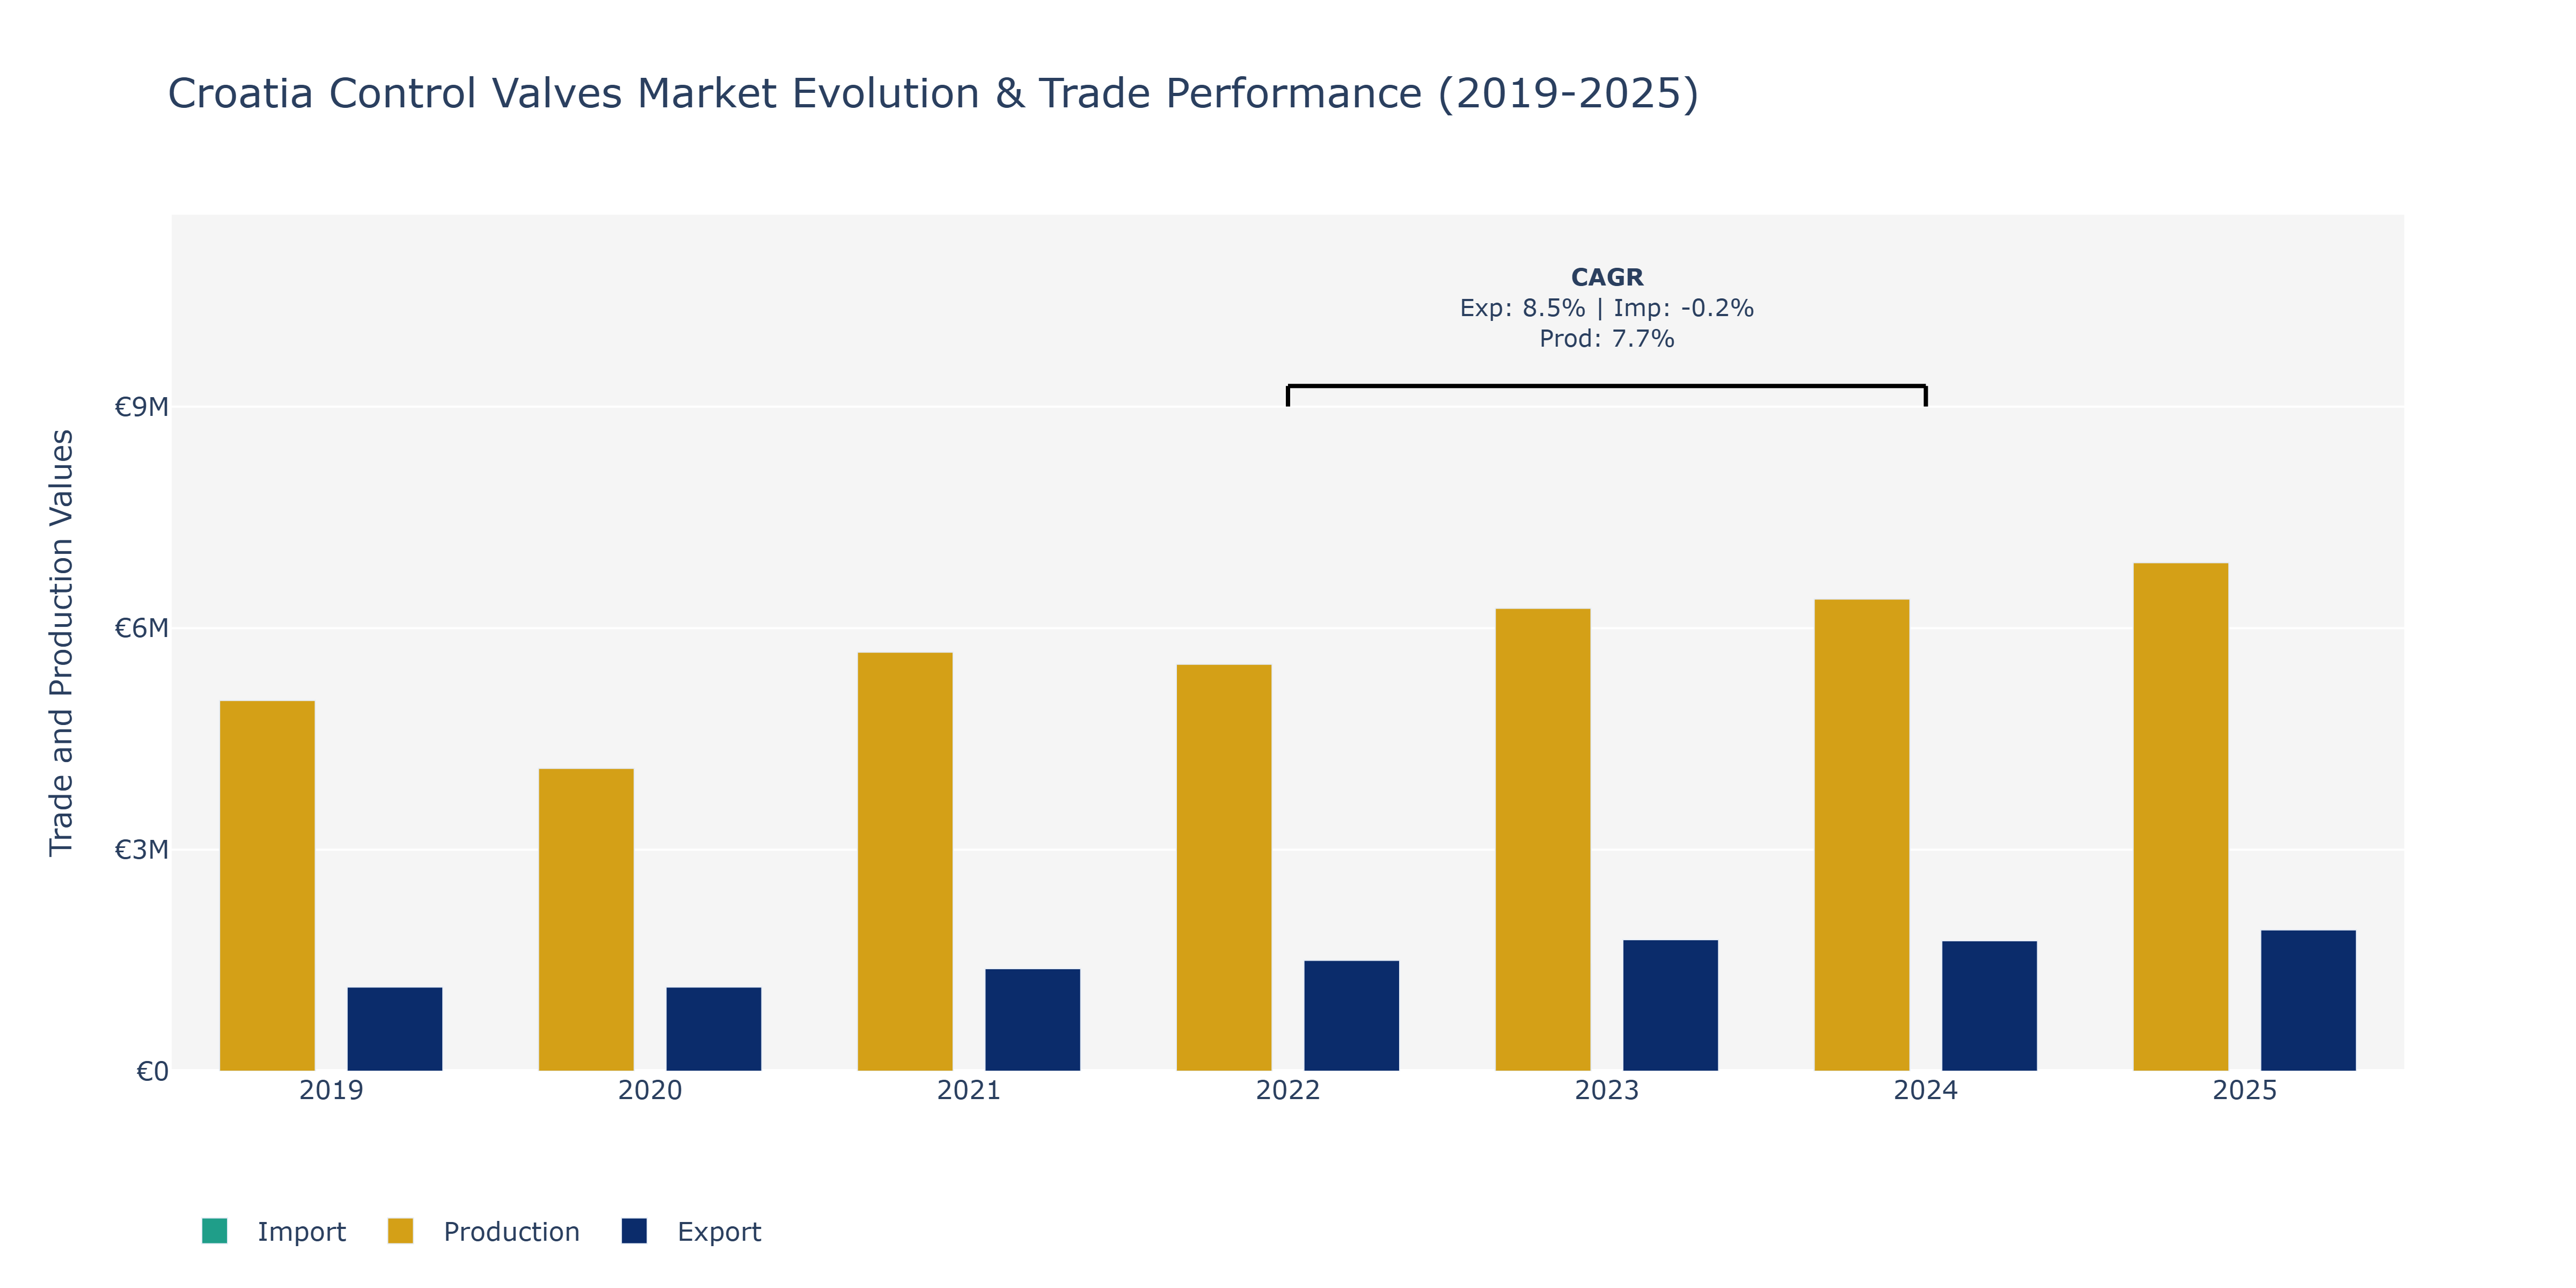
In the Croatia Control Valves Market, exports showed a consistent growth trajectory from 2019 to 2025, reaching €1.91 million. The year 2023 marked a substantial increase in exports, reflecting a growing demand for Croatian control valves in international markets. In contrast, imports fluctuated over the years, with a notable decline in 2020 followed by a gradual increase. Production exhibited a steady rise, peaking in 2025 at €6.89 million. The significant growth in production can be attributed to the market's response to increasing demand for control valves globally, coupled with continuous technological advancements in the industry driving efficiency and quality. The fluctuations in imports could be influenced by factors like changes in global trade policies impacting import volumes. To sustain growth, market players should focus on innovation and quality to remain competitive in the international market.
Key Highlights of the Report:
- Croatia Control Valves Market Outlook
- Market Size of Croatia Control Valves Market, 2025
- Forecast of Croatia Control Valves Market, 2032
- Historical Data and Forecast of Croatia Control Valves Revenues & Volume for the Period 2022 - 2032F
- Croatia Control Valves Market Trend Evolution
- Croatia Control Valves Market Drivers and Challenges
- Croatia Control Valves Price Trends
- Croatia Control Valves Porter's Five Forces
- Croatia Control Valves Industry Life Cycle
- Historical Data and Forecast of Croatia Control Valves Market Revenues & Volume By Product Type for the Period 2022 - 2032F
- Historical Data and Forecast of Croatia Control Valves Market Revenues & Volume By Ball Valves for the Period 2022 - 2032F
- Historical Data and Forecast of Croatia Control Valves Market Revenues & Volume By Globe Valves for the Period 2022 - 2032F
- Historical Data and Forecast of Croatia Control Valves Market Revenues & Volume By Gate Valves for the Period 2022 - 2032F
- Historical Data and Forecast of Croatia Control Valves Market Revenues & Volume By Butterfly Valves for the Period 2022 - 2032F
- Historical Data and Forecast of Croatia Control Valves Market Revenues & Volume By Valve Type for the Period 2022 - 2032F
- Historical Data and Forecast of Croatia Control Valves Market Revenues & Volume By Manual Control for the Period 2022 - 2032F
- Historical Data and Forecast of Croatia Control Valves Market Revenues & Volume By Automatic Control for the Period 2022 - 2032F
- Historical Data and Forecast of Croatia Control Valves Market Revenues & Volume By Pneumatic Control for the Period 2022 - 2032F
- Historical Data and Forecast of Croatia Control Valves Market Revenues & Volume By Electric Control for the Period 2022 - 2032F
- Historical Data and Forecast of Croatia Control Valves Market Revenues & Volume By Application Area for the Period 2022 - 2032F
- Historical Data and Forecast of Croatia Control Valves Market Revenues & Volume By Oil & Gas for the Period 2022 - 2032F
- Historical Data and Forecast of Croatia Control Valves Market Revenues & Volume By Chemical Processing for the Period 2022 - 2032F
- Historical Data and Forecast of Croatia Control Valves Market Revenues & Volume By Water Treatment for the Period 2022 - 2032F
- Historical Data and Forecast of Croatia Control Valves Market Revenues & Volume By HVAC Systems for the Period 2022 - 2032F
- Historical Data and Forecast of Croatia Control Valves Market Revenues & Volume By End User for the Period 2022 - 2032F
- Historical Data and Forecast of Croatia Control Valves Market Revenues & Volume By Industrial Plants for the Period 2022 - 2032F
- Historical Data and Forecast of Croatia Control Valves Market Revenues & Volume By Petrochemical Industry for the Period 2022 - 2032F
- Historical Data and Forecast of Croatia Control Valves Market Revenues & Volume By Municipal Utilities for the Period 2022 - 2032F
- Historical Data and Forecast of Croatia Control Valves Market Revenues & Volume By Commercial Buildings for the Period 2022 - 2032F
- Croatia Control Valves Import Export Trade Statistics
- Market Opportunity Assessment By Product Type
- Market Opportunity Assessment By Valve Type
- Market Opportunity Assessment By Application Area
- Market Opportunity Assessment By End User
- Croatia Control Valves Top Companies Market Share
- Croatia Control Valves Competitive Benchmarking By Technical and Operational Parameters
- Croatia Control Valves Company Profiles
- Croatia Control Valves Key Strategic Recommendations
Frequently Asked Questions About the Market Study (FAQs):
6Wresearch actively monitors the Croatia Control Valves Market and publishes its comprehensive annual report, highlighting emerging trends, growth drivers, revenue analysis, and forecast outlook. Our insights help businesses to make data-backed strategic decisions with ongoing market dynamics. Our analysts track relevent industries related to the Croatia Control Valves Market, allowing our clients with actionable intelligence and reliable forecasts tailored to emerging regional needs.
Yes, we provide customisation as per your requirements. To learn more, feel free to contact us on sales@6wresearch.com
1 Executive Summary |
2 Introduction |
2.1 Key Highlights of the Report |
2.2 Report Description |
2.3 Market Scope & Segmentation |
2.4 Research Methodology |
2.5 Assumptions |
3 Croatia Control Valves Market Overview |
3.1 Croatia Country Macro Economic Indicators |
3.2 Croatia Control Valves Market Revenues & Volume, 2022 & 2032F |
3.3 Croatia Control Valves Market - Industry Life Cycle |
3.4 Croatia Control Valves Market - Porter's Five Forces |
3.5 Croatia Control Valves Market Revenues & Volume Share, By Product Type, 2022 & 2032F |
3.6 Croatia Control Valves Market Revenues & Volume Share, By Valve Type, 2022 & 2032F |
3.7 Croatia Control Valves Market Revenues & Volume Share, By Application Area, 2022 & 2032F |
3.8 Croatia Control Valves Market Revenues & Volume Share, By End User, 2022 & 2032F |
4 Croatia Control Valves Market Dynamics |
4.1 Impact Analysis |
4.2 Market Drivers |
4.2.1 Increasing industrialization and automation in Croatia leading to higher demand for control valves |
4.2.2 Growing focus on energy efficiency and sustainability driving the adoption of advanced control valve technologies |
4.2.3 Government initiatives and regulations promoting the use of control valves in various industries |
4.3 Market Restraints |
4.3.1 High initial investment required for installing control valves may limit adoption, especially among small and medium enterprises |
4.3.2 Lack of skilled workforce for maintenance and operation of control valves |
4.3.3 Economic uncertainties impacting investment decisions in industries using control valves |
5 Croatia Control Valves Market Trends |
6 Croatia Control Valves Market, By Types |
6.1 Croatia Control Valves Market, By Product Type |
6.1.1 Overview and Analysis |
6.1.2 Croatia Control Valves Market Revenues & Volume, By Product Type, 2022 - 2032F |
6.1.3 Croatia Control Valves Market Revenues & Volume, By Ball Valves, 2022 - 2032F |
6.1.4 Croatia Control Valves Market Revenues & Volume, By Globe Valves, 2022 - 2032F |
6.1.5 Croatia Control Valves Market Revenues & Volume, By Gate Valves, 2022 - 2032F |
6.1.6 Croatia Control Valves Market Revenues & Volume, By Butterfly Valves, 2022 - 2032F |
6.2 Croatia Control Valves Market, By Valve Type |
6.2.1 Overview and Analysis |
6.2.2 Croatia Control Valves Market Revenues & Volume, By Manual Control, 2022 - 2032F |
6.2.3 Croatia Control Valves Market Revenues & Volume, By Automatic Control, 2022 - 2032F |
6.2.4 Croatia Control Valves Market Revenues & Volume, By Pneumatic Control, 2022 - 2032F |
6.2.5 Croatia Control Valves Market Revenues & Volume, By Electric Control, 2022 - 2032F |
6.3 Croatia Control Valves Market, By Application Area |
6.3.1 Overview and Analysis |
6.3.2 Croatia Control Valves Market Revenues & Volume, By Oil & Gas, 2022 - 2032F |
6.3.3 Croatia Control Valves Market Revenues & Volume, By Chemical Processing, 2022 - 2032F |
6.3.4 Croatia Control Valves Market Revenues & Volume, By Water Treatment, 2022 - 2032F |
6.3.5 Croatia Control Valves Market Revenues & Volume, By HVAC Systems, 2022 - 2032F |
6.4 Croatia Control Valves Market, By End User |
6.4.1 Overview and Analysis |
6.4.2 Croatia Control Valves Market Revenues & Volume, By Industrial Plants, 2022 - 2032F |
6.4.3 Croatia Control Valves Market Revenues & Volume, By Petrochemical Industry, 2022 - 2032F |
6.4.4 Croatia Control Valves Market Revenues & Volume, By Municipal Utilities, 2022 - 2032F |
6.4.5 Croatia Control Valves Market Revenues & Volume, By Commercial Buildings, 2022 - 2032F |
7 Croatia Control Valves Market Import-Export Trade Statistics |
7.1 Croatia Control Valves Market Export to Major Countries |
7.2 Croatia Control Valves Market Imports from Major Countries |
8 Croatia Control Valves Market Key Performance Indicators |
8.1 Energy savings achieved through the use of control valves |
8.2 Number of new industrial projects incorporating control valves |
8.3 Rate of adoption of smart control valve technologies |
8.4 Maintenance and downtime costs reduction attributed to control valve usage |
8.5 Improvement in process efficiency and productivity due to control valve optimization |
9 Croatia Control Valves Market - Opportunity Assessment |
9.1 Croatia Control Valves Market Opportunity Assessment, By Product Type, 2022 & 2032F |
9.2 Croatia Control Valves Market Opportunity Assessment, By Valve Type, 2022 & 2032F |
9.3 Croatia Control Valves Market Opportunity Assessment, By Application Area, 2022 & 2032F |
9.4 Croatia Control Valves Market Opportunity Assessment, By End User, 2022 & 2032F |
10 Croatia Control Valves Market - Competitive Landscape |
10.1 Croatia Control Valves Market Revenue Share, By Companies, 2025 |
10.2 Croatia Control Valves Market Competitive Benchmarking, By Operating and Technical Parameters |
11 Company Profiles |
12 Recommendations |
13 Disclaimer |
Global Go To Market Strategy - 2030
Export potential enables firms to identify high-growth global markets with greater confidence by combining advanced trade intelligence with a structured quantitative methodology. The framework analyzes emerging demand trends and country-level import patterns while integrating macroeconomic and trade datasets such as GDP and population forecasts, bilateral import–export flows, tariff structures, elasticity differentials between developed and developing economies, geographic distance, and import demand projections. Using weighted trade values from 2020–2024 as the base period to project country-to-country export potential for 2030, these inputs are operationalized through calculated drivers such as gravity model parameters, tariff impact factors, and projected GDP per-capita growth. Through an analysis of hidden potentials, demand hotspots, and market conditions that are most favorable to success, this method enables firms to focus on target countries, maximize returns, and global expansion with data, backed by accuracy.
By factoring in the projected importer demand gap that is currently unmet and could be potential opportunity, it identifies the potential for the Exporter (Country) among 190 countries, against the general trade analysis, which identifies the biggest importer or exporter.
To discover high-growth global markets and optimize your business strategy:
Click Here
Pricing
- Single User License$ 1,995
- Department License$ 2,400
- Site License$ 3,120
- Global License$ 3,795

Leadership Perspectives from Industry Events
Search
Thought Leadership and Analyst Meet


Our Clients
6WResearch In News
- India Air Conditioner Market Set for Strong Rebound in 2026 After Weather-Led Correction and GST-Driven Recovery: 6Wresearch
- ADAS in India: How Automatic Emergency Braking, Blind Spot Detection & Driver Monitoring are Transforming Road Safety
- Doha a strategic location for EV manufacturing hub: IPA Qatar
- Demand for luxury TVs surging in the GCC, says Samsung
- Empowering Growth: The Thriving Journey of Bangladesh’s Cable Industry
- Demand for luxury TVs surging in the GCC, says Samsung
Latest Reports
- Poland Fire Protection Systems Market (2026-2032)
- Cape Verde Portable Hand-Thrown Extinguisher Market (2026-2032)
- Canada Portable Hand-Thrown Extinguisher Market (2026-2032)
- Cameroon Portable Hand-Thrown Extinguisher Market (2026-2032)
- Burundi Portable Hand-Thrown Extinguisher Market (2026-2032)
- Burkina Faso Portable Hand-Thrown Extinguisher Market (2026-2032)
- Bulgaria Portable Hand-Thrown Extinguisher Market (2026-2032)
- Brunei Portable Hand-Thrown Extinguisher Market (2026-2032)
- Botswana Portable Hand-Thrown Extinguisher Market (2026-2032)
- Bosnia and Herzegovina Portable Hand-Thrown Extinguisher Market (2026-2032)
Industry Events and Analyst Meet

HIMTEX 2026

India Refining Summit 2026

India EV Show 2026

EV tech India Expo 2026

Auto Tech Asia 2026
Whitepaper
- Middle East & Africa Commercial Security Market Click here to view more.
- Middle East & Africa Fire Safety Systems & Equipment Market Click here to view more.
- GCC Drone Market Click here to view more.
- Middle East Lighting Fixture Market Click here to view more.
- GCC Physical & Perimeter Security Market Click here to view more.