Georgia Borax Market (2026-2032) Outlook | Revenue, Value, Trends, Share, Industry, Forecast, Analysis, Companies, Growth & Size
Market Forecast By Types (Anhydrous Borax, Borax Pentahydrate, Borax Decahydrate), By Applications (Agriculture, Transportation, Building and Construction, Detergents, Healthcare, Electronics, Others) And Competitive Landscape
| Product Code: ETC192852 | Publication Date: May 2022 | Updated Date: Jun 2026 | Product Type: Market Research Report | |
| Publisher: 6Wresearch | Author: Bhawna Singh | No. of Pages: 60 | No. of Figures: 40 | No. of Tables: 7 |
Georgia Borax Market Size, Share & Growth Rate
The Georgia Borax Market was estimated at USD 223 Million in 2025 and is projected to reach USD 298 Million by 2032, growing at a CAGR of 4.2% from 2026 to 2032. This trajectory is primarily fueled by the increasing demand for boron-based products across several key sectors, including agriculture, ceramics, and detergents. As these industries seek to enhance product performance and sustainability, the use of borax as a multifunctional ingredient is anticipated to rise, further driving market growth.
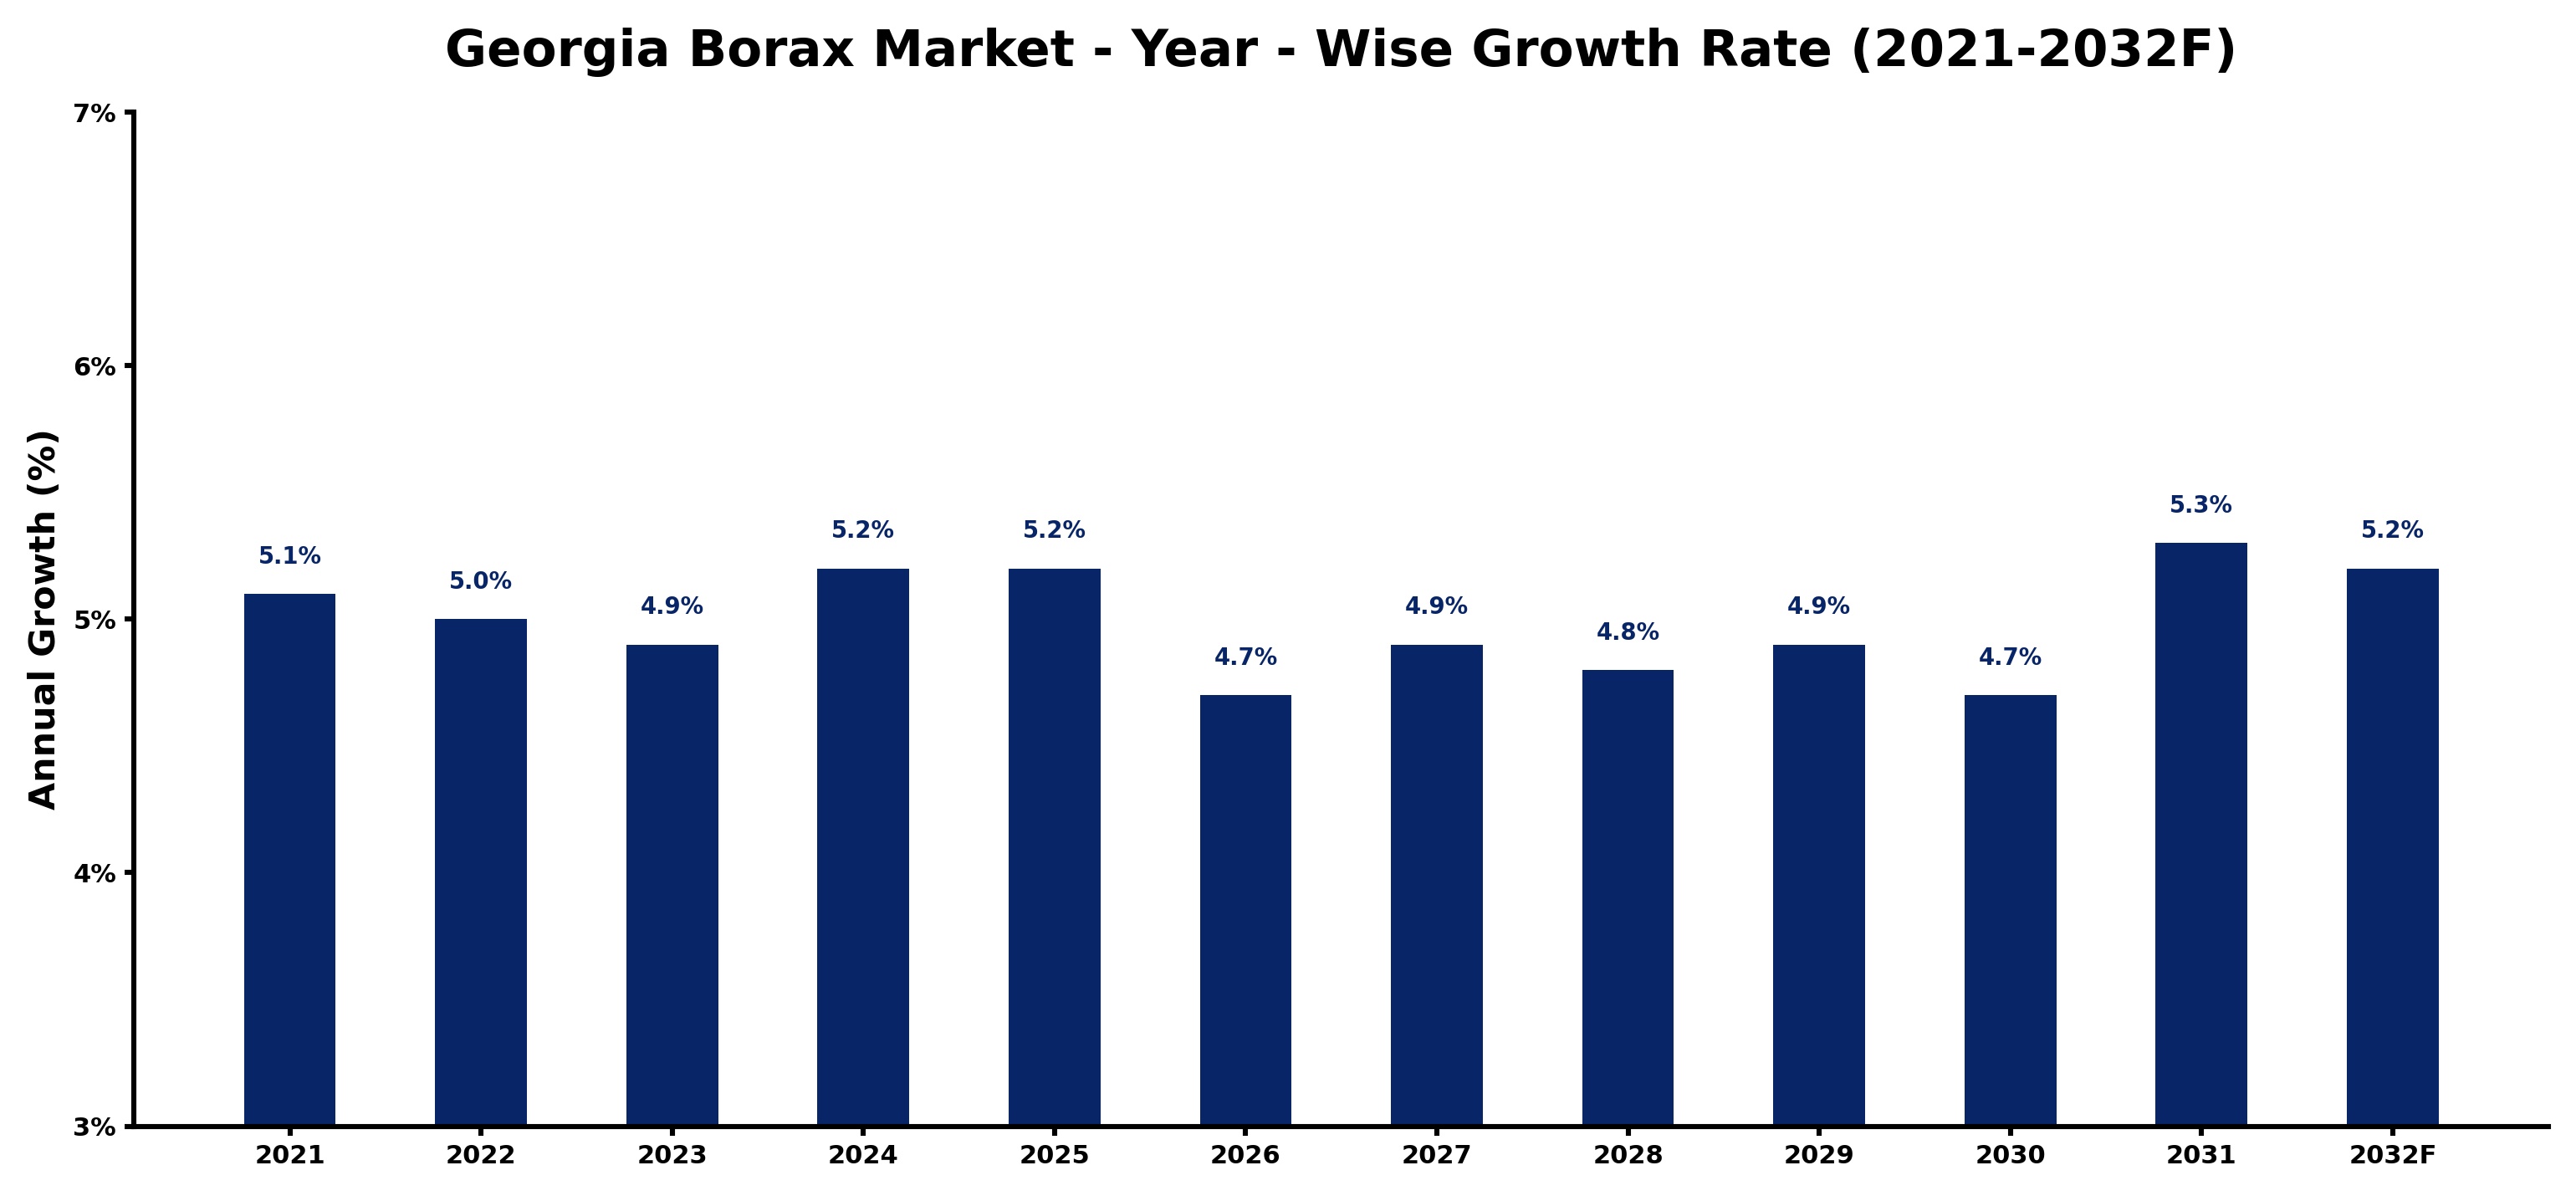
Georgia Borax Market Growth Rate Analysis (2021-2032)
The Georgia Borax market has exhibited stable growth over the past few years, with a yearly increase of 5.1% in 2021, slightly declining to 5.0% in 2022 and further to 4.9% in 2023, reflecting initial pandemic-related disruptions. However, projections indicate a resurgence with growth rebounding to 5.2% in both 2024 and 2025, fueled by rising consumer demand in agriculture and renewable energy sectors. The trend stabilizes around 4.9% to 4.7% until 2030, largely due to competitive pressures and market saturation. Notably, a promising 5.3% growth is anticipated in 2031, likely propelled by technological advancements and increased investments in sustainable practices, enhancing the product's market appeal.
Georgia Borax Market Year-wise Growth Rate and Key Drivers
This graph highlights how the Georgia Borax Market has steadily grown over the past five years, supported by major growth factors.
The table below presents the year‑wise growth rates along with the key drivers influencing the market
| Year | Growth Rate | Major Drivers |
| 2021 | 5.1% | Increased industrial applications emerged |
| 2022 | 5.0% | Agricultural sector demand surged |
| 2023 | 4.9% | Construction industry growth accelerated |
| 2024 | 5.2% | Environmental regulations enhanced usage |
| 2025 | 5.2% | Technological advancements improved efficiency |
| 2026 | 4.7% | Consumer awareness raised product demand |
| 2027 | 4.9% | Export opportunities expanded significantly |
| 2028 | 4.8% | Sustainability trends drove innovation |
| 2029 | 4.9% | Market diversification attracted investments |
| 2030 | 4.7% | Research initiatives enhanced product quality |
| 2031 | 5.3% | Strategic partnerships boosted market reach |
| 2032 | 5.2% | E-commerce platforms increased accessibility |
Note - Market size estimations and growth projections presented in this report are based on 6Wresearch’s advanced forecasting approach, validated with industry datasets as of June 2026.
Georgia Borax Market Synopsis
The strongest force shaping the Georgia Borax market is the rising focus on sustainable and eco-friendly solutions. With industries becoming more environmentally conscious, there is a notable shift toward sourcing borax products that align with sustainable practices. This growing awareness not only boosts demand for borax but also encourages innovation in production methods.
In addition, technological advancements in borax extraction and processing are enhancing the quality and purity of the product. This evolution is critical as manufacturers seek to meet stringent regulatory requirements and customer expectations for high-quality, environmentally-friendly boron solutions.
Georgia Borax Market Key Takeaways
- Steady growth driven by demand from agriculture, ceramics, and detergents.
- Shifts towards eco-friendly borax products highlight evolving consumer preferences.
- Technological improvements are enhancing product quality and production efficiency.
- Investment opportunities exist in innovative, sustainable boron-based solutions.
- Regulatory frameworks are shaping mining operations and environmental standards.
Evaluation of Restraints in Georgia Borax Market
While the Georgia Borax market presents numerous opportunities, it also faces notable constraints. Increasing competition from imported borax products poses a challenge for local producers, who must compete on pricing while ensuring quality. Additionally, the volatility of raw material prices can disrupt production costs, affecting overall profitability. Regulatory changes and the need for compliance with environmental standards also add layers of complexity, necessitating that companies invest in sustainable practices to remain competitive.
Georgia Borax Market Trends
Emerging trends within the Georgia Borax market are largely centered on sustainability and innovation. The demand for natural and eco-friendly boron compounds is rising, driven by a consumer shift toward environmentally responsible products. Furthermore, advancements in mining and production technologies are enabling higher yields and purities, which are critical in meeting stringent regulatory standards and enhancing market competitiveness.
Georgia Borax Market Opportunities
There are several lucrative investment opportunities in the Georgia Borax market. The increasing demand for boron-based products across various industries presents a chance for expansion and innovation. Companies focusing on developing environmentally friendly borax alternatives are likely to capture a niche market segment. Additionally, investments in research and development to create novel applications for borax could significantly enhance market positioning.
Government Initiatives in the Georgia Borax Market
Government policies in Georgia play a crucial role in regulating the borax market, particularly concerning mining practices. The Georgia Surface Mining Act mandates compliance for the operation of borax extraction activities, ensuring that environmental standards are upheld. Furthermore, initiatives aimed at promoting sustainable practices are increasingly influencing market dynamics, providing a framework that encourages responsible resource management while safeguarding public health.
Future Insights of the Georgia Borax Market
Looking ahead to 2026-2032, the Georgia Borax market is expected to continue its upward trajectory, fueled by robust demand across diverse applications, particularly in agriculture and ceramics. As the global population rises and disposable incomes increase, the pressure on industries to produce effective, eco-friendly products will grow. This environment sets the stage for borax to play a vital role, supported by ongoing innovations and sustainability trends that align with consumer expectations and regulatory landscapes.
Georgia Borax Market Latest Developments (May 2025 - June 2026)
Recent developments in the Georgia Borax market have highlighted a strong focus on sustainable extraction methods and product innovations. As industries adapt to changing consumer preferences, several initiatives promoting the use of environmentally friendly boron solutions have emerged. Additionally, collaborations among local mining companies are being established to enhance production efficiencies and share best practices in sustainability.
Georgia Borax Market - Key Attractiveness of the Report
- 10 Years of Market Numbers
- Historical Data Starting from 2022 to 2025
- Base Year: 2025
- Forecast Data until 2032
- Key Performance Indicators Impacting the Market
- Major Upcoming Developments and Projects
Key Highlights of the Report:
- Georgia Borax Market Outlook
- Market Size of Georgia Borax Market, 2025
- Forecast of Georgia Borax Market, 2032
- Historical Data and Forecast of Georgia Borax Revenues & Volume for the Period 2022-2032F
- Georgia Borax Market Trend Evolution
- Georgia Borax Market Drivers and Challenges
- Georgia Borax Price Trends
- Georgia Borax Porter's Five Forces
- Georgia Borax Industry Life Cycle
- Historical Data and Forecast of Georgia Borax Market Revenues & Volume By Types for the Period 2022-2032F
- Historical Data and Forecast of Georgia Borax Market Revenues & Volume By Anhydrous Borax for the Period 2022-2032F
- Historical Data and Forecast of Georgia Borax Market Revenues & Volume By Borax Pentahydrate for the Period 2022-2032F
- Historical Data and Forecast of Georgia Borax Market Revenues & Volume By Borax Decahydrate for the Period 2022-2032F
- Historical Data and Forecast of Georgia Borax Market Revenues & Volume By Applications for the Period 2022-2032F
- Historical Data and Forecast of Georgia Borax Market Revenues & Volume By Agriculture for the Period 2022-2032F
- Historical Data and Forecast of Georgia Borax Market Revenues & Volume By Transportation for the Period 2022-2032F
- Historical Data and Forecast of Georgia Borax Market Revenues & Volume By Building and Construction for the Period 2022-2032F
- Historical Data and Forecast of Georgia Borax Market Revenues & Volume By Detergents for the Period 2022-2032F
- Historical Data and Forecast of Georgia Borax Market Revenues & Volume By Healthcare for the Period 2022-2032F
- Historical Data and Forecast of Georgia Borax Market Revenues & Volume By Electronics for the Period 2022-2032F
- Historical Data and Forecast of Georgia Borax Market Revenues & Volume By Others for the Period 2022-2032F
- Georgia Borax Import Export Trade Statistics
- Market Opportunity Assessment By Types
- Market Opportunity Assessment By Applications
- Georgia Borax Top Companies Market Share
- Georgia Borax Competitive Benchmarking By Technical and Operational Parameters
- Georgia Borax Company Profiles
- Georgia Borax Key Strategic Recommendations
Georgia Borax Market - Frequently Asked Questions
The Georgia Borax Market was estimated at USD 223 Million in 2025 and is projected to reach USD 298 Million by 2032, growing at a CAGR of 4.2% from 2026 to 2032.
Borax plays a crucial role as a soil amendment, enhancing crop yield and quality, which is vital for a state with a strong agricultural sector.
Yes, the market is increasingly shifting towards eco-friendly borax products, driven by consumer demand for sustainable and environmentally responsible solutions.
Government regulations are pivotal, governing mining operations and ensuring environmental protections, which can affect operational costs and practices for borax producers.
Technological innovations are enhancing product quality and production efficiency, allowing manufacturers to meet evolving industry standards and consumer expectations.
6Wresearch actively monitors the Georgia Borax Market and publishes its comprehensive annual report, highlighting emerging trends, growth drivers, revenue analysis, and forecast outlook. Our insights help businesses to make data-backed strategic decisions with ongoing market dynamics. Our analysts track relevent industries related to the Georgia Borax Market, allowing our clients with actionable intelligence and reliable forecasts tailored to emerging regional needs.
Yes, we provide customisation as per your requirements. To learn more, feel free to contact us on sales@6wresearch.com
1 Executive Summary |
2 Introduction |
2.1 Key Highlights of the Report |
2.2 Report Description |
2.3 Market Scope & Segmentation |
2.4 Research Methodology |
2.5 Assumptions |
3 Georgia Borax Market Overview |
3.1 Georgia Country Macro Economic Indicators |
3.2 Georgia Borax Market Revenues & Volume, 2022 & 2032F |
3.3 Georgia Borax Market - Industry Life Cycle |
3.4 Georgia Borax Market - Porter's Five Forces |
3.5 Georgia Borax Market Revenues & Volume Share, By Types, 2022 & 2032F |
3.6 Georgia Borax Market Revenues & Volume Share, By Applications, 2022 & 2032F |
4 Georgia Borax Market Dynamics |
4.1 Impact Analysis |
4.2 Market Drivers |
4.2.1 Increasing demand for borax in various industries such as agriculture, ceramics, and glass manufacturing. |
4.2.2 Growing awareness about the benefits of borax in environmental applications. |
4.2.3 Expansion of end-use industries in Georgia utilizing borax in their production processes. |
4.3 Market Restraints |
4.3.1 Fluctuating prices of raw materials impacting the production cost of borax. |
4.3.2 Stringent regulations regarding the mining and extraction of borax in Georgia. |
4.3.3 Competition from substitute products affecting the market share of borax in the region. |
5 Georgia Borax Market Trends |
6 Georgia Borax Market, By Types |
6.1 Georgia Borax Market, By Types |
6.1.1 Overview and Analysis |
6.1.2 Georgia Borax Market Revenues & Volume, By Types, 2022-2032F |
6.1.3 Georgia Borax Market Revenues & Volume, By Anhydrous Borax, 2022-2032F |
6.1.4 Georgia Borax Market Revenues & Volume, By Borax Pentahydrate, 2022-2032F |
6.1.5 Georgia Borax Market Revenues & Volume, By Borax Decahydrate, 2022-2032F |
6.2 Georgia Borax Market, By Applications |
6.2.1 Overview and Analysis |
6.2.2 Georgia Borax Market Revenues & Volume, By Agriculture, 2022-2032F |
6.2.3 Georgia Borax Market Revenues & Volume, By Transportation, 2022-2032F |
6.2.4 Georgia Borax Market Revenues & Volume, By Building and Construction, 2022-2032F |
6.2.5 Georgia Borax Market Revenues & Volume, By Detergents, 2022-2032F |
6.2.6 Georgia Borax Market Revenues & Volume, By Healthcare, 2022-2032F |
6.2.7 Georgia Borax Market Revenues & Volume, By Electronics, 2022-2032F |
7 Georgia Borax Market Import-Export Trade Statistics |
7.1 Georgia Borax Market Export to Major Countries |
7.2 Georgia Borax Market Imports from Major Countries |
8 Georgia Borax Market Key Performance Indicators |
8.1 Percentage of borax adoption in new industries in Georgia. |
8.2 Number of research and development initiatives focused on enhancing borax applications. |
8.3 Environmental impact assessments related to borax mining and extraction practices in Georgia. |
9 Georgia Borax Market - Opportunity Assessment |
9.1 Georgia Borax Market Opportunity Assessment, By Types, 2022 & 2032F |
9.2 Georgia Borax Market Opportunity Assessment, By Applications, 2022 & 2032F |
10 Georgia Borax Market - Competitive Landscape |
10.1 Georgia Borax Market Revenue Share, By Companies, 2025 |
10.2 Georgia Borax Market Competitive Benchmarking, By Operating and Technical Parameters |
11 Company Profiles |
12 Recommendations |
13 Disclaimer |
Global Go To Market Strategy - 2030
Export potential enables firms to identify high-growth global markets with greater confidence by combining advanced trade intelligence with a structured quantitative methodology. The framework analyzes emerging demand trends and country-level import patterns while integrating macroeconomic and trade datasets such as GDP and population forecasts, bilateral import–export flows, tariff structures, elasticity differentials between developed and developing economies, geographic distance, and import demand projections. Using weighted trade values from 2020–2024 as the base period to project country-to-country export potential for 2030, these inputs are operationalized through calculated drivers such as gravity model parameters, tariff impact factors, and projected GDP per-capita growth. Through an analysis of hidden potentials, demand hotspots, and market conditions that are most favorable to success, this method enables firms to focus on target countries, maximize returns, and global expansion with data, backed by accuracy.
By factoring in the projected importer demand gap that is currently unmet and could be potential opportunity, it identifies the potential for the Exporter (Country) among 190 countries, against the general trade analysis, which identifies the biggest importer or exporter.
To discover high-growth global markets and optimize your business strategy:
Click Here
Pricing
- Single User License$ 1,995
- Department License$ 2,400
- Site License$ 3,120
- Global License$ 3,795

Leadership Perspectives from Industry Events
Search
Thought Leadership and Analyst Meet


Our Clients
6WResearch In News
- India Air Conditioner Market Set for Strong Rebound in 2026 After Weather-Led Correction and GST-Driven Recovery: 6Wresearch
- ADAS in India: How Automatic Emergency Braking, Blind Spot Detection & Driver Monitoring are Transforming Road Safety
- Doha a strategic location for EV manufacturing hub: IPA Qatar
- Demand for luxury TVs surging in the GCC, says Samsung
- Empowering Growth: The Thriving Journey of Bangladesh’s Cable Industry
- Demand for luxury TVs surging in the GCC, says Samsung
Latest Reports
- Poland Fire Protection Systems Market (2026-2032)
- Cape Verde Portable Hand-Thrown Extinguisher Market (2026-2032)
- Canada Portable Hand-Thrown Extinguisher Market (2026-2032)
- Cameroon Portable Hand-Thrown Extinguisher Market (2026-2032)
- Burundi Portable Hand-Thrown Extinguisher Market (2026-2032)
- Burkina Faso Portable Hand-Thrown Extinguisher Market (2026-2032)
- Bulgaria Portable Hand-Thrown Extinguisher Market (2026-2032)
- Brunei Portable Hand-Thrown Extinguisher Market (2026-2032)
- Botswana Portable Hand-Thrown Extinguisher Market (2026-2032)
- Bosnia and Herzegovina Portable Hand-Thrown Extinguisher Market (2026-2032)
Industry Events and Analyst Meet

HIMTEX 2026

India Refining Summit 2026

India EV Show 2026

EV tech India Expo 2026

Auto Tech Asia 2026
Whitepaper
- Middle East & Africa Commercial Security Market Click here to view more.
- Middle East & Africa Fire Safety Systems & Equipment Market Click here to view more.
- GCC Drone Market Click here to view more.
- Middle East Lighting Fixture Market Click here to view more.
- GCC Physical & Perimeter Security Market Click here to view more.