Georgia Refractory Material Market (2026-2032) Outlook | Companies, Share, Value, Analysis, Growth, Size, Revenue, Industry, Trends & Forecast
Market Forecast By Form (Shaped, Unshaped), By Chemical Composition (Alumina, Silica, Magnesia, Fireclay, Others), By Chemistry (Acidic, Basic, Neutral), By End-use (Metals & Metallurgy, Cement, Glass & Ceramics, Power Generation, Others) And Competitive Landscape
| Product Code: ETC195492 | Publication Date: May 2022 | Updated Date: Jun 2026 | Product Type: Market Research Report | |
| Publisher: 6Wresearch | Author: Sachin Kumar Rai | No. of Pages: 60 | No. of Figures: 40 | No. of Tables: 7 |
Georgia Refractory Material Market Size, Share & Growth Rate
The Georgia Refractory Material Market was estimated at USD 252 Million in 2025 and is projected to reach USD 353 Million by 2032, growing at a CAGR of 4.9% from 2026 to 2032. This growth trajectory is propelled by increasing industrial activities across steel, cement, and petrochemical sectors, all of which require high-performance materials. Additionally, ongoing investments in infrastructure development in Georgia will further stimulate demand for these essential products.
Georgia Refractory Material Market Growth Rate Analysis (2021-2032)
The Georgia refractory material market has experienced stable growth, with annual increases ranging from 5.5% to 6.1% over recent years. Specifically, growth rates of 5.9% in 2021 and 5.5% in 2022 were followed by a recovery to 5.8% in 2023, indicating a strong rebound fueled by heightened consumer demand and strategic investments in infrastructure projects. The upward trajectory continued into 2024 and 2026, with projections of 6.1%, driven by advancements in manufacturing technologies and the energy transition towards sustainable practices. Minor fluctuations, such as a dip to 5.5% in 2028, reflect market adjustments to evolving industrial policies and the competitive landscape. Overall, the sector's resilience is underpinned by consistent demand across various applications.
Georgia Refractory Material Market Year-wise Growth Rate and Key Drivers
This graph highlights how the Georgia Refractory Material Market has steadily grown over the past five years, supported by major growth factors.
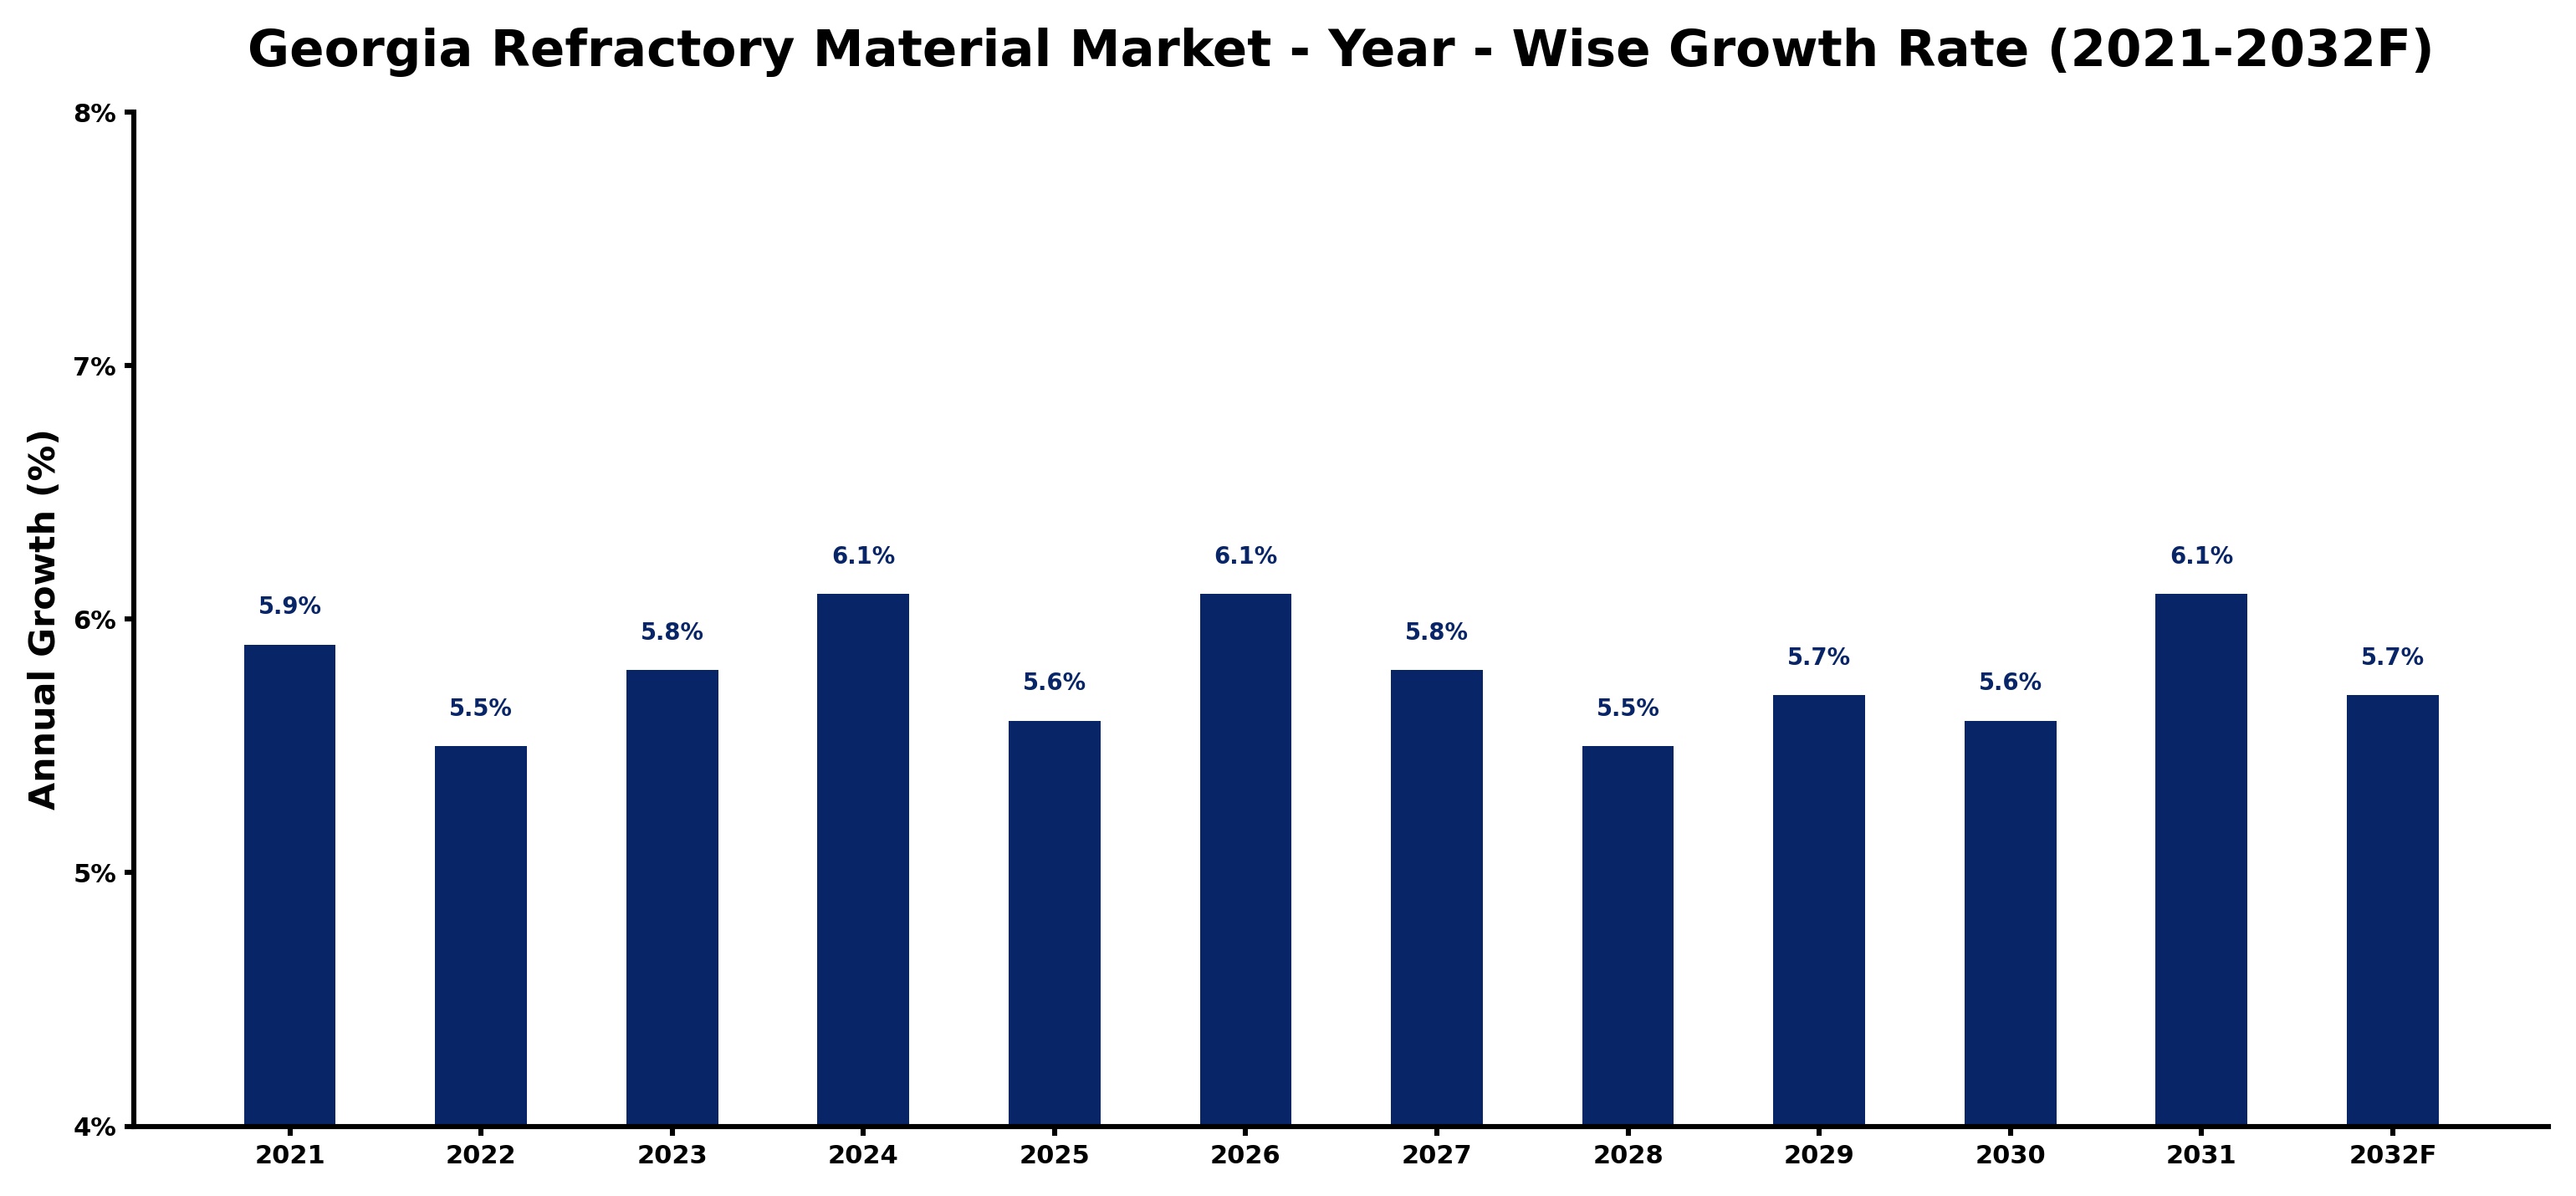
The table below presents the year‑wise growth rates along with the key drivers influencing the market
| Year | Growth Rate | Major Drivers |
| 2021 | 5.9% | Increased industrial production demand |
| 2022 | 5.5% | Technological advancements improved efficiency |
| 2023 | 5.8% | Construction sector growth accelerated usage |
| 2024 | 6.1% | Energy sector investments expanded applications |
| 2025 | 5.6% | Automotive industry recovery boosted sales |
| 2026 | 6.1% | Infrastructure projects increased material needs |
| 2027 | 5.8% | Manufacturing sector expansion drove demand |
| 2028 | 5.5% | Export opportunities enhanced market reach |
| 2029 | 5.7% | Research and development initiatives flourished |
| 2030 | 5.6% | Sustainability trends influenced material choices |
| 2031 | 6.1% | Global market integration expanded trade |
| 2032 | 5.7% | Innovative product offerings attracted buyers |
Note - Market size estimations and growth projections presented in this report are based on 6Wresearch’s advanced forecasting approach, validated with industry datasets as of June 2026.
Georgia Refractory Material Market Synopsis
The strongest force shaping the Georgia refractory material market right now is the industrial demand for sustainable and high-performance refractory products. With key sectors increasingly focused on energy efficiency, manufacturers are innovating to meet these requirements, creating materials that not only withstand high temperatures but also minimize environmental impact.
Moreover, the expansion of Georgia’s construction sector acts as a secondary yet significant driver, as new infrastructure projects elevate the need for robust refractory materials. This trend reflects a broader movement towards modernization and adaptation of advanced manufacturing processes in the region.
Georgia Refractory Material Market Key Takeaways
- Steady growth in the Georgia refractory material market due to industrialization and infrastructural investments.
- Emphasis on sustainable and energy-efficient refractory materials is reshaping product development strategies.
- Adoption of advanced technologies in monitoring and maintenance is on the rise.
- Customization of refractory solutions to cater to specific industrial needs is gaining traction.
- Market challenges include intense competition and fluctuating raw material costs.
Evaluation of Restraints in Georgia Refractory Material Market
The Georgia refractory material market is encountering significant restraints that could hinder its full potential. Chief among these is the fierce competition posed by global manufacturers with broader resources, making it difficult for local firms to maintain a foothold. Additionally, volatility in raw material costs, particularly for essential ingredients like alumina and silica, poses a threat to profitability. Furthermore, stringent environmental regulations necessitate costly adaptations in manufacturing processes, which can strain smaller enterprises that are less equipped to absorb such expenses.
Georgia Refractory Material Market Trends
A notable trend in the Georgia refractory material market is the rising demand for high-performance materials that promise extended service life and better thermal insulation. Manufacturers are investing heavily in research and development to innovate products that can endure the increasingly harsh conditions seen in sectors such as glass and cement manufacturing. Moreover, the integration of digital technologies for monitoring refractory performance and maintenance is gradually becoming standard, enhancing operational efficiency and reducing downtime.
Georgia Refractory Material Market Opportunities
There exists a wealth of investment opportunities within the Georgia refractory material market, particularly due to the burgeoning needs of steel, cement, and glass sectors. The ongoing growth in construction activities amplifies demand, creating openings for suppliers to offer high-quality products tailored to withstand extreme conditions. Additionally, with Georgia's strategic location, companies can effectively reach diverse markets across the Southeastern United States, bolstering their competitive advantage.
Government Initiatives in the Georgia Refractory Material Market
Government policies affecting the Georgia refractory material market are predominantly aimed at fostering sustainable manufacturing practices and promoting innovation. These regulations encompass emission controls and worker safety standards, which ensure that companies operate within environmentally responsible frameworks. Incentives for adopting modern technologies and processes are also available, encouraging local firms to enhance their operational efficiencies. Initiatives supporting research and development aim to elevate product quality and maintain competitive standards within the industry.
Future Insights of the Georgia Refractory Material Market
Looking ahead to 2026-2032, the Georgia refractory material market is expected to witness robust growth fueled by continued industrial expansion and infrastructure investments. A pivotal focus on energy efficiency and sustainability will drive the demand for innovative refractory solutions. While challenges such as fluctuating raw material prices and regulatory compliance persist, the market's overall trajectory appears positive, suggesting a period of steady growth supported by technological advancements and a commitment to sustainable practices.
Georgia Refractory Material Market Latest Developments (May 2025 - June 2026)
The Georgia refractory material market has seen significant developments aimed at enhancing product quality and operational efficiency. Manufacturers are increasingly integrating smart technologies into their production processes, enabling real-time monitoring and improved maintenance protocols. There is also a noticeable shift towards eco-friendly materials, as companies respond to both regulatory pressures and consumer demand for sustainable options. Furthermore, collaborations aimed at research and development are gaining momentum, positioning the local market to better compete on a global scale.
Georgia Refractory Material Market - Key Attractiveness of the Report
- 10 Years of Market Numbers
- Historical Data Starting from 2022 to 2025
- Base Year: 2025
- Forecast Data until 2032
- Key Performance Indicators Impacting the Market
- Major Upcoming Developments and Projects
Key Highlights of the Report:
- Georgia Refractory Material Market Outlook
- Market Size of Georgia Refractory Material Market, 2025
- Forecast of Georgia Refractory Material Market, 2032
- Historical Data and Forecast of Georgia Refractory Material Revenues & Volume for the Period 2022-2032F
- Georgia Refractory Material Market Trend Evolution
- Georgia Refractory Material Market Drivers and Challenges
- Georgia Refractory Material Price Trends
- Georgia Refractory Material Porter's Five Forces
- Georgia Refractory Material Industry Life Cycle
- Historical Data and Forecast of Georgia Refractory Material Market Revenues & Volume By Form for the Period 2022-2032F
- Historical Data and Forecast of Georgia Refractory Material Market Revenues & Volume By Shaped for the Period 2022-2032F
- Historical Data and Forecast of Georgia Refractory Material Market Revenues & Volume By Unshaped for the Period 2022-2032F
- Historical Data and Forecast of Georgia Refractory Material Market Revenues & Volume By Chemical Composition for the Period 2022-2032F
- Historical Data and Forecast of Georgia Refractory Material Market Revenues & Volume By Alumina for the Period 2022-2032F
- Historical Data and Forecast of Georgia Refractory Material Market Revenues & Volume By Silica for the Period 2022-2032F
- Historical Data and Forecast of Georgia Refractory Material Market Revenues & Volume By Magnesia for the Period 2022-2032F
- Historical Data and Forecast of Georgia Refractory Material Market Revenues & Volume By Fireclay for the Period 2022-2032F
- Historical Data and Forecast of Georgia Refractory Material Market Revenues & Volume By Others for the Period 2022-2032F
- Historical Data and Forecast of Georgia Refractory Material Market Revenues & Volume By Chemistry for the Period 2022-2032F
- Historical Data and Forecast of Georgia Refractory Material Market Revenues & Volume By Acidic for the Period 2022-2032F
- Historical Data and Forecast of Georgia Refractory Material Market Revenues & Volume By Basic for the Period 2022-2032F
- Historical Data and Forecast of Georgia Refractory Material Market Revenues & Volume By Neutral for the Period 2022-2032F
- Historical Data and Forecast of Georgia Refractory Material Market Revenues & Volume By End-use for the Period 2022-2032F
- Historical Data and Forecast of Georgia Refractory Material Market Revenues & Volume By Metals & Metallurgy for the Period 2022-2032F
- Historical Data and Forecast of Georgia Refractory Material Market Revenues & Volume By Cement for the Period 2022-2032F
- Historical Data and Forecast of Georgia Refractory Material Market Revenues & Volume By Glass & Ceramics for the Period 2022-2032F
- Historical Data and Forecast of Georgia Refractory Material Market Revenues & Volume By Power Generation for the Period 2022-2032F
- Historical Data and Forecast of Georgia Refractory Material Market Revenues & Volume By Others for the Period 2022-2032F
- Georgia Refractory Material Import Export Trade Statistics
- Market Opportunity Assessment By Form
- Market Opportunity Assessment By Chemical Composition
- Market Opportunity Assessment By Chemistry
- Market Opportunity Assessment By End-use
- Georgia Refractory Material Top Companies Market Share
- Georgia Refractory Material Competitive Benchmarking By Technical and Operational Parameters
- Georgia Refractory Material Company Profiles
- Georgia Refractory Material Key Strategic Recommendations
Georgia Refractory Material Market - Frequently Asked Questions
The primary sectors include steel, cement, glass, and petrochemicals, all of which demand high-performance refractory solutions to withstand extreme temperatures and corrosive environments.
The Georgia Refractory Material Market was estimated at USD 252 Million in 2025 and is projected to reach USD 353 Million by 2032, growing at a CAGR of 4.9% from 2026 to 2032.
Stringent regulations regarding emissions and waste management, coupled with a growing emphasis on sustainability, are pushing manufacturers to innovate and adopt greener practices.
Many manufacturers are prioritizing the development of eco-friendly products and the integration of advanced technologies, such as automation and digital monitoring, to enhance product performance and efficiency.
Local firms are focusing on strategic partnerships, continuous innovation, and customization of products to meet specific industrial needs while maintaining cost-effectiveness and quality.
6Wresearch actively monitors the Georgia Refractory Material Market and publishes its comprehensive annual report, highlighting emerging trends, growth drivers, revenue analysis, and forecast outlook. Our insights help businesses to make data-backed strategic decisions with ongoing market dynamics. Our analysts track relevent industries related to the Georgia Refractory Material Market, allowing our clients with actionable intelligence and reliable forecasts tailored to emerging regional needs.
Yes, we provide customisation as per your requirements. To learn more, feel free to contact us on sales@6wresearch.com
1 Executive Summary |
2 Introduction |
2.1 Key Highlights of the Report |
2.2 Report Description |
2.3 Market Scope & Segmentation |
2.4 Research Methodology |
2.5 Assumptions |
3 Georgia Refractory Material Market Overview |
3.1 Georgia Country Macro Economic Indicators |
3.2 Georgia Refractory Material Market Revenues & Volume, 2022 & 2032F |
3.3 Georgia Refractory Material Market - Industry Life Cycle |
3.4 Georgia Refractory Material Market - Porter's Five Forces |
3.5 Georgia Refractory Material Market Revenues & Volume Share, By Form, 2022 & 2032F |
3.6 Georgia Refractory Material Market Revenues & Volume Share, By Chemical Composition, 2022 & 2032F |
3.7 Georgia Refractory Material Market Revenues & Volume Share, By Chemistry, 2022 & 2032F |
3.8 Georgia Refractory Material Market Revenues & Volume Share, By End-use, 2022 & 2032F |
4 Georgia Refractory Material Market Dynamics |
4.1 Impact Analysis |
4.2 Market Drivers |
4.2.1 Increasing demand for refractory materials in industries such as steel, cement, and glass due to infrastructure development and industrialization. |
4.2.2 Technological advancements leading to the development of high-performance refractory materials with improved durability and thermal resistance. |
4.2.3 Growing focus on sustainable and energy-efficient manufacturing processes driving the adoption of refractory materials in Georgia. |
4.3 Market Restraints |
4.3.1 Fluctuating raw material prices impacting the overall production costs of refractory materials. |
4.3.2 Intense competition from alternative materials such as ceramics and composites posing a challenge to the growth of the refractory material market in Georgia. |
5 Georgia Refractory Material Market Trends |
6 Georgia Refractory Material Market, By Types |
6.1 Georgia Refractory Material Market, By Form |
6.1.1 Overview and Analysis |
6.1.2 Georgia Refractory Material Market Revenues & Volume, By Form, 2022-2032F |
6.1.3 Georgia Refractory Material Market Revenues & Volume, By Shaped, 2022-2032F |
6.1.4 Georgia Refractory Material Market Revenues & Volume, By Unshaped, 2022-2032F |
6.2 Georgia Refractory Material Market, By Chemical Composition |
6.2.1 Overview and Analysis |
6.2.2 Georgia Refractory Material Market Revenues & Volume, By Alumina, 2022-2032F |
6.2.3 Georgia Refractory Material Market Revenues & Volume, By Silica, 2022-2032F |
6.2.4 Georgia Refractory Material Market Revenues & Volume, By Magnesia, 2022-2032F |
6.2.5 Georgia Refractory Material Market Revenues & Volume, By Fireclay, 2022-2032F |
6.2.6 Georgia Refractory Material Market Revenues & Volume, By Others, 2022-2032F |
6.3 Georgia Refractory Material Market, By Chemistry |
6.3.1 Overview and Analysis |
6.3.2 Georgia Refractory Material Market Revenues & Volume, By Acidic, 2022-2032F |
6.3.3 Georgia Refractory Material Market Revenues & Volume, By Basic, 2022-2032F |
6.3.4 Georgia Refractory Material Market Revenues & Volume, By Neutral, 2022-2032F |
6.4 Georgia Refractory Material Market, By End-use |
6.4.1 Overview and Analysis |
6.4.2 Georgia Refractory Material Market Revenues & Volume, By Metals & Metallurgy, 2022-2032F |
6.4.3 Georgia Refractory Material Market Revenues & Volume, By Cement, 2022-2032F |
6.4.4 Georgia Refractory Material Market Revenues & Volume, By Glass & Ceramics, 2022-2032F |
6.4.5 Georgia Refractory Material Market Revenues & Volume, By Power Generation, 2022-2032F |
6.4.6 Georgia Refractory Material Market Revenues & Volume, By Others, 2022-2032F |
7 Georgia Refractory Material Market Import-Export Trade Statistics |
7.1 Georgia Refractory Material Market Export to Major Countries |
7.2 Georgia Refractory Material Market Imports from Major Countries |
8 Georgia Refractory Material Market Key Performance Indicators |
8.1 Number of new patents or innovations in refractory material technology. |
8.2 Percentage of industrial companies in Georgia using advanced refractory materials in their operations. |
8.3 Investment in research and development (RD) for refractory material innovations in Georgia. |
8.4 Energy efficiency improvements achieved through the use of refractory materials in manufacturing processes. |
8.5 Adoption rate of eco-friendly refractory materials in Georgia industries. |
9 Georgia Refractory Material Market - Opportunity Assessment |
9.1 Georgia Refractory Material Market Opportunity Assessment, By Form, 2022 & 2032F |
9.2 Georgia Refractory Material Market Opportunity Assessment, By Chemical Composition, 2022 & 2032F |
9.3 Georgia Refractory Material Market Opportunity Assessment, By Chemistry, 2022 & 2032F |
9.4 Georgia Refractory Material Market Opportunity Assessment, By End-use, 2022 & 2032F |
10 Georgia Refractory Material Market - Competitive Landscape |
10.1 Georgia Refractory Material Market Revenue Share, By Companies, 2025 |
10.2 Georgia Refractory Material Market Competitive Benchmarking, By Operating and Technical Parameters |
11 Company Profiles |
12 Recommendations |
13 Disclaimer |
Global Go To Market Strategy - 2030
Export potential enables firms to identify high-growth global markets with greater confidence by combining advanced trade intelligence with a structured quantitative methodology. The framework analyzes emerging demand trends and country-level import patterns while integrating macroeconomic and trade datasets such as GDP and population forecasts, bilateral import–export flows, tariff structures, elasticity differentials between developed and developing economies, geographic distance, and import demand projections. Using weighted trade values from 2020–2024 as the base period to project country-to-country export potential for 2030, these inputs are operationalized through calculated drivers such as gravity model parameters, tariff impact factors, and projected GDP per-capita growth. Through an analysis of hidden potentials, demand hotspots, and market conditions that are most favorable to success, this method enables firms to focus on target countries, maximize returns, and global expansion with data, backed by accuracy.
By factoring in the projected importer demand gap that is currently unmet and could be potential opportunity, it identifies the potential for the Exporter (Country) among 190 countries, against the general trade analysis, which identifies the biggest importer or exporter.
To discover high-growth global markets and optimize your business strategy:
Click Here
Pricing
- Single User License$ 1,995
- Department License$ 2,400
- Site License$ 3,120
- Global License$ 3,795

Leadership Perspectives from Industry Events
Search
Thought Leadership and Analyst Meet


Our Clients
6WResearch In News
- India Air Conditioner Market Set for Strong Rebound in 2026 After Weather-Led Correction and GST-Driven Recovery: 6Wresearch
- ADAS in India: How Automatic Emergency Braking, Blind Spot Detection & Driver Monitoring are Transforming Road Safety
- Doha a strategic location for EV manufacturing hub: IPA Qatar
- Demand for luxury TVs surging in the GCC, says Samsung
- Empowering Growth: The Thriving Journey of Bangladesh’s Cable Industry
- Demand for luxury TVs surging in the GCC, says Samsung
Latest Reports
- Poland Fire Protection Systems Market (2026-2032)
- Cape Verde Portable Hand-Thrown Extinguisher Market (2026-2032)
- Canada Portable Hand-Thrown Extinguisher Market (2026-2032)
- Cameroon Portable Hand-Thrown Extinguisher Market (2026-2032)
- Burundi Portable Hand-Thrown Extinguisher Market (2026-2032)
- Burkina Faso Portable Hand-Thrown Extinguisher Market (2026-2032)
- Bulgaria Portable Hand-Thrown Extinguisher Market (2026-2032)
- Brunei Portable Hand-Thrown Extinguisher Market (2026-2032)
- Botswana Portable Hand-Thrown Extinguisher Market (2026-2032)
- Bosnia and Herzegovina Portable Hand-Thrown Extinguisher Market (2026-2032)
Industry Events and Analyst Meet

HIMTEX 2026

India Refining Summit 2026

India EV Show 2026

EV tech India Expo 2026

Auto Tech Asia 2026
Whitepaper
- Middle East & Africa Commercial Security Market Click here to view more.
- Middle East & Africa Fire Safety Systems & Equipment Market Click here to view more.
- GCC Drone Market Click here to view more.
- Middle East Lighting Fixture Market Click here to view more.
- GCC Physical & Perimeter Security Market Click here to view more.