India 3D Visualization Market Size & Growth Rate
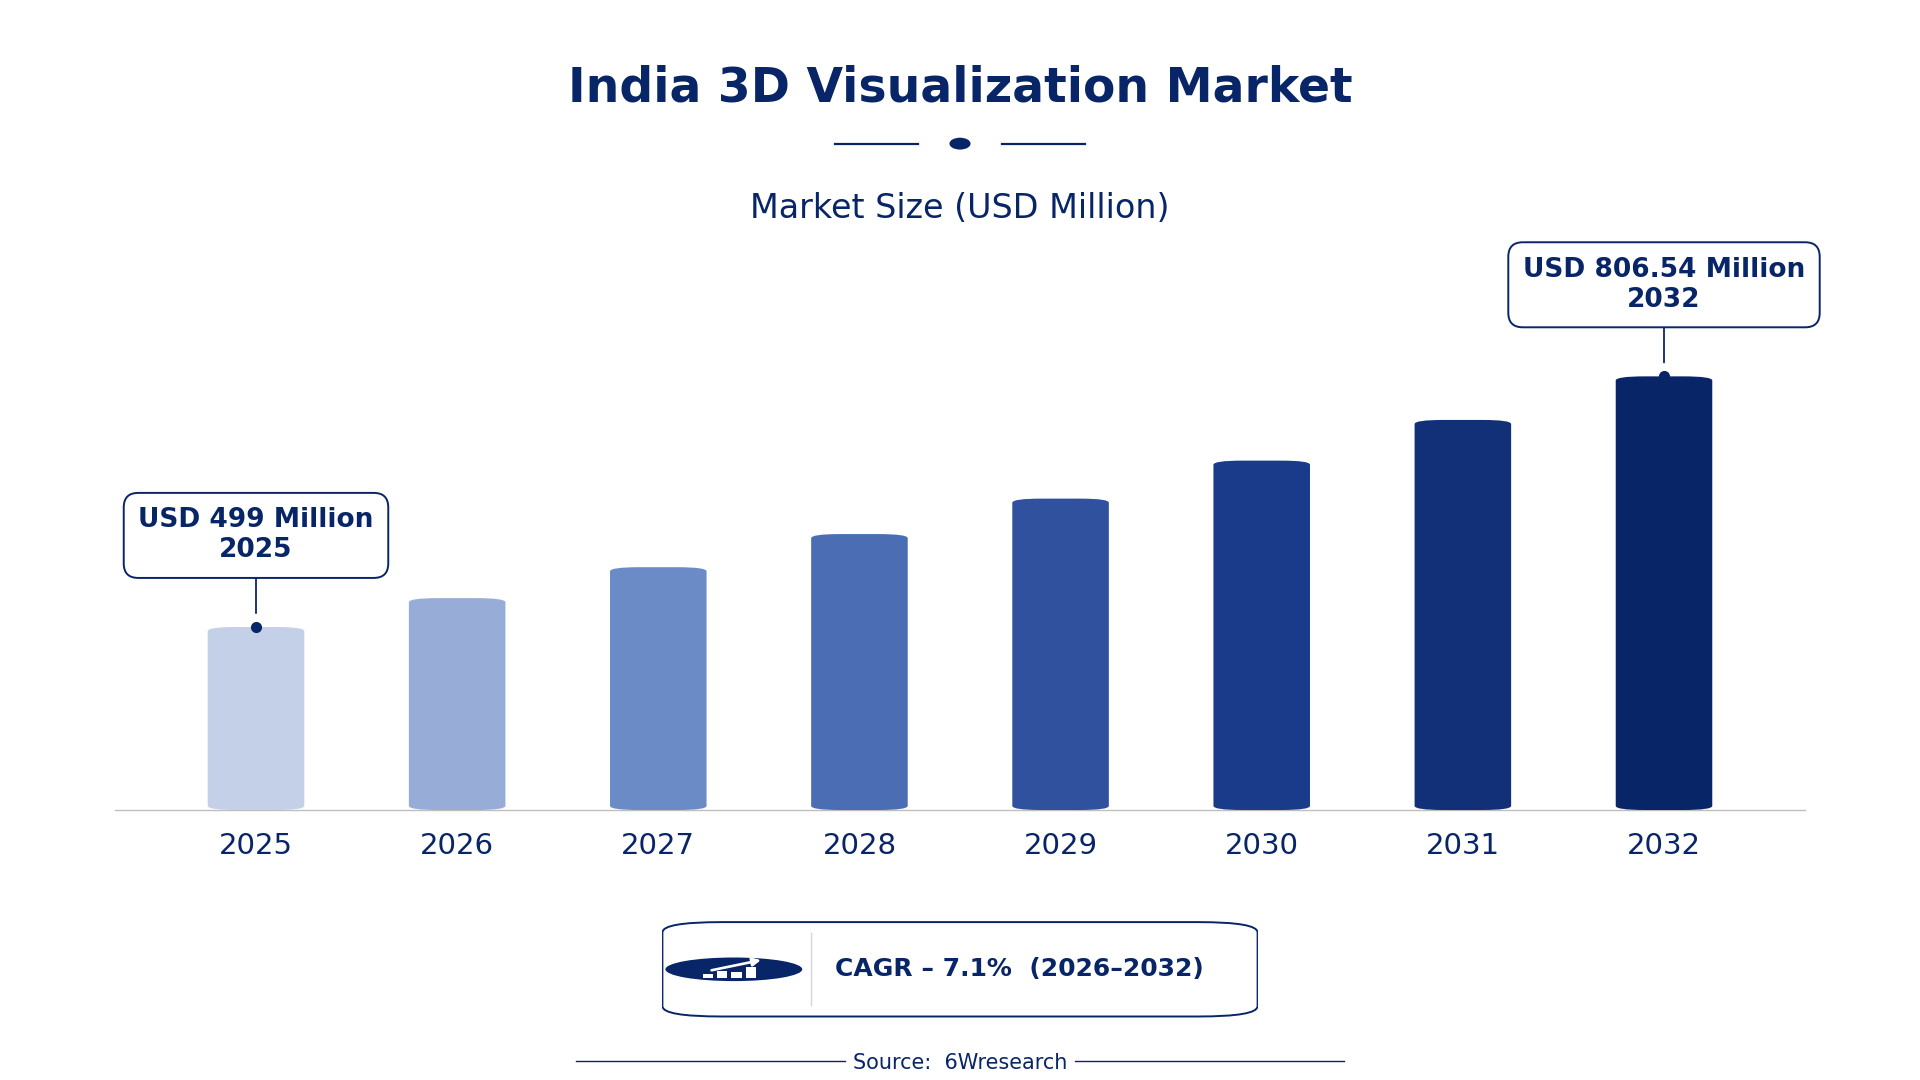
According to 6Wresearch internal database and industry insights, the India 3D Visualization Market was valued at USD 499.0 million in 2025 and is projected to reach USD 806.54 million by 2032, growing at a CAGR of approximately 7.1% during 2026–2032.
India 3D Visualization Market Highlights
| Report Metric | Details |
| Report Name | India 3D Visualization Market |
| Market Size 2025 | USD 499.0 million |
| Market Size 2032 | USD 806.54 million |
| Absolute Growth 2025–2032 | USD 307.54 million |
| CAGR 2026–2032 | 7.1% |
| Peak Annual Growth | 9.6% in 2026 |
| Forecast Period | 2026–2032 |
| Historical Data | 2022–2025 |
| Base Year | 2025 |
| Leading Solution Type, 2025 | 3D Modeling Software (46% share) |
| Leading Deployment Mode, 2025 | Cloud-Based (47% share) |
| Leading Platform Type, 2025 | Desktop (42% share) |
| Leading Distribution Channel, 2025 | Online Subscription (42% share) |
| Leading End User Industry, 2025 | Gaming (43% share) |
| Fastest-Growing Solution Type | AR/VR Integration (9.3% CAGR) |
| Fastest-Growing Platform Type | Web-Based (9.5% CAGR) |
| Fastest-Growing Distribution Channel | Direct Sales (8.4% CAGR) |
| Fastest-Growing End User Industry | Architecture (8.5% CAGR) |
| Growing Sector | Gaming |
| Key End Users | Architectural firms, Gaming studios, Real estate developers, Educational institutions |
India 3D Visualization Market Year-wise Growth Rate and Key Drivers (2022–2032)
This graph illustrates the annual growth rates of the market from 2022 to 2032, highlighting a steady upward trajectory and projected market expansion over the forecast period.
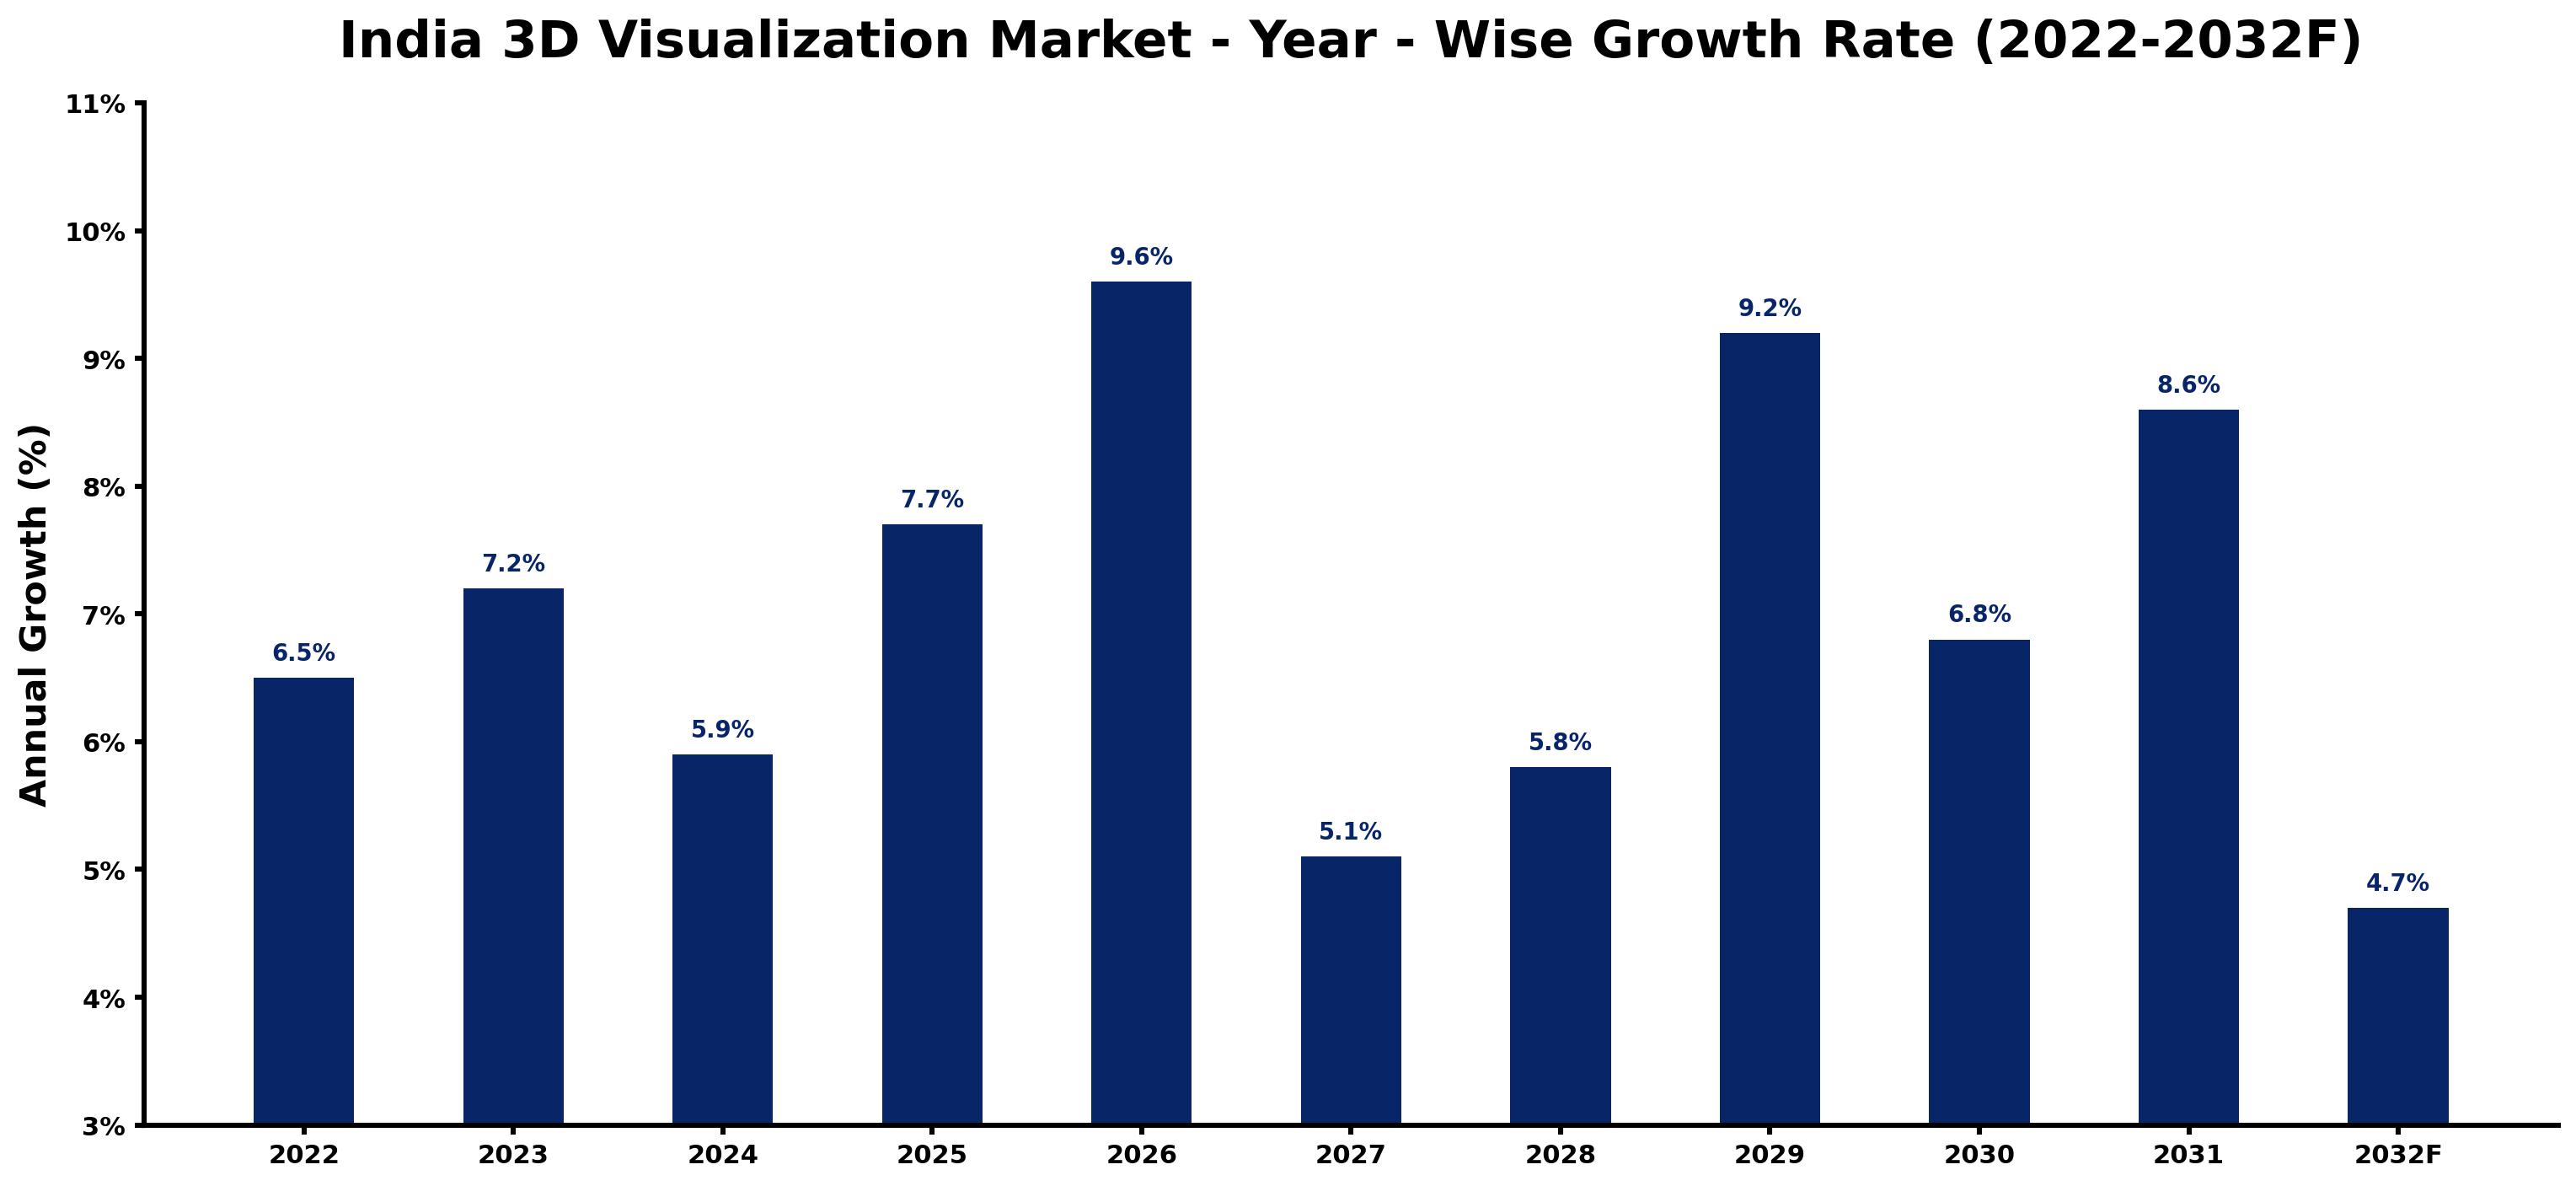
Below, each year's estimated growth is shown next to the factor that most influenced it.
| Year | Estimated Annual Growth (%) | Market Rationale |
| 2022 | 6.5 | The market experienced steady growth, driven by increased adoption of 3D visualization tools in design processes. |
| 2023 | 7.2 | Demand surged as the gaming industry expanded, contributing to a higher need for advanced visualization technologies. |
| 2024 | 5.9 | Growth slowed as the market adjusted to previous high rates, maintaining a positive outlook. |
| 2025 | 7.7 | The market rebounded with faster growth, aided by rising investments in the real estate sector. |
| 2026 | 9.6 | A peak growth rate is expected, largely due to the increasing integration of AR/VR technologies. |
| 2027 | 5.1 | Growth is projected to slow as the market stabilises, reflecting a more mature adoption phase among users. |
| 2028 | 5.8 | A slight increase in growth is anticipated, driven by renewed interest in innovative visualization solutions. |
| 2029 | 9.2 | The market is expected to accelerate again, propelled by advancements in gaming technologies and applications. |
| 2030 | 6.8 | Growth will decelerate as the market begins to normalise after several years of rapid expansion. |
| 2031 | 8.6 | A rebound in growth is anticipated, supported by ongoing developments in the architectural sector. |
| 2032 | 4.7 | The market is projected to continue growing, albeit at a slower pace, as demand stabilises across various industries. |
Note: Market size estimations and growth projections presented in this report are based on 6Wresearch's proprietary forecasting methodology, utilizing the latest available industry data, government publications, and primary research inputs.
India 3D Visualization Market Synopsis
The India 3D Visualization Market includes technologies that create three-dimensional representations of data or objects, primarily utilised in architecture, gaming, and real estate. Produced using software tools for modelling, simulation, and rendering, this market is growing due to increased investments in the gaming sector and the ongoing Digital India initiative that encourages technology adoption, improving design processes across various industries. The Indian gaming industry, valued at approximately $1.8 billion in 2022, plays a crucial role in this expansion.
Market Dynamics Impact Analysis (2026–2032)
| Factor | Type | Impact | Primary Segment Affected |
| Increased demand for AR/VR technologies | Driver | High | AR/VR Integration |
| Growing adoption of cloud-based solutions | Driver | High | Cloud-Based |
| Rising investments in smart city projects | Opportunity | High | 3D Modeling Software |
| Expansion of the gaming industry | Opportunity | High | Gaming |
| Limited awareness of 3D visualization benefits | Restraint | Medium | Simulation Software |
| High initial costs of advanced software tools | Restraint | Medium | CAD Tools |
| Shortage of skilled professionals in 3D visualization | Challenge | High | AR/VR Integration |
| Rapid technological advancements leading to obsolescence | Challenge | High | 3D Modeling Software |
Evaluation of Drivers in India 3D Visualization Market (2026–2032)
The table below links each growth driver to the segment it affects and the evidence for it.
| Drivers | Primary Segment Affected | Why It Matters (Evidence) |
| Rising investments in the gaming sector | Gaming | The Indian gaming market, valued at $1.8 billion in 2022, drives demand for 3D visualization tools. |
| Increased adoption of cloud-based solutions | Cloud-Based | As of 2023, 70% of new software adoptions are cloud-based, providing flexibility for users. |
| Growing demand for AR/VR technologies | AR/VR Integration | The National Association of Software and Service Companies reported a rise in demand for AR/VR technologies in 2023. |
| Expansion of smart city projects | 3D Modeling Software | The Ministry of Housing and Urban Affairs promotes 3D visualization in urban planning, driving demand. |
| Increased use of 3D visualization in architecture | Architecture | Over 50% of architectural firms in India use 3D modeling software for design processes. |
The 3D Visualization market in India is expanding as rising investments in the gaming sector, increased adoption of cloud-based solutions, and growing interest in AR/VR technologies drive growth. The Indian gaming market, valued at $1.8 billion in 2022, boosts the need for advanced visualization tools. As of 2023, 70% of new software adoptions are cloud-based, providing flexibility and cost-effectiveness for users. The Smart Cities Mission promotes 3D visualization in urban planning, increasing its application in development projects. More than half of architectural firms in India are utilising 3D modeling software, further increasing demand for these tools.
Evaluation of Restraints in India 3D Visualization Market
The key brakes on demand, and where they bite hardest, are shown below.
| Market Restraint | Primary Segment Affected | Why It Matters (Evidence) |
| Limited awareness of 3D visualization benefits | Simulation Software | Many potential users remain unaware of the advantages of 3D visualization, hindering adoption rates. |
| High initial costs of advanced software tools | CAD Tools | The investment required for advanced software tools can deter smaller firms from adoption. |
| Shortage of skilled professionals in 3D visualization | AR/VR Integration | A lack of trained professionals limits the effective implementation of AR/VR technologies in projects. |
| Rapid technological advancements leading to obsolescence | 3D Modeling Software | Frequent updates and new technologies can render existing tools obsolete, discouraging investment. |
| Inconsistent standards for quality assurance | 3D Modeling Software | The absence of established quality standards can lead to variability in software performance. |
India 3D Visualization Market Challenges
The India 3D Visualization market faces a critical issue with the shortage of skilled professionals, which hampers buyers' ability to implement advanced tools effectively. Regulatory hurdles from the Bureau of Indian Standards are creating compliance delays that can extend project timelines for architectural firms by up to three months. Local suppliers are struggling to compete with international players, which pressures them to innovate rapidly or risk losing clients in the fast-paced gaming and real estate sectors. The high costs of advanced 3D visualization tools can strain budgets, especially for buyers in the gaming industry, where funding is often limited and project costs can exceed $1 million.
Trends in the India 3D Visualization Market
Four trends stand out in the India 3D Visualization Market.
- Shift towards Cloud-Based Solutions: The preference for cloud-based solutions is increasing, with 70% of new software adoptions in India being cloud-based as of 2023. This trend provides flexibility and cost-effectiveness for users.
- Increasing Integration of AR/VR in Gaming: Since 2023, AR/VR technologies have seen significant integration in the gaming industry, driving demand for immersive experiences. The gaming market is expected to grow at a CAGR of 22% from 2023 to 2026.
- Adoption of 3D Visualization in Urban Planning: The Smart Cities Mission, announced in 2023, encourages the use of 3D visualization in urban development projects. This initiative aims to improve planning efficiency and project outcomes.
- Expansion of 3D Visualization in Education: In 2023, educational institutions increasingly adopted virtual reality headsets for immersive learning experiences. This shift supports the training of future professionals in 3D visualization.
Investment Opportunities in the India 3D Visualization Market
Several openings in the India 3D Visualization Market merit attention from investors.
- Growing Demand for 3D Visualization in Real Estate: With the real estate sector expanding, there is a strong opportunity to supply 3D visualization tools. The architectural sector is expected to adopt these tools at a rate of 40% by 2025.
- Investment in Skill Development Programs: The Skill India Mission has allocated ₹500 crore to enhance workforce skills in 3D modeling and visualization. This funding presents opportunities for training providers to meet industry needs.
- Increased Focus on Smart City Projects: The government's Smart Cities Mission promotes 3D visualization for urban planning. This initiative creates opportunities for suppliers to engage with local municipalities on projects.
- Expansion of 3D Visualization in Gaming: The gaming industry is expected to grow rapidly, creating demand for advanced visualization tools. Suppliers can target gaming studios in Maharashtra, a hub for animation.
Government Initiatives in the India 3D Visualization Market
In 2023, the Ministry of Electronics and Information Technology launched the Digital India 2.0 initiative to promote technology adoption, including 3D visualization. This initiative builds on previous efforts to drive innovation and skill development in the tech sector. It aims to create a more digitally empowered society, encouraging the use of advanced technologies across various industries. The National Policy on Software Products, introduced by the Ministry of Electronics and Information Technology in 2021, aims to boost the software industry, including 3D visualization technologies. With a target of creating 20 lakh jobs by 2025, this policy supports the growth of the software sector and increases the demand for visualization tools.
In 2023, the Skill India Mission allocated ₹500 crore to enhance workforce skills in 3D modeling and visualization. This funding supports various training programs, enabling producers to develop a skilled workforce. The Ministry of Electronics and Information Technology oversees these initiatives, ensuring alignment with industry needs. The National Institute of Fashion Technology has integrated 3D visualization into its curriculum since 2021, preparing students for the evolving fashion industry. This integration helps to cultivate a talent pool ready to meet the demands of the market.
Future Insight of the India 3D Visualization Market
The India 3D Visualization market is set for substantial growth by 2032, driven by key developments. The Digital India initiative will further promote technology adoption, expanding access to 3D visualization tools across various sectors. Architectural firms are expected to increasingly embrace these technologies, with a projected adoption rate of 40% by 2025. The Indian gaming market is anticipated to grow at a CAGR of 22% from 2023 to 2026, significantly boosting demand for 3D visualization solutions. Educational institutions are prioritising 3D visualization in their curricula, ensuring a skilled workforce is ready to meet industry needs.
Market Segmentation Analysis
The analysis below covers each segmentation, its leading category in 2025 and its fastest-growing category through 2032.
By Solution Type – 3D Modeling Software Dominated, AR/VR Integration Expected to Grow Fastest
According to Shubham Deep, Research Manager at 6Wresearch, the largest solution type category in 2025 was 3D Modeling Software, with a 46% share of total revenue. 3D Modeling Software holds the largest share due to its essential role in creating detailed visual representations across various industries. For instance, over 50% of architectural firms in India rely on this software to enhance their design processes. AR/VR Integration is projected to grow fastest, at a CAGR of 9.3% during 2026–2032. AR/VR Integration is witnessing rapid growth, particularly in sectors like gaming and real estate, where it significantly enhances user engagement. The Indian gaming market, projected to grow at a CAGR of 22%, is a key driver of this expansion. Suppliers should focus on advancing AR/VR solutions to meet the increasing demands from the gaming and real estate sectors.
By Deployment Mode – Cloud-Based Dominated and Is Expected to Record the Fastest Growth
Cloud-Based held a 47% share of the India 3D Visualization Market by deployment mode in 2025. Cloud-Based solutions dominate the market share because they offer flexibility and cost-effectiveness, appealing to a diverse user base. This trend is highlighted by the fact that 70% of new software adoptions in India are cloud-based. Cloud-Based is also forecast to expand faster than any other category, at a CAGR of 9.1% over 2026–2032. Cloud-Based deployment is also the fastest-growing segment as it provides scalable resources and ease of access for users. This growth trend is expected to continue as more businesses embrace digital transformation initiatives. Buyers can anticipate a broader range of cloud-based solutions, leading to competitive pricing and enhanced features.
By Platform Type – Desktop Dominated, Web-Based Expected to Grow Fastest
In 2025, Desktop led the platform type split with a 42% share. Desktop platforms command the largest share in the 3D visualization market, primarily due to their capability to handle demanding software applications effectively. This traditional platform remains vital for professionals requiring substantial processing power for their projects. Over 2026–2032, Web-Based is expected to post the fastest growth, at a CAGR of 9.5%. Web-Based platforms are rapidly gaining traction, driven by their accessibility and user-friendly interfaces. The shift towards online solutions reflects a growing preference for more flexible working environments among users. Suppliers should invest in developing web-based solutions to cater to the rising demand for accessible 3D visualization tools.
By Distribution Channel – Online Subscription Dominated, Direct Sales Expected to Grow Fastest
Online Subscription took a 42% share of distribution channel in 2025, more than any other category. Online Subscription models lead the market share by offering lower upfront costs and flexible payment options that appeal to a wide range of users. This distribution method is increasingly favoured by various user groups seeking cost-effective software solutions. The quickest growth will come from Direct Sales, forecast to expand at a CAGR of 8.4% between 2026 and 2032. Direct Sales is the fastest-growing distribution channel, as it effectively reaches customers and offers tailored solutions. This approach enhances customer satisfaction through personalised interactions and support. Suppliers need to optimise their distribution strategies to incorporate both online subscriptions and direct sales for maximum market reach.
By End User Industry – Gaming Dominated, Architecture Expected to Grow Fastest
Gaming accounted for a 43% market share by end user industry in 2025. Gaming holds the largest share in the 3D visualization market, being a core component for game development and design. The Indian gaming industry, valued at approximately $1.8 billion, significantly drives this demand. Architecture is projected to grow fastest, at a CAGR of 8.5% during 2026–2032. Architecture is the fastest-growing end user industry, propelled by its critical role in the design and presentation of architectural projects. The sector is expected to adopt 3D visualization tools at a rate of 40% by 2025, indicating strong growth potential. Suppliers should concentrate on developing tailored solutions for the architectural sector to capitalise on its rapid growth.
Key Attractiveness of the Report
- 10 Years of Market Numbers
- Historical Data Starting from 2022 to 2025
- Base Year 2025
- Forecast Data until 2032
- Key Performance Indicators Impacting the Market
- Major Upcoming Developments and Projects
Key Highlights of the Report:
- India 3D Visualization Market Outlook
- Market Size of India 3D Visualization Market, 2025
- Forecast of India 3D Visualization Market, 2032
- Historical Data and Forecast of India 3D Visualization Revenues & Volume for the Period 2022 - 2032F
- India 3D Visualization Market Trend Evolution
- India 3D Visualization Market Drivers and Challenges
- India 3D Visualization Price Trends
- India 3D Visualization Porter's Five Forces
- India 3D Visualization Industry Life Cycle
- Historical Data and Forecast of India 3D Visualization Market Revenues & Volume By Solution Type for the Period 2022 - 2032F
- Historical Data and Forecast of India 3D Visualization Market Revenues & Volume By 3D Modeling Software for the Period 2022 - 2032F
- Historical Data and Forecast of India 3D Visualization Market Revenues & Volume By Simulation Software for the Period 2022 - 2032F
- Historical Data and Forecast of India 3D Visualization Market Revenues & Volume By AR/VR Integration for the Period 2022 - 2032F
- Historical Data and Forecast of India 3D Visualization Market Revenues & Volume By CAD Tools for the Period 2022 - 2032F
- Historical Data and Forecast of India 3D Visualization Market Revenues & Volume By Deployment Mode for the Period 2022 - 2032F
- Historical Data and Forecast of India 3D Visualization Market Revenues & Volume By On-Premise for the Period 2022 - 2032F
- Historical Data and Forecast of India 3D Visualization Market Revenues & Volume By Cloud-Based for the Period 2022 - 2032F
- Historical Data and Forecast of India 3D Visualization Market Revenues & Volume By Hybrid for the Period 2022 - 2032F
- Historical Data and Forecast of India 3D Visualization Market Revenues & Volume By SaaS for the Period 2022 - 2032F
- Historical Data and Forecast of India 3D Visualization Market Revenues & Volume By Platform Type for the Period 2022 - 2032F
- Historical Data and Forecast of India 3D Visualization Market Revenues & Volume By Desktop for the Period 2022 - 2032F
- Historical Data and Forecast of India 3D Visualization Market Revenues & Volume By Mobile for the Period 2022 - 2032F
- Historical Data and Forecast of India 3D Visualization Market Revenues & Volume By VR Headsets for the Period 2022 - 2032F
- Historical Data and Forecast of India 3D Visualization Market Revenues & Volume By Web-Based for the Period 2022 - 2032F
- Historical Data and Forecast of India 3D Visualization Market Revenues & Volume By Distribution Channel for the Period 2022 - 2032F
- Historical Data and Forecast of India 3D Visualization Market Revenues & Volume By Direct Sales for the Period 2022 - 2032F
- Historical Data and Forecast of India 3D Visualization Market Revenues & Volume By Online Subscription for the Period 2022 - 2032F
- Historical Data and Forecast of India 3D Visualization Market Revenues & Volume By Specialized Resellers for the Period 2022 - 2032F
- Historical Data and Forecast of India 3D Visualization Market Revenues & Volume By B2B Platforms for the Period 2022 - 2032F
- Historical Data and Forecast of India 3D Visualization Market Revenues & Volume By End User Industry for the Period 2022 - 2032F
- Historical Data and Forecast of India 3D Visualization Market Revenues & Volume By Film & Animation for the Period 2022 - 2032F
- Historical Data and Forecast of India 3D Visualization Market Revenues & Volume By Gaming for the Period 2022 - 2032F
- Historical Data and Forecast of India 3D Visualization Market Revenues & Volume By Real Estate for the Period 2022 - 2032F
- Historical Data and Forecast of India 3D Visualization Market Revenues & Volume By Architecture for the Period 2022 - 2032F
- India 3D Visualization Import Export Trade Statistics
- Market Opportunity Assessment By Solution Type
- Market Opportunity Assessment By Deployment Mode
- Market Opportunity Assessment By Platform Type
- Market Opportunity Assessment By Distribution Channel
- Market Opportunity Assessment By End User Industry
- India 3D Visualization Top Companies Market Share
- India 3D Visualization Competitive Benchmarking By Technical and Operational Parameters
- India 3D Visualization Company Profiles
- India 3D Visualization Key Strategic Recommendations
Market Covered
This report examines the market across the segments below.
By Solution Type
- 3D Modeling Software
- Simulation Software
- AR/VR Integration
- CAD Tools
By Deployment Mode
- On-Premise
- Cloud-Based
- Hybrid
- SaaS
By Platform Type
- Desktop
- Mobile
- VR Headsets
- Web-Based
By Distribution Channel
- Direct Sales
- Online Subscription
- Specialized Resellers
- B2B Platforms
By End User Industry
- Film & Animation
- Gaming
- Real Estate
- Architecture































