India Agricultural Repellents Market Size & Growth Rate
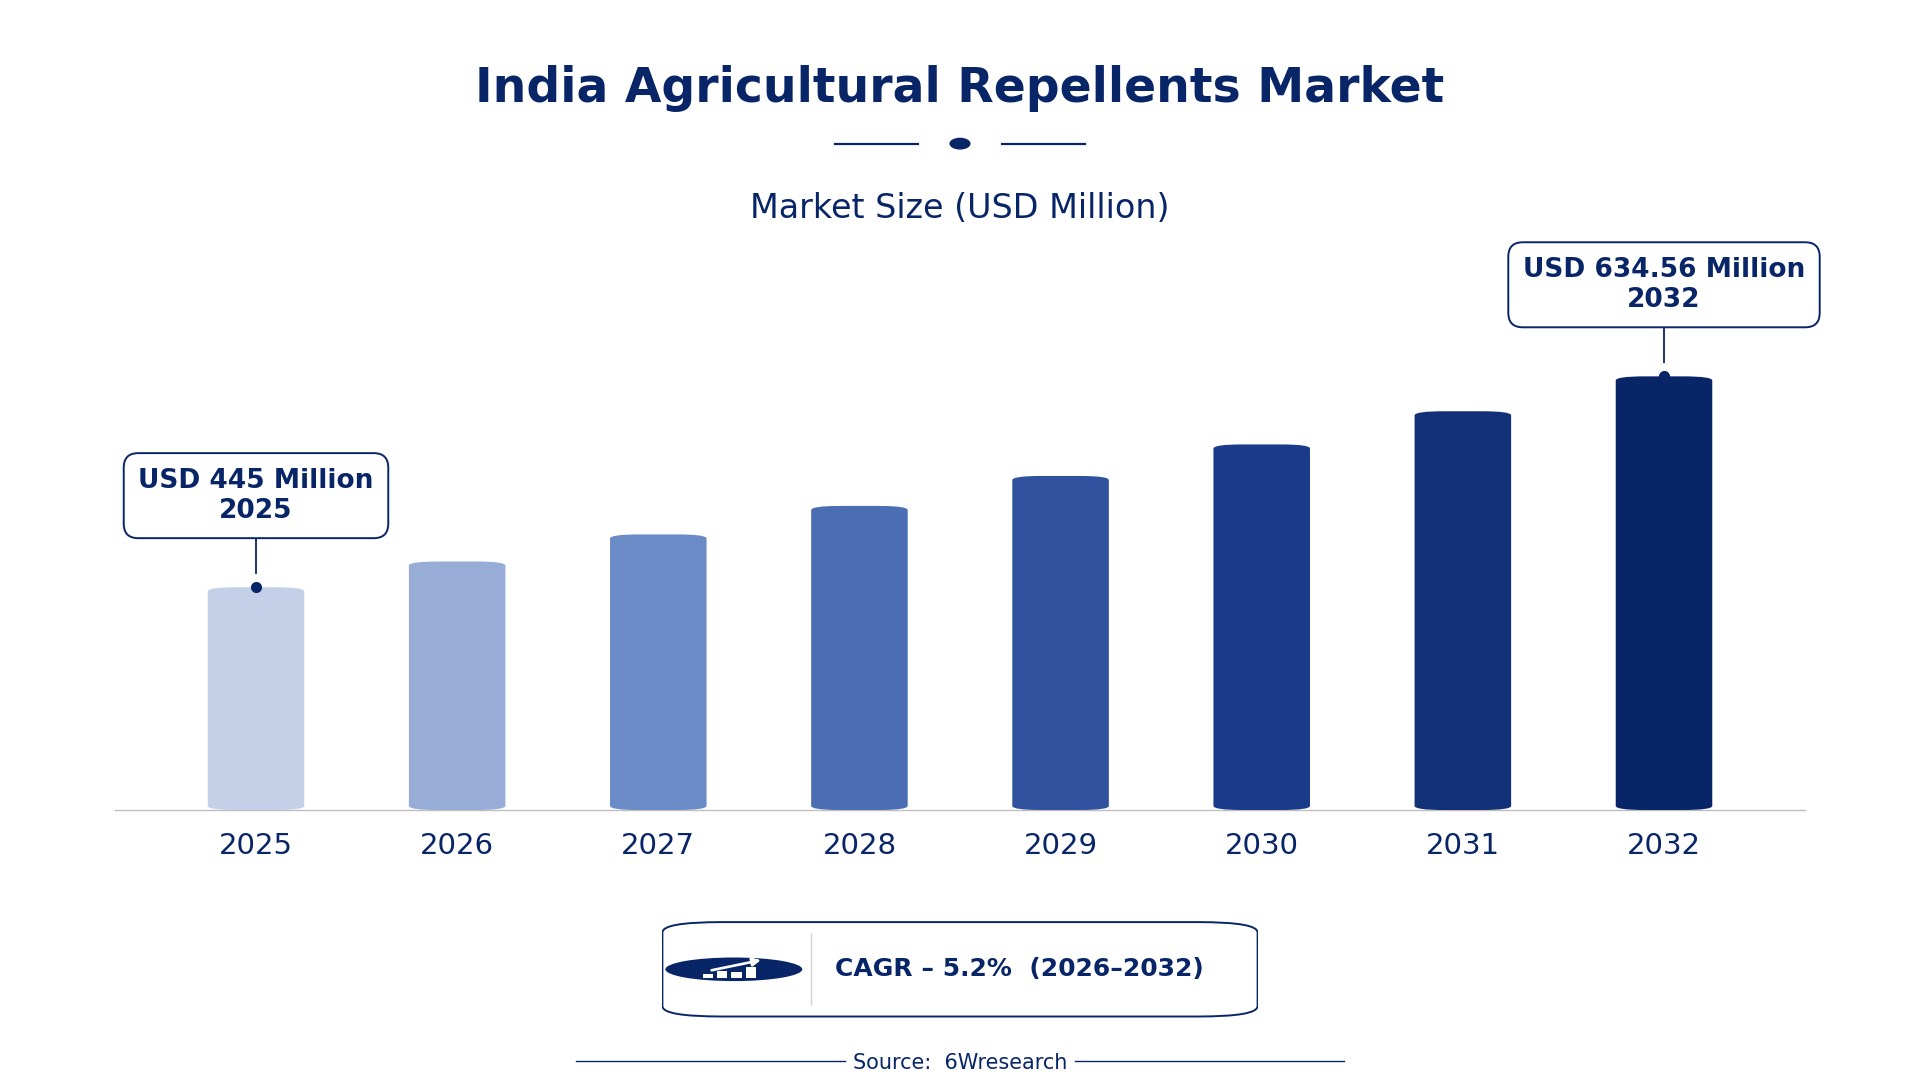
According to 6Wresearch internal database and industry insights, the India Agricultural Repellents Market was valued at USD 445.0 million in 2025 and is projected to reach USD 634.56 million by 2032, growing at a CAGR of approximately 5.2% during 2026–2032.
India Agricultural Repellents Market Highlights
| Report Metric | Details |
| Report Name | India Agricultural Repellents Market |
| Market Size 2025 | USD 445.0 million |
| Market Size 2032 | USD 634.56 million |
| Absolute Growth 2025–2032 | USD 189.56 million |
| CAGR 2026–2032 | 5.2% |
| Peak Annual Growth | 7.4% in 2032 |
| Forecast Period | 2026–2032 |
| Historical Data | 2022–2025 |
| Base Year | 2025 |
| Leading Agricultural Repellents Market, 2025 | Chemical Repellents (32% share) |
| Leading Product Type, 2025 | Insects (43% share) |
| Leading Target Type, 2025 | Agri Retailers (48% share) |
| Leading Distribution Channel, 2025 | Crop Growers (40% share) |
| Fastest-Growing Agricultural Repellents Market | Natural Repellents (7.7% CAGR) |
| Fastest-Growing Product Type | Herbivores (7.1% CAGR) |
| Fastest-Growing Target Type | Online Platforms (7.1% CAGR) |
| Fastest-Growing Distribution Channel | Organic Farms (6.6% CAGR) |
| Growing Sector | Organic Farms |
| Key End Users | Crop Growers, Organic Farms, Horticulture Units, Grain Storage Sites |
India Agricultural Repellents Market Year-wise Growth Rate and Key Drivers (2022–2032)
This graph illustrates the annual growth rates of the market from 2022 to 2032, highlighting a steady upward trajectory and projected market expansion over the forecast period.
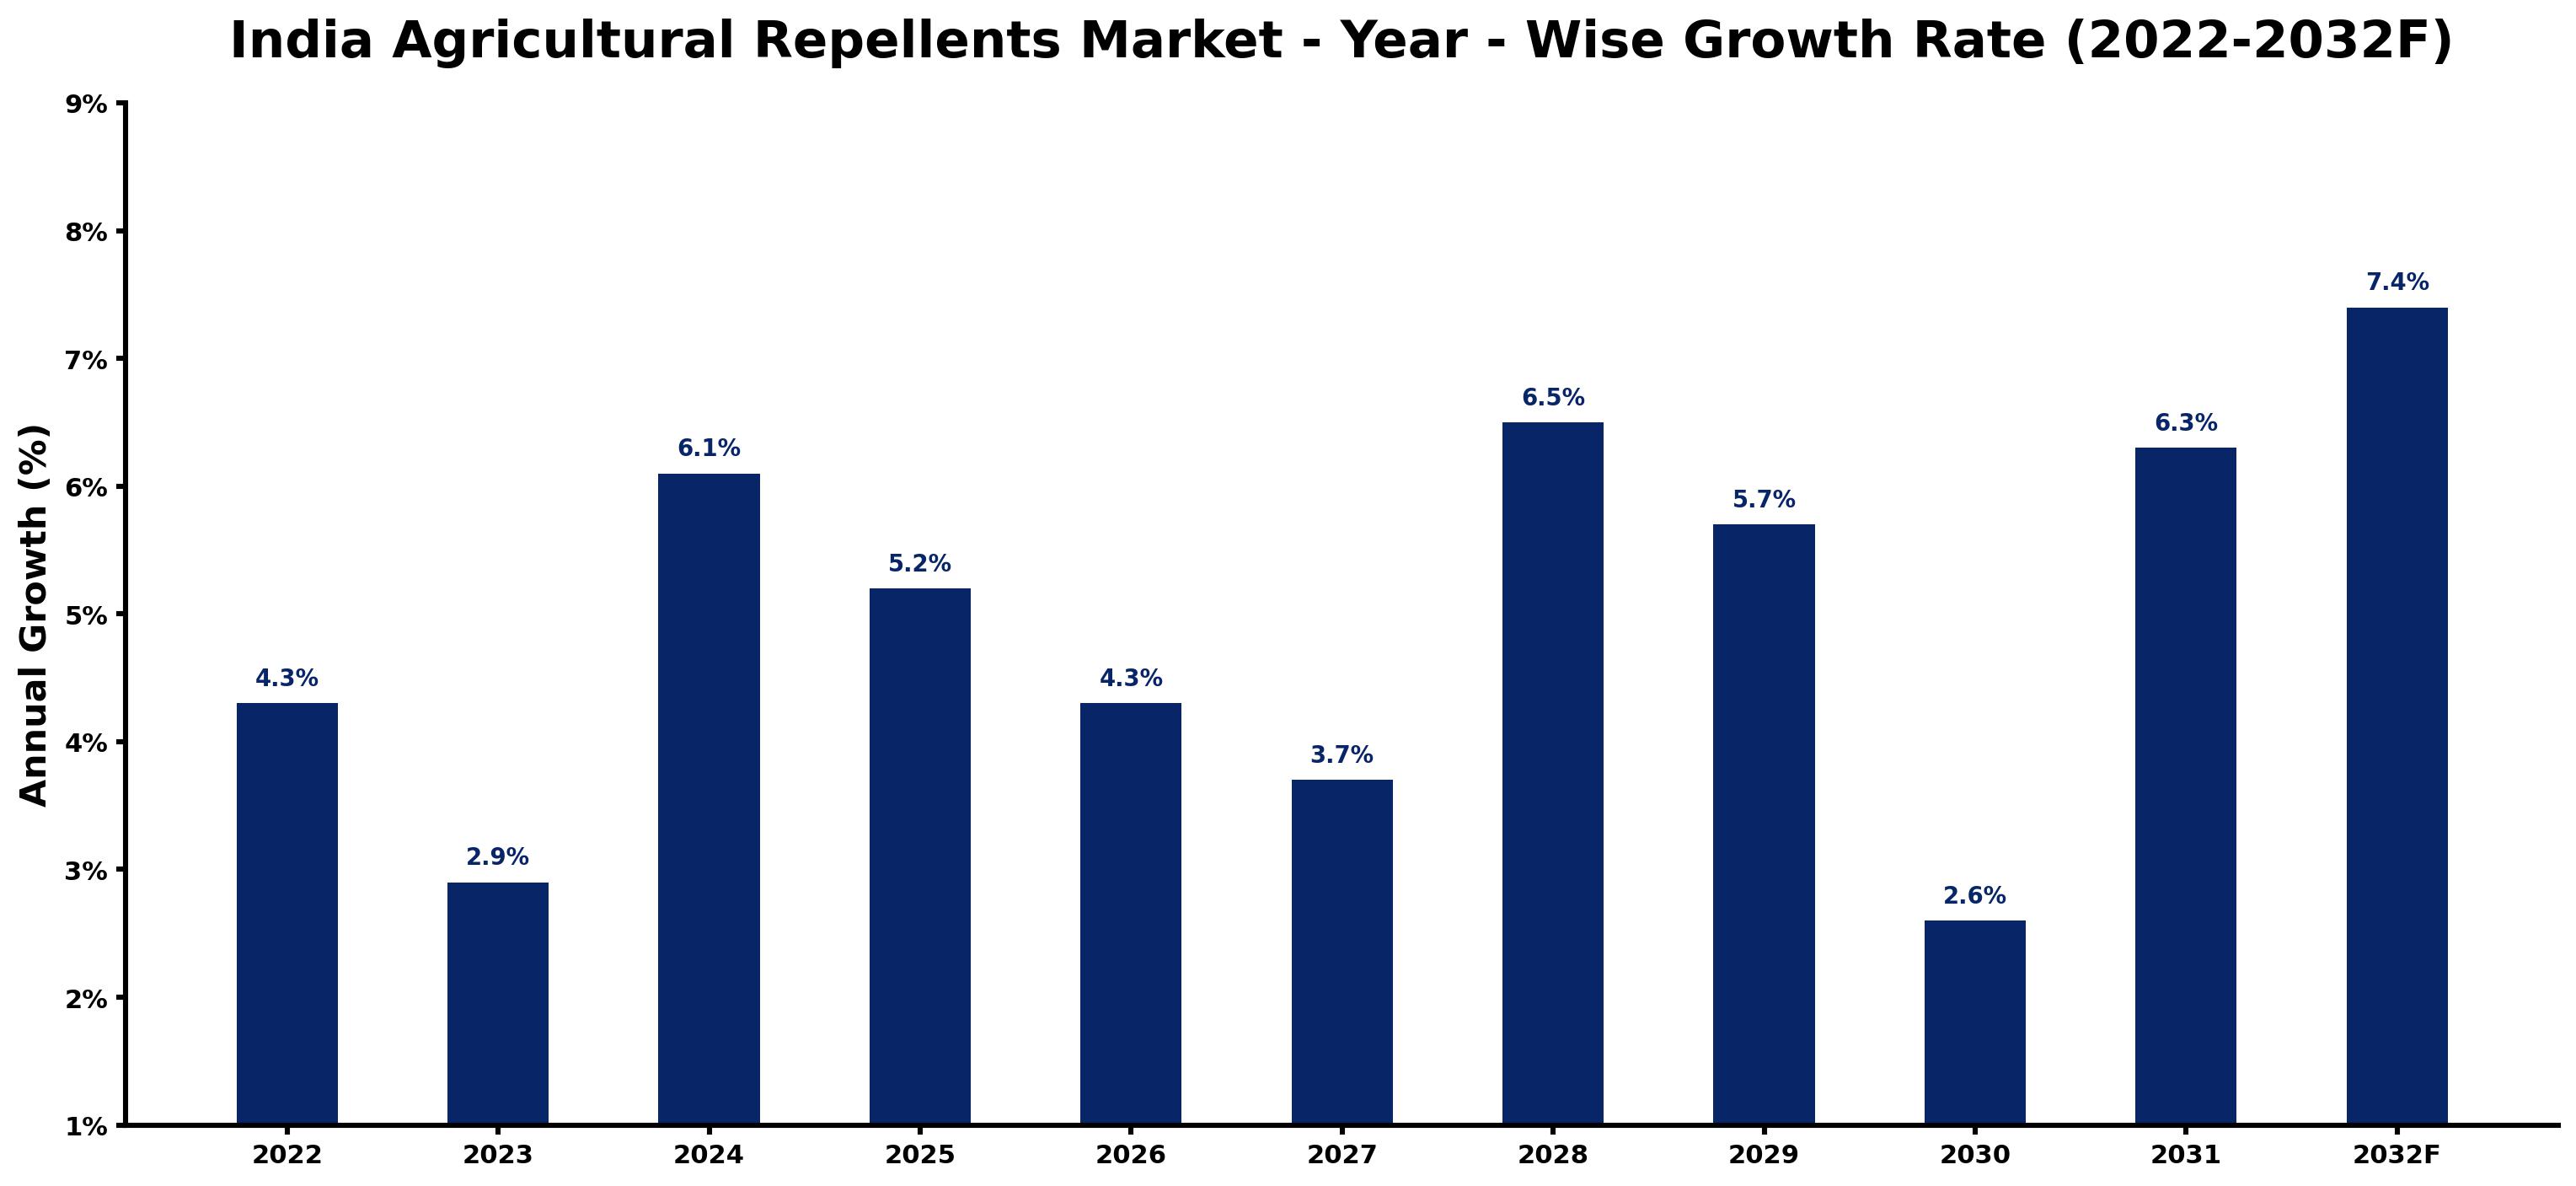
The following table presents the estimated annual growth rate for each year together with the principal factor influencing market performance.
| Year | Estimated Annual Growth (%) | Market Rationale |
| 2022 | 4.3 | The market experienced steady growth due to strong demand from the agricultural sector. |
| 2023 | 2.9 | Growth slowed as farmers adjusted to changing pest management practices and market conditions. |
| 2024 | 6.1 | Increased adoption of chemical repellents drove faster growth as pest pressures intensified. |
| 2025 | 5.2 | A shift towards sustainable practices slowed growth, but demand for effective solutions remained strong. |
| 2026 | 4.3 | Market growth slowed further as farmers explored alternative pest management strategies. |
| 2027 | 3.7 | Demand continued to slow as farmers faced challenges in sourcing effective repellents. |
| 2028 | 6.5 | Growth accelerated again as organic farming practices gained traction among farmers. |
| 2029 | 5.7 | A slight slowdown occurred as the market adjusted to new pest control methods. |
| 2030 | 2.6 | Growth slowed as farmers faced regulatory changes impacting pesticide usage. |
| 2031 | 6.3 | Increased focus on eco-friendly solutions drove growth as farmers sought safer alternatives. |
| 2032 | 7.4 | The market peaked as investments in sustainable agriculture and organic practices surged. |
Note: Market size estimations and growth projections presented in this report are based on 6Wresearch's proprietary forecasting methodology, utilizing the latest available industry data, government publications, and primary research inputs.
India Agricultural Repellents Market Synopsis
The India Agricultural Repellents Market includes substances designed to deter pests from crops, produced through both natural and synthetic methods. These repellents safeguard crops from herbivores, insects, birds, and rodents. The market is growing due to increasing demand from domestic users and support for organic farming initiatives. The agricultural sector contributes around 17-18% to GDP, with more than 140 million hectares of arable land available. As the uptake of natural repellents rises, the market is expected to expand significantly in the coming years.
Market Dynamics Impact Analysis (2026–2032)
| Factor | Type | Impact | Primary Segment Affected |
| Rising adoption of organic farming practices | Driver | High | Natural Repellents |
| Increased pest pressures leading to higher repellent usage | Driver | High | Chemical Repellents |
| Growing demand for eco-friendly pest management solutions | Opportunity | High | Natural Repellents |
| Expansion of online platforms for agricultural products | Opportunity | Medium | Agri Retailers |
| Regulatory challenges affecting pesticide usage | Restraint | High | Chemical Repellents |
| Limited awareness of effective pest control methods | Restraint | Medium | Natural Repellents |
| The Agricultural Repellents market in India faces a few practical problems, including sourcing issues. | Challenge | High | Chemical Repellents |
| High costs associated with developing and marketing new repellents | Challenge | Medium | Natural Repellents |
Evaluation of Drivers in India Agricultural Repellents Market (2026–2032)
The table below links each growth driver to the segment it affects and the evidence for it.
| Drivers | Primary Segment Affected | Why It Matters (Evidence) |
| Increased investment in organic farming initiatives | Natural Repellents | The growth of organic farming to 2 million hectares boosts demand for natural repellents, increasing market potential. |
| Growing pest pressures in agriculture | Chemical Repellents | Chemical repellents account for over 60% of usage, remaining essential for effective pest control in various crops. |
| Support from government programs for sustainable agriculture | Natural Repellents | The 'Paramparagat Krishi Vikas Yojana' promotes organic practices, increasing the adoption of natural repellents among farmers. |
| Rising population of farmers seeking effective solutions | Chemical Repellents | Approximately 150 million farmers drive demand for effective pest management products, particularly in conventional farming. |
| Increased focus on sustainable pest management practices | Natural Repellents | The 'Integrated Pest Management Programme' encourages eco-friendly methods, boosting the demand for natural repellent products. |
The agricultural sector, contributing 17-18% to GDP, relies on effective pest management solutions. With chemical repellents dominating over 60% of the market, farmers are increasingly seeking effective products. The 'Paramparagat Krishi Vikas Yojana' promotes organic practices, boosting the use of natural repellents. An estimated 150 million farmers actively seek solutions to combat pest issues, further driving the market's growth.
Evaluation of Restraints in India Agricultural Repellents Market
The main factors holding the market back are set out below.
| Market Restraint | Primary Segment Affected | Why It Matters (Evidence) |
| Limited access to agricultural education hinders effective pest management training. | Natural Repellents | Farmers lack training, leading to inefficient use of natural repellents and potential crop losses. |
| Underutilisation of natural alternatives due to limited access to effective formulations. | Chemical Repellents | Farmers rely heavily on chemical repellents, delaying pest control responses and impacting yields. |
| Strict guidelines from the Bureau of Indian Standards slow product approvals. | Ultrasonic Repellents | New products can take up to six months to enter the market, delaying pest management solutions. |
| Fluctuating demand in organic farming complicates supply chain planning. | Scent-Based Repellents | Buyers face challenges in maintaining stock levels, leading to overstocking or shortages. |
| Higher costs associated with ultrasonic repellents limit their adoption. | Ultrasonic Repellents | Farmers may opt for cheaper chemical alternatives, reducing market growth for this sub-segment. |
India Agricultural Repellents Market Challenges
Buyers in the India Agricultural Repellents Market encounter a skills gap, as many farmers lack training in effective pest management techniques, resulting in inefficient use of repellents. This challenge arises from limited access to agricultural education, leading to potential crop losses of up to 30%. Technology adoption remains another hurdle; while chemical repellents dominate the market, natural alternatives are underutilised due to restricted access to effective formulations. This dependence on outdated methods can delay pest control responses, adversely affecting crop yields. Regulatory compliance adds to the difficulties; stringent guidelines from the Bureau of Indian Standards can slow product approvals, causing delays in market entry for new repellents, with some products taking up to six months to launch. Buyers also face fluctuating demand, particularly in organic farming, complicating supply chain planning and resulting in overstocking or shortages that disrupt operations.
Trends in the India Agricultural Repellents Market
The trends below show where the India Agricultural Repellents Market is heading.
- Shift towards Organic Farming in Maharashtra: Maharashtra is increasingly adopting organic farming practices, with 2 million hectares now dedicated to organic crops. This shift is driving demand for natural repellents, crucial for maintaining organic standards.
- Increase in Online Sales Channels for Agricultural Products: In 2023, online platforms accounted for a growing share of agricultural product sales, with a 7.1% CAGR projected. This trend offers new opportunities for suppliers of agricultural repellents to connect directly with farmers.
- Focus on Sustainable Pest Management since 2021: The 'National Mission on Sustainable Agriculture' initiated in 2021 encourages research on eco-friendly pest control methods. This focus is leading to increased adoption of effective agricultural repellents.
- Rise in Rodent Repellent Demand in Grain Storage Sites: Grain storage sites are increasingly facing rodent issues, leading to a surge in demand for effective rodent repellents. This trend highlights the need for specialised products in pest management.
Investment Opportunities in the India Agricultural Repellents Market
Below are the investment opportunities with the strongest case in the India Agricultural Repellents Market.
- Joint Ventures with Local Farmers: Collaborating with local farmers through joint ventures can improve access to the agricultural market. With the organic farming sector growing to 2 million hectares, suppliers can tap into this expanding market.
- Investment in Research and Development: Investing in research and development for effective pest control solutions is crucial now, as demand for reliable products rises. The growing population of farmers seeking effective solutions creates a ripe opportunity.
- Focus on Horticulture Units: Horticulture units in states like Maharashtra are significant users of repellents. Targeting this sector can yield substantial returns as demand for effective pest management increases.
- Expansion into Online Sales Channels: With online platforms gaining traction, suppliers can enter the market by establishing a strong online presence. This approach allows for direct engagement with farmers and increased sales.
Government Initiatives in the India Agricultural Repellents Market
The 'Paramparagat Krishi Vikas Yojana' by the Ministry of Agriculture aims to promote organic farming, increasing the use of natural repellents, launched in 2020. This initiative encourages farmers to adopt organic practices, thereby boosting the demand for natural pest control solutions. By supporting sustainable agriculture, the programme helps improve the overall health of the agricultural sector, contributing to economic growth.
In 2023, the Indian Council of Agricultural Research launched a programme for sustainable pest management, focusing on eco-friendly practices. The Ministry of Agriculture oversees this initiative, which aims to improve pest control methods while reducing reliance on harmful chemicals. By funding research and development, the programme seeks to promote effective solutions that align with environmental sustainability goals.
Future Insight of the India Agricultural Repellents Market
The India Agricultural Repellents Market is set for substantial change by 2032, driven by several key factors. The government's Paramparagat Krishi Vikas Yojana will likely expand organic farming practices, increasing the area under natural repellent usage to over 3 million hectares. Advances in pest management technology will enhance the effectiveness of repellents, making them more attractive to farmers. The Indian Council of Agricultural Research's sustainable pest management programme will promote effective pest control methods. Buyers will benefit from a broader selection of reliable products, while suppliers will find new opportunities in a rapidly evolving market.
Market Segmentation Analysis
The analysis below covers each segmentation, its leading category in 2025 and its fastest-growing category through 2032.
By Agricultural Repellents Market – Chemical Repellents Dominated, Natural Repellents Expected to Grow Fastest
According to Ravi Bhandari, Research Head at 6Wresearch, Chemical Repellents took a 32% share of agricultural repellents market in 2025, more than any other category. Chemical repellents hold the largest market share due to their extensive use in conventional agriculture, where they are favoured for their effectiveness against a wide range of pests. This is particularly evident in states with significant arable land, where farmers rely heavily on these products for crop protection. The quickest growth will come from Natural Repellents, forecast to expand at a CAGR of 7.7% between 2026 and 2032. Natural repellents are experiencing rapid growth as organic farming expands, now covering over 2 million hectares in India. Government initiatives promoting organic practices further fuel this trend, ensuring that demand for these products continues to rise. This indicates that suppliers should focus on developing and marketing natural repellents to cater to the increasing organic farming sector.
By Product Type – Insects Dominated, Herbivores Expected to Grow Fastest
Insects held a 43% share of the India Agricultural Repellents Market by product type in 2025. Insects are the leading segment in the agricultural repellents market, primarily targeted by most pest control products. The emphasis on managing insect populations is vital for maintaining crop health and maximising yields. Over 2026–2032, Herbivores are expected to post the fastest growth, at a CAGR of 7.1%. Herbivores represent the fastest-growing segment, driven by increasing concerns over larger pests like deer and rabbits that threaten crops. This trend underscores the necessity for more effective solutions to protect agricultural investments. Buyers should explore diversified pest control strategies that include effective herbivore repellents to ensure crop protection.
By Target Type – Agri Retailers Dominated, Online Platforms Expected to Grow Fastest
Agri Retailers accounted for a 48% market share by target type in 2025. Agri retailers dominate the target type segment, serving as the main distribution channels for agricultural repellents across India. Their established relationships with farmers facilitate a consistent supply of these essential products, making them a crucial part of the market. Online Platforms are set to record the highest CAGR in this split, 7.1% over 2026–2032. Online platforms are quickly becoming the fastest-growing purchasing method, reflecting a shift in farmers' preferences towards convenience and access to a wider range of products. This trend highlights the increasing acceptance of digital solutions in the agricultural sector. Suppliers need to enhance their online presence to effectively reach and engage with the growing number of tech-savvy farmers.
By Distribution Channel – Crop Growers Dominated, Organic Farms Expected to Grow Fastest
With a 40% revenue share in 2025, Crop Growers was the largest distribution channel category. Crop growers represent the largest distribution channel, as they are the primary users of agricultural repellents for effective pest management. Their direct engagement with the products ensures a consistent demand in the market. Organic Farms are projected to grow fastest, at a CAGR of 6.6% during 2026–2032. Organic farms are the fastest-growing distribution channel, driven by the rising popularity of organic produce and sustainable farming practices. This growth signals a shift towards more eco-friendly pest control solutions. Suppliers should prioritise partnerships with organic farms to tap into this expanding market segment.
Key Attractiveness of the Report
- 10 Years of Market Numbers
- Historical Data Starting from 2022 to 2025
- Base Year 2025
- Forecast Data until 2032
- Key Performance Indicators Impacting the Market
- Major Upcoming Developments and Projects
Key Highlights of the Report:
- India Agricultural Repellents Market Outlook
- Market Size of India Agricultural Repellents Market, 2025
- Forecast of India Agricultural Repellents Market, 2032
- Historical Data and Forecast of India Agricultural Repellents Revenues & Volume for the Period 2022 - 2032F
- India Agricultural Repellents Market Trend Evolution
- India Agricultural Repellents Market Drivers and Challenges
- India Agricultural Repellents Price Trends
- India Agricultural Repellents Porter's Five Forces
- India Agricultural Repellents Industry Life Cycle
- Historical Data and Forecast of India Agricultural Repellents Market Revenues & Volume By Agricultural Repellents Market for the Period 2022 - 2032F
- Historical Data and Forecast of India Agricultural Repellents Market Revenues & Volume By Natural Repellents for the Period 2022 - 2032F
- Historical Data and Forecast of India Agricultural Repellents Market Revenues & Volume By Chemical Repellents for the Period 2022 - 2032F
- Historical Data and Forecast of India Agricultural Repellents Market Revenues & Volume By Ultrasonic Repellents for the Period 2022 - 2032F
- Historical Data and Forecast of India Agricultural Repellents Market Revenues & Volume By Scent-Based Repellents for the Period 2022 - 2032F
- Historical Data and Forecast of India Agricultural Repellents Market Revenues & Volume By Product Type for the Period 2022 - 2032F
- Historical Data and Forecast of India Agricultural Repellents Market Revenues & Volume By Herbivores for the Period 2022 - 2032F
- Historical Data and Forecast of India Agricultural Repellents Market Revenues & Volume By Insects for the Period 2022 - 2032F
- Historical Data and Forecast of India Agricultural Repellents Market Revenues & Volume By Birds for the Period 2022 - 2032F
- Historical Data and Forecast of India Agricultural Repellents Market Revenues & Volume By Rodents for the Period 2022 - 2032F
- Historical Data and Forecast of India Agricultural Repellents Market Revenues & Volume By Target Type for the Period 2022 - 2032F
- Historical Data and Forecast of India Agricultural Repellents Market Revenues & Volume By Online Platforms for the Period 2022 - 2032F
- Historical Data and Forecast of India Agricultural Repellents Market Revenues & Volume By Agri Retailers for the Period 2022 - 2032F
- Historical Data and Forecast of India Agricultural Repellents Market Revenues & Volume By Direct Sales for the Period 2022 - 2032F
- Historical Data and Forecast of India Agricultural Repellents Market Revenues & Volume By Specialty Stores for the Period 2022 - 2032F
- Historical Data and Forecast of India Agricultural Repellents Market Revenues & Volume By Distribution Channel for the Period 2022 - 2032F
- Historical Data and Forecast of India Agricultural Repellents Market Revenues & Volume By Organic Farms for the Period 2022 - 2032F
- Historical Data and Forecast of India Agricultural Repellents Market Revenues & Volume By Crop Growers for the Period 2022 - 2032F
- Historical Data and Forecast of India Agricultural Repellents Market Revenues & Volume By Horticulture Units for the Period 2022 - 2032F
- Historical Data and Forecast of India Agricultural Repellents Market Revenues & Volume By Grain Storage Sites for the Period 2022 - 2032F
- India Agricultural Repellents Import Export Trade Statistics
- Market Opportunity Assessment By Agricultural Repellents Market
- Market Opportunity Assessment By Product Type
- Market Opportunity Assessment By Target Type
- Market Opportunity Assessment By Distribution Channel
- India Agricultural Repellents Top Companies Market Share
- India Agricultural Repellents Competitive Benchmarking By Technical and Operational Parameters
- India Agricultural Repellents Company Profiles
- India Agricultural Repellents Key Strategic Recommendations
Market Covered
Segments analysed in this report are listed below.
By Agricultural Repellents Market
- Natural Repellents
- Chemical Repellents
- Ultrasonic Repellents
- Scent-Based Repellents
By Product Type
- Herbivores
- Insects
- Birds
- Rodents
By Target Type
- Online Platforms
- Agri Retailers
- Direct Sales
- Specialty Stores
By Distribution Channel
- Organic Farms
- Crop Growers
- Horticulture Units
- Grain Storage Sites































