India Industrial Visualization Market Size & Growth Rate
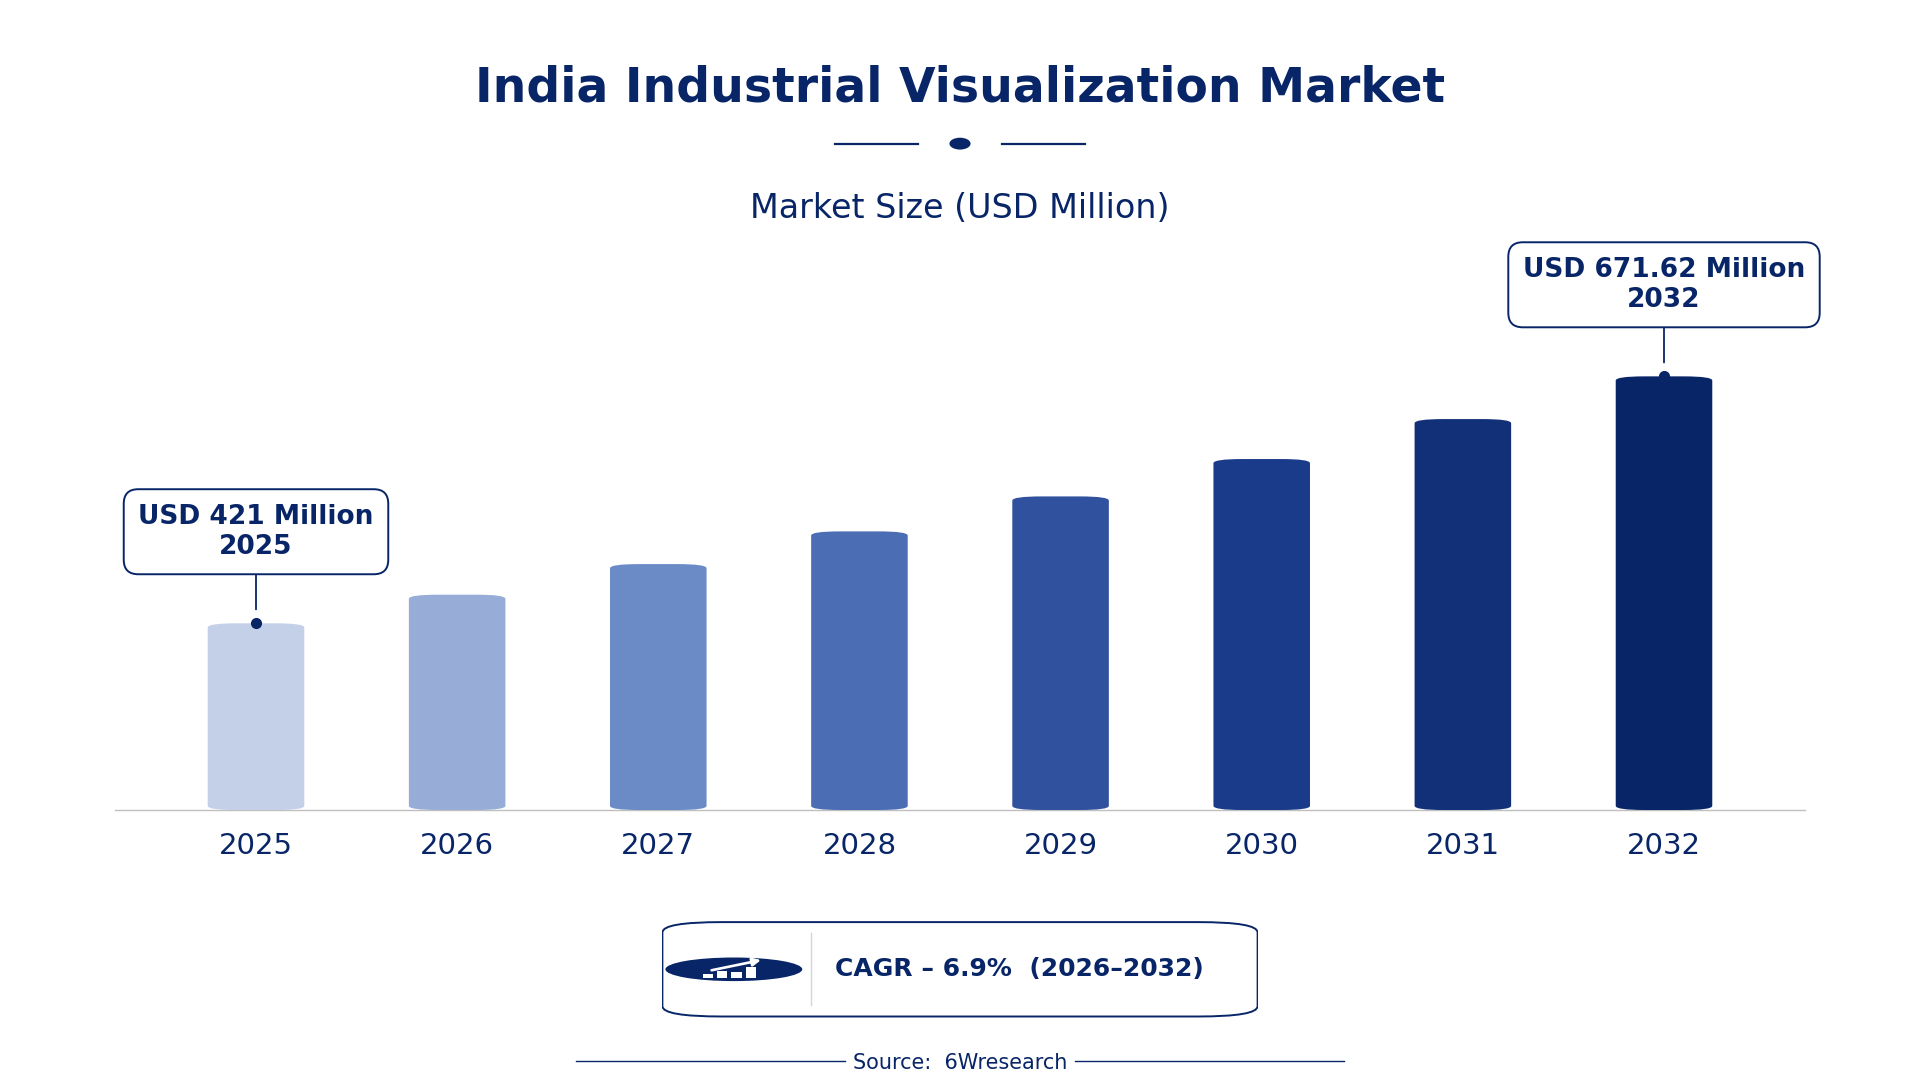
According to 6Wresearch internal database and industry insights, the India Industrial Visualization Market was valued at USD 421.0 million in 2025 and is projected to reach USD 671.62 million by 2032, growing at a CAGR of approximately 6.9% during 2026–2032.
India Industrial Visualization Market Highlights
| Report Metric | Details |
| Report Name | India Industrial Visualization Market |
| Market Size 2025 | USD 421.0 million |
| Market Size 2032 | USD 671.62 million |
| Absolute Growth 2025–2032 | USD 250.62 million |
| CAGR 2026–2032 | 6.9% |
| Peak Annual Growth | 9.1% in 2029 |
| Forecast Period | 2026–2032 |
| Historical Data | 2022–2025 |
| Base Year | 2025 |
| Leading Product Type, 2025 | SCADA Visualization (52% share) |
| Leading Visualization Tech, 2025 | Real-time Dashboards (36% share) |
| Leading Application, 2025 | Utilities Control (51% share) |
| Leading Distribution Channel, 2025 | Direct SaaS (44% share) |
| Fastest-Growing Product Type | AR/VR Visual Tools (9.5% CAGR) |
| Fastest-Growing Visualization Tech | IoT-Based (8.3% CAGR) |
| Fastest-Growing Application | Maintenance Training (8.9% CAGR) |
| Growing Sector | Manufacturing |
| Key End Users | Manufacturers, Utility Companies, Training Providers, Technology Integrators |
India Industrial Visualization Market Year-wise Growth Rate and Key Drivers (2022–2032)
This graph illustrates the annual growth rates of the market from 2022 to 2032, highlighting a steady upward trajectory and projected market expansion over the forecast period.
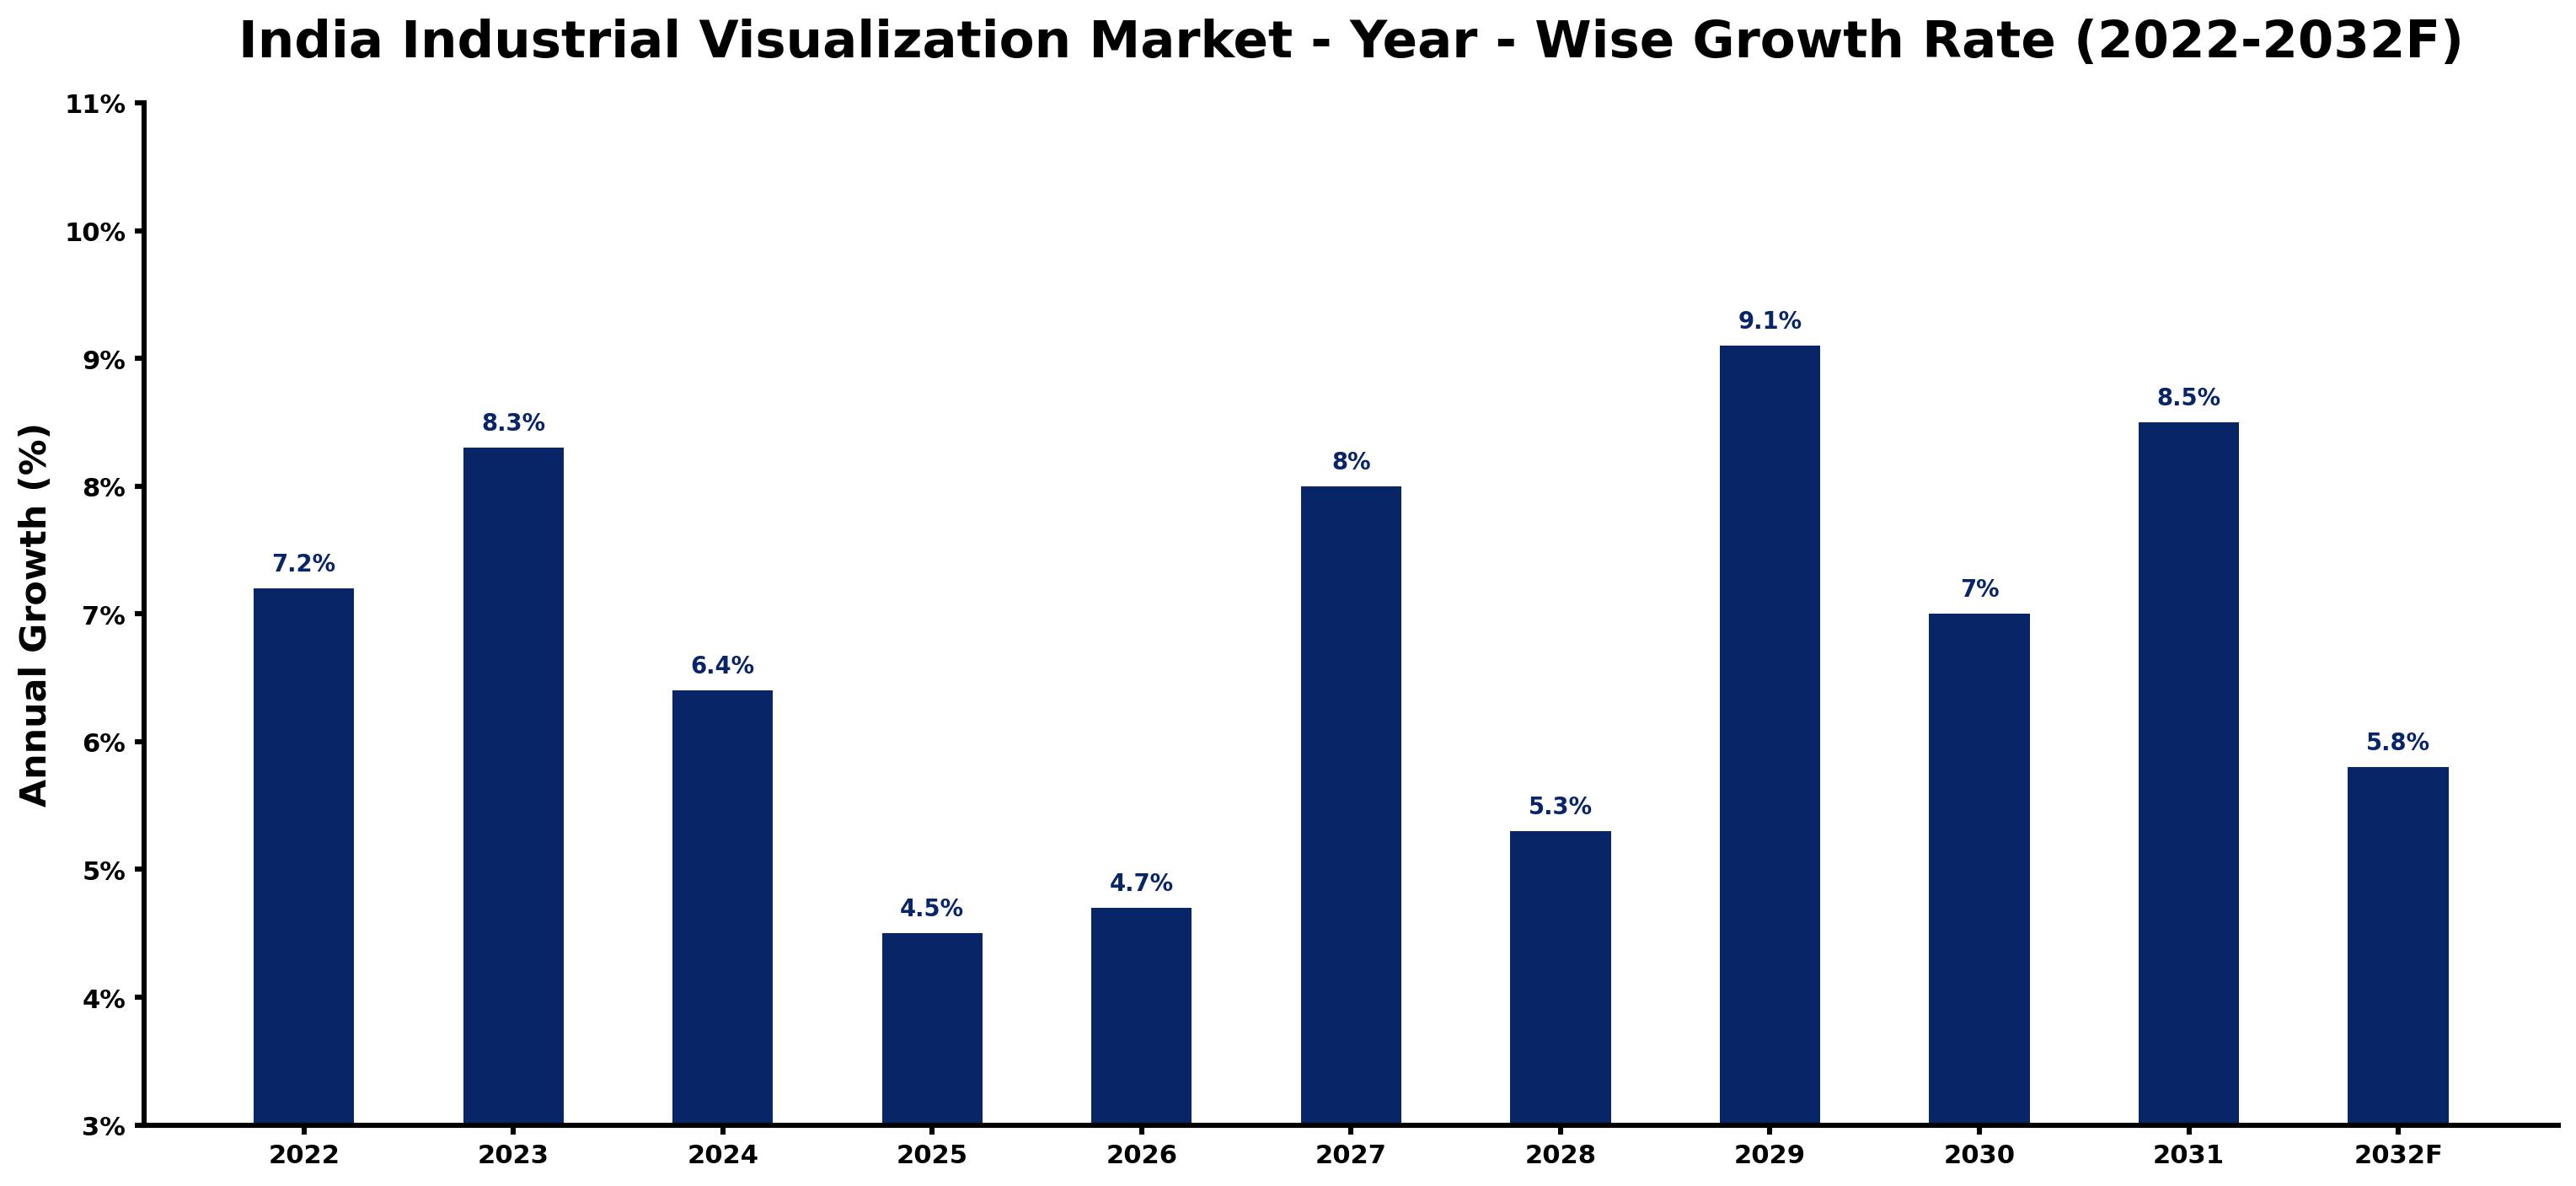
The following table presents the estimated annual growth rate for each year together with the principal factor influencing market performance.
| Year | Estimated Annual Growth (%) | Market Rationale |
| 2022 | 7.2 | The market experienced steady growth due to increasing investments in the Digital India initiative. |
| 2023 | 8.3 | Demand surged as the installed base of SCADA systems exceeded 20,000 units, improving monitoring capabilities. |
| 2024 | 6.4 | Growth slowed as companies adjusted to new automation technologies and standards in industrial processes. |
| 2025 | 4.5 | A further slowdown occurred as the market matured and competition intensified in the visualization sector. |
| 2026 | 4.7 | Growth is expected to resume with rising interest in IoT-based visualization solutions for smart factories. |
| 2027 | 8.0 | Demand is projected to increase as AR/VR training tools gain traction in industrial applications. |
| 2028 | 5.3 | The market is expected to see a slowdown as firms focus on optimizing existing systems and technologies. |
| 2029 | 9.1 | A peak in growth will be driven by substantial investments in Industry 4.0 technologies across sectors. |
| 2030 | 7.0 | Growth is projected to slow as the market stabilizes after rapid expansion in visualization technologies. |
| 2031 | 8.5 | A renewed interest in visualization tools will spur demand as industries modernize their operations. |
| 2032 | 5.8 | Growth will continue but at a slower pace as market saturation begins to set in. |
Note: Market size estimations and growth projections presented in this report are based on 6Wresearch's proprietary forecasting methodology, utilizing the latest available industry data, government publications, and primary research inputs.
India Industrial Visualization Market Synopsis
Industrial Visualization in India encompasses technologies that improve the representation of industrial processes, including SCADA and AR/VR tools. These systems are primarily used for monitoring, control, and training in manufacturing and utilities. The India Industrial Visualization Market is growing due to increasing investments in smart manufacturing and automation. The Digital India initiative, with an investment of ₹1,000 crore, is a key driver of this growth. As of 2023, the demand for AR/VR training tools is projected to increase by 30% by 2025, highlighting the market's potential.
Market Dynamics Impact Analysis (2026–2032)
| Factor | Type | Impact | Primary Segment Affected |
| Growing demand for real-time monitoring and control solutions | Driver | High | SCADA Visualization |
| Increased adoption of AR/VR tools for immersive training | Driver | High | AR/VR Visual Tools |
| Investment in smart manufacturing technologies | Opportunity | High | Data Dashboards |
| Expansion of smart cities integrating advanced visualization tools | Opportunity | High | Utilities Control |
| Limited awareness of advanced visualization technologies | Restraint | Medium | 3D Plant Models |
| High initial costs of implementing visualization systems | Restraint | Medium | IoT-Based |
| Fragmented market with varying standards | Challenge | Medium | SCADA Visualization |
| Resistance to change from traditional practices | Challenge | Medium | AR/VR Visual Tools |
Evaluation of Drivers in India Industrial Visualization Market (2026–2032)
The factors lifting demand, and the evidence behind each, are summarised below.
| Drivers | Primary Segment Affected | Why It Matters (Evidence) |
| Increasing investments in smart manufacturing | Data Dashboards | The average annual growth rate for data dashboard solutions is estimated at 25% from 2023 to 2028, driving demand from manufacturers. |
| Rising adoption of AR/VR training tools | AR/VR Visual Tools | The projected increase in adoption by 30% by 2025 encourages companies to invest in immersive training solutions. |
| Expansion of SCADA systems in various sectors | SCADA Visualization | With over 20,000 SCADA systems installed, industries are increasingly reliant on these solutions for real-time monitoring. |
| Government initiatives promoting digital infrastructure | Utilities Control | The Digital India initiative supports the integration of advanced visualization tools in utility management, improving operational efficiency. |
| Growing demand for IoT-based solutions | IoT-Based | The rise of smart factories is driving the need for real-time data collection and visualization. |
The Industrial Visualization market in India is expanding as end-use demand from manufacturing and utilities rises, alongside a strong supply response. The projected increase in AR/VR training tool adoption by 30% by 2025 encourages companies to invest in immersive training solutions. Investment in smart manufacturing technologies is driving demand for data dashboards, with an average annual growth rate estimated at 25% from 2023 to 2028. The rise of smart factories is creating a need for IoT-based solutions, further supporting the market's growth potential.
Evaluation of Restraints in India Industrial Visualization Market
The main factors holding the market back are set out below.
| Market Restraint | Primary Segment Affected | Why It Matters (Evidence) |
| Limited awareness of advanced visualization technologies | 3D Plant Models | Many companies lack knowledge about the benefits of 3D visualization, hindering adoption rates. |
| High initial costs of implementing visualization systems | IoT-Based | The expense associated with advanced systems discourages smaller firms from investing in these technologies. |
| Resistance to change from traditional practices | AR/VR Visual Tools | Some industries are hesitant to adopt new technologies, slowing the integration of AR/VR tools. |
| Insufficient skilled workforce for advanced visualization | Data Dashboards | A lack of trained professionals limits the effective use of data visualization tools in industries. |
| Fragmented market with varying standards | SCADA Visualization | Inconsistent standards across sectors complicate the integration of SCADA systems. |
India Industrial Visualization Market Challenges
The India Industrial Visualization market encounters a skills shortage that restricts the availability of trained professionals, leading to project delays and escalating costs by up to 30%. Buyers face high integration costs, which can inflate expenses by 40% when modernising outdated systems due to insufficient infrastructure. Supply chain disruptions also impede progress, as reliance on imported components can prolong project timelines by several weeks, affecting manufacturers' ability to meet deadlines. Competition intensifies as local firms struggle to match international pricing, squeezing margins and threatening profitability for suppliers.
Trends in the India Industrial Visualization Market
The trends below show where the India Industrial Visualization Market is heading.
- Increased Integration of AR/VR: The demand for AR/VR training tools is expected to rise by 30% by 2025. This trend is reflected in manufacturing facilities adopting immersive training programs to improve workforce skills.
- Shift Towards Smart Manufacturing: The Digital India initiative is driving the integration of advanced visualization tools in manufacturing. With an investment of ₹1,000 crore, smart manufacturing is becoming a priority for many industries.
- Growth in Real-time Data Visualization: Utilities are increasingly adopting real-time dashboards for monitoring operations. The average annual growth rate for data dashboard solutions is estimated at 25% from 2023 to 2028.
- Expansion of Smart Cities: The Smart Cities Mission is integrating advanced visualization tools for urban planning. This initiative aims to improve management efficiency in urban environments.
Investment Opportunities in the India Industrial Visualization Market
Below are the investment opportunities with the strongest case in the India Industrial Visualization Market.
- Development of Smart Industrial Zones: The National Industrial Corridor Development Programme aims to create smart industrial zones with integrated visualization systems. With a budget of ₹500 crore, this initiative offers opportunities for technology suppliers.
- Investment in AR/VR Training Solutions: The demand for AR/VR training tools is expected to increase by 30% by 2025, driving manufacturers to seek advanced training solutions. Collaborating with local firms can facilitate market entry.
- Integration of IoT-Based Solutions: The rise of smart factories is generating demand for IoT-based visualization solutions. Suppliers can penetrate this market by partnering with manufacturers to deliver tailored solutions.
- Expansion of Data Dashboard Solutions: With an estimated growth rate of 25% for data dashboard solutions, there is a notable opportunity for software developers. Focusing on manufacturing units can lead to fruitful partnerships.
Government Initiatives in the India Industrial Visualization Market
The Digital India Programme, initiated by the Ministry of Electronics and Information Technology in 2020, significantly impacts the Industrial Visualization market by enhancing digital infrastructure. This programme allocates ₹1,000 crore to support the development of visualization technologies, enabling manufacturers to adopt advanced systems for monitoring and control. Additionally, the National Policy on Electronics 2019, updated in 2021, promotes the growth of visualization technologies, targeting a production increase of $400 billion by 2025. These measures encourage investment in innovative visualization solutions, helping local industries improve operational efficiency and competitiveness. The Smart Manufacturing Competitiveness Program, launched in 2021, further enhances visualization capabilities with a budget of ₹300 crore, focusing on manufacturing sectors.
The Skill India Mission, updated in 2022, plays a vital role in training the workforce for AR/VR technologies in industrial applications. This initiative equips professionals with necessary skills, ensuring that companies can effectively implement advanced visualization tools. The National Industrial Corridor Development Programme, initiated in 2020, aims to create smart industrial zones with integrated visualization systems, facilitating better resource management. Funding from these initiatives supports the development of infrastructure that enhances the adoption of industrial visualization, ultimately benefiting manufacturers and utility providers in India. By fostering a skilled workforce and modern infrastructure, these schemes promote the growth of the Industrial Visualization market.
Future Insight of the India Industrial Visualization Market
The India Industrial Visualization market is set to evolve considerably by 2032, driven by the Digital India initiative and the Make in India programme. Government funding of ₹500 crore for Industry 4.0 technologies will accelerate the adoption of advanced visualization tools across various sectors. The installed base of SCADA systems, which exceeds 20,000 units, will continue to expand, enhancing monitoring and control capabilities. As the National Institute of Smart Government refines standards, suppliers will gain from clearer guidelines, promoting innovation and operational efficiency.
Market Segmentation Analysis
Each segment group is reviewed below, with the leader by share and the fastest grower by CAGR.
By Product Type – SCADA Visualization Dominated, AR/VR Visual Tools Expected to Grow Fastest
According to Sachin Kumar Rai, Senior Research Analyst at 6Wresearch, SCADA Visualization took a 52% share of product type in 2025, more than any other category. SCADA Visualization commands the largest share in India's industrial visualization market because it is indispensable for real-time monitoring and control across more than 20,000 installed units. Its critical application in sectors like manufacturing and utilities underlines its significance for operational efficiency. Over 2026–2032, AR/VR Visual Tools are expected to post the fastest growth, at a CAGR of 9.5%. The AR/VR Visual Tools segment is set to grow rapidly, with a projected 30% increase in adoption by 2025, driven by the demand for immersive training solutions in complex industrial environments. As SCADA continues to lead, the growth of AR/VR will further solidify the overall market position. Suppliers should prioritise the development of AR/VR tools to meet the rising demand for effective training solutions in industrial settings.
By Visualization Tech – Real-time Dashboards Dominated, IoT-Based Expected to Grow Fastest
Real-time Dashboards held a 36% share of the India Industrial Visualization Market by visualization tech in 2025. Real-time Dashboards command the largest market share as they are critical for immediate data visualisation and decision-making in various industries. Their widespread deployment across over 1,000 manufacturing units underscores their pivotal role in enhancing operational efficiency. IoT-Based is set to record the highest CAGR in this split, 8.3% over 2026–2032. IoT-Based technologies are witnessing rapid growth, driven by the rising adoption of real-time data collection in smart factories. Government initiatives promoting Industry 4.0 technologies further support the increasing demand for IoT solutions. Buyers should invest in IoT-Based technologies to harness real-time data for enhanced operational insights.
By Application – Utilities Control Dominated, Maintenance Training Expected to Grow Fastest
The largest application category in 2025 was Utilities Control, with a 51% share of total revenue. Utilities Control leads the application segment, essential for managing and optimising operations within utility sectors. The emphasis on operational efficiency in this area significantly contributes to its substantial market share. The quickest growth will come from Maintenance Training, forecast to expand at a CAGR of 8.9% between 2026 and 2032. Maintenance Training is the fastest-growing application, as organisations increasingly focus on preparing staff for equipment handling and safety protocols. This prioritisation is crucial for minimising operational risks and ensuring compliance with safety standards. Suppliers must develop targeted solutions for maintenance training to meet the rising demand for workforce safety and efficiency.
By Distribution Channel – Direct SaaS Dominated and Is Expected to Record the Fastest Growth
With a 44% revenue share in 2025, Direct SaaS was the largest distribution channel category. Direct SaaS is the leading distribution channel, providing cloud-based solutions that users increasingly prefer for their accessibility and scalability. This model effectively delivers visualisation tools, aligning with current market trends. Direct SaaS are also forecast to expand faster than any other category, at a CAGR of 8.9% over 2026–2032. Direct SaaS is also the fastest-growing channel, as its convenience aligns with the rising demand for cloud-based industrial solutions. This trend signals a clear shift towards more flexible service models in the market. Suppliers should enhance their Direct SaaS offerings to capitalise on the growing preference for cloud-based solutions in industrial visualisation.
Key Attractiveness of the Report
- 10 Years of Market Numbers
- Historical Data Starting from 2022 to 2025
- Base Year 2025
- Forecast Data until 2032
- Key Performance Indicators Impacting the Market
- Major Upcoming Developments and Projects
Key Highlights of the Report:
- India Industrial Visualization Market Outlook
- Market Size of India Industrial Visualization Market, 2025
- Forecast of India Industrial Visualization Market, 2032
- Historical Data and Forecast of India Industrial Visualization Revenues & Volume for the Period 2022 - 2032F
- India Industrial Visualization Market Trend Evolution
- India Industrial Visualization Market Drivers and Challenges
- India Industrial Visualization Price Trends
- India Industrial Visualization Porter's Five Forces
- India Industrial Visualization Industry Life Cycle
- Historical Data and Forecast of India Industrial Visualization Market Revenues & Volume By Product Type for the Period 2022 - 2032F
- Historical Data and Forecast of India Industrial Visualization Market Revenues & Volume By SCADA Visualization for the Period 2022 - 2032F
- Historical Data and Forecast of India Industrial Visualization Market Revenues & Volume By 3D Plant Models for the Period 2022 - 2032F
- Historical Data and Forecast of India Industrial Visualization Market Revenues & Volume By AR/VR Visual Tools for the Period 2022 - 2032F
- Historical Data and Forecast of India Industrial Visualization Market Revenues & Volume By Data Dashboards for the Period 2022 - 2032F
- Historical Data and Forecast of India Industrial Visualization Market Revenues & Volume By Visualization Tech for the Period 2022 - 2032F
- Historical Data and Forecast of India Industrial Visualization Market Revenues & Volume By Real-time Dashboards for the Period 2022 - 2032F
- Historical Data and Forecast of India Industrial Visualization Market Revenues & Volume By CAD/CAM Integration for the Period 2022 - 2032F
- Historical Data and Forecast of India Industrial Visualization Market Revenues & Volume By Immersive Interfaces for the Period 2022 - 2032F
- Historical Data and Forecast of India Industrial Visualization Market Revenues & Volume By IoT-Based for the Period 2022 - 2032F
- Historical Data and Forecast of India Industrial Visualization Market Revenues & Volume By Application for the Period 2022 - 2032F
- Historical Data and Forecast of India Industrial Visualization Market Revenues & Volume By Utilities Control for the Period 2022 - 2032F
- Historical Data and Forecast of India Industrial Visualization Market Revenues & Volume By Factory Layout Planning for the Period 2022 - 2032F
- Historical Data and Forecast of India Industrial Visualization Market Revenues & Volume By Maintenance Training for the Period 2022 - 2032F
- Historical Data and Forecast of India Industrial Visualization Market Revenues & Volume By Performance Monitoring for the Period 2022 - 2032F
- Historical Data and Forecast of India Industrial Visualization Market Revenues & Volume By Distribution Channel for the Period 2022 - 2032F
- Historical Data and Forecast of India Industrial Visualization Market Revenues & Volume By Direct SaaS for the Period 2022 - 2032F
- Historical Data and Forecast of India Industrial Visualization Market Revenues & Volume By Engineering Vendors for the Period 2022 - 2032F
- Historical Data and Forecast of India Industrial Visualization Market Revenues & Volume By Tech Integrators for the Period 2022 - 2032F
- Historical Data and Forecast of India Industrial Visualization Market Revenues & Volume By Online Licenses for the Period 2022 - 2032F
- India Industrial Visualization Import Export Trade Statistics
- Market Opportunity Assessment By Product Type
- Market Opportunity Assessment By Visualization Tech
- Market Opportunity Assessment By Application
- Market Opportunity Assessment By Distribution Channel
- India Industrial Visualization Top Companies Market Share
- India Industrial Visualization Competitive Benchmarking By Technical and Operational Parameters
- India Industrial Visualization Company Profiles
- India Industrial Visualization Key Strategic Recommendations
Market Covered
Segments analysed in this report are listed below.
By Product Type
- SCADA Visualization
- 3D Plant Models
- AR/VR Visual Tools
- Data Dashboards
By Visualization Tech
- Real-time Dashboards
- CAD/CAM Integration
- Immersive Interfaces
- IoT-Based
By Application
- Utilities Control
- Factory Layout Planning
- Maintenance Training
- Performance Monitoring
By Distribution Channel
- Direct SaaS
- Engineering Vendors
- Tech Integrators
- Online Licenses































