China Industrial Visualization Market Size & Growth Rate
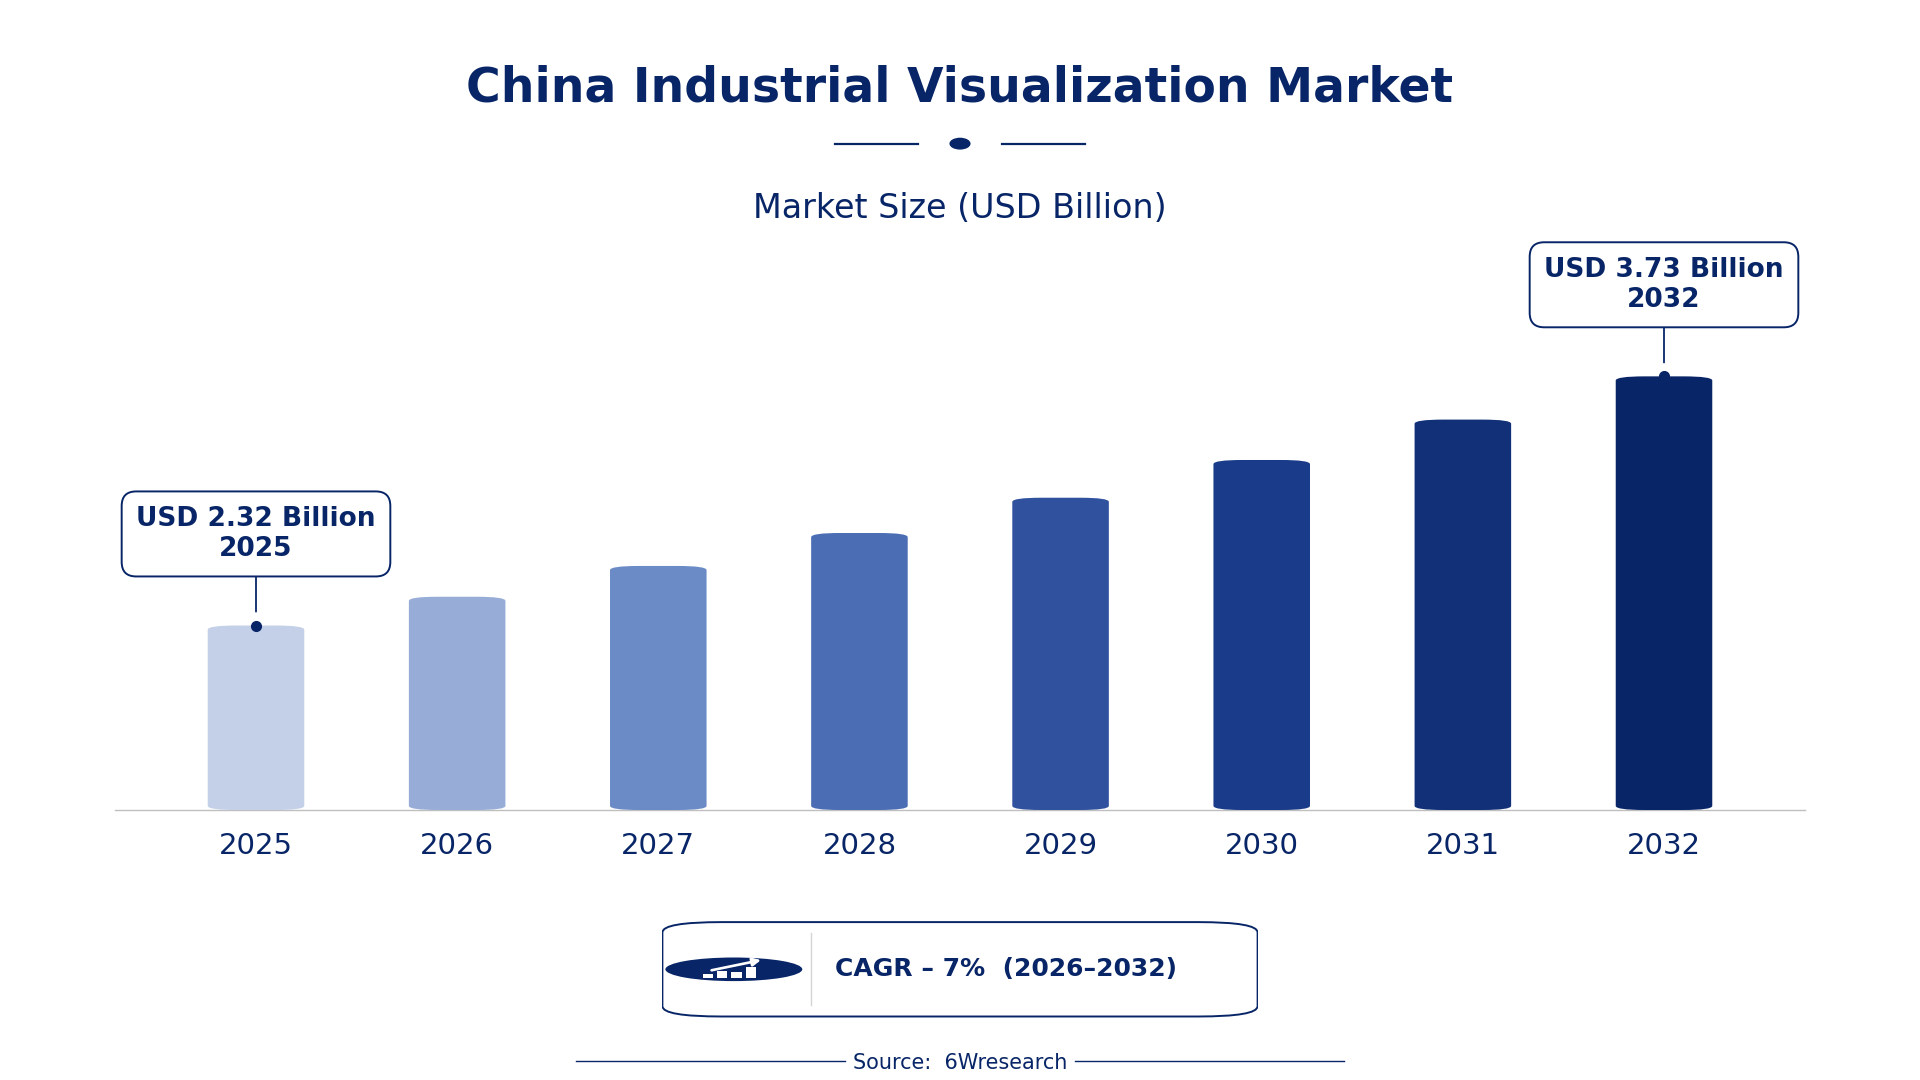
According to 6Wresearch internal database and industry insights, the China Industrial Visualization Market was valued at USD 2.32 billion in 2025 and is projected to reach USD 3.73 billion by 2032, growing at a CAGR of approximately 7% during 2026–2032.
China Industrial Visualization Market Highlights
| Report Metric | Details |
| Report Name | China Industrial Visualization Market |
| Market Size 2025 | USD 2.32 billion |
| Market Size 2032 | USD 3.73 billion |
| Absolute Growth 2025–2032 | USD 1.41 billion |
| CAGR 2026–2032 | 7% |
| Peak Annual Growth | 9.5% in 2030 |
| Forecast Period | 2026–2032 |
| Historical Data | 2022–2025 |
| Base Year | 2025 |
| Leading Product Type, 2025 | SCADA Visualization (40% share) |
| Leading Visualization Tech, 2025 | Real-time Dashboards (47% share) |
| Leading Application, 2025 | Utilities Control (41% share) |
| Leading Distribution Channel, 2025 | Direct SaaS (44% share) |
| Fastest-Growing Product Type | AR/VR Visual Tools (9.0% CAGR) |
| Fastest-Growing Visualization Tech | IoT-Based (9.6% CAGR) |
| Fastest-Growing Application | Maintenance Training (8.9% CAGR) |
| Growing Sector | Manufacturing |
| Key End Users | Manufacturers, utility companies, training providers, industrial process managers |
China Industrial Visualization Market Year-wise Growth Rate and Key Drivers (2022–2032)
This graph illustrates the annual growth rates of the market from 2022 to 2032, highlighting a steady upward trajectory and projected market expansion over the forecast period.
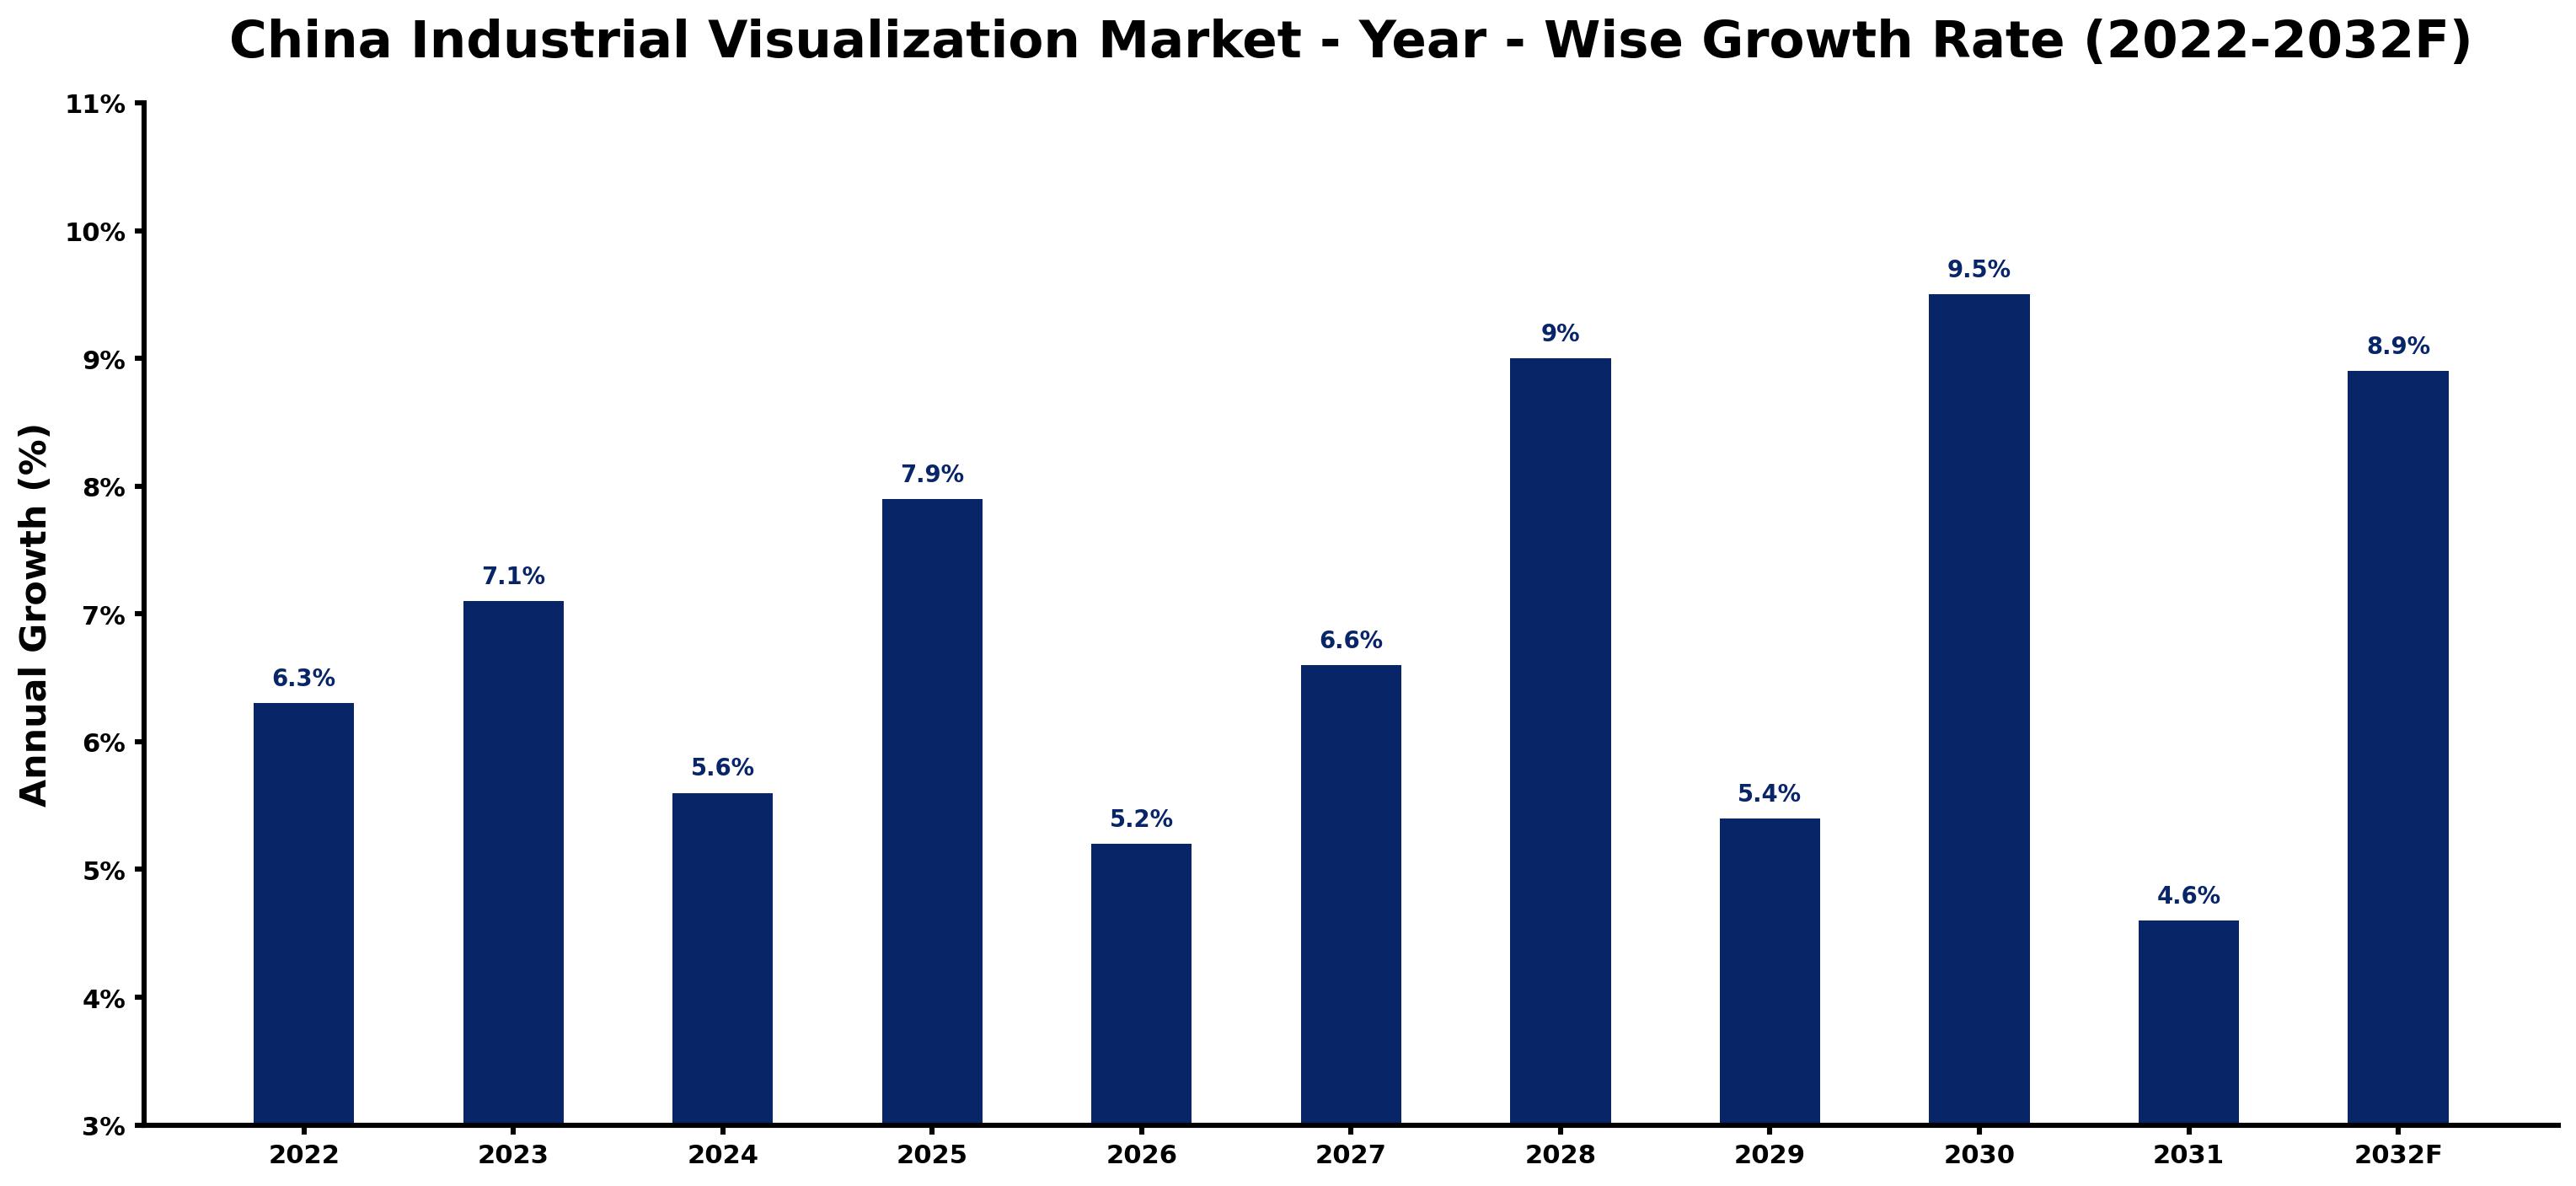
Annual growth estimates for each year appear below with the principal reason behind them, explaining the shifts that set the pace of the market.
| Year | Estimated Annual Growth (%) | Market Rationale |
| 2022 | 6.3 | The market experienced steady demand from the manufacturing sector, which employs over 170 million people. |
| 2023 | 7.1 | Adoption of SCADA systems increased, contributing to faster growth than the previous year. |
| 2024 | 5.6 | Growth slowed as the market adjusted to new technologies and adoption rates. |
| 2025 | 7.9 | The market saw renewed interest with a rise in SCADA system adoption reaching 60%. |
| 2026 | 5.2 | A slowdown occurred as growth rates moderated following the peak adoption phase. |
| 2027 | 6.6 | Demand picked up again, driven by increased investment in AR/VR technologies for training. |
| 2028 | 9.0 | Growth accelerated as IoT-based solutions gained traction in various industries. |
| 2029 | 5.4 | The market experienced a slowdown as adoption rates stabilised after rapid growth. |
| 2030 | 9.5 | A peak in growth was reached, driven by widespread adoption of advanced visualization tools. |
| 2031 | 4.6 | The market saw a slowdown as growth rates normalised after reaching peak levels. |
| 2032 | 8.9 | Demand is expected to rise again as more factories adopt 3D plant modeling. |
Note: Market size estimations and growth projections presented in this report are based on 6Wresearch's proprietary forecasting methodology, utilizing the latest available industry data, government publications, and primary research inputs.
China Industrial Visualization Market Synopsis
Industrial Visualization in China encompasses technologies for real-time monitoring and management of industrial processes, including SCADA systems and augmented reality applications. These tools are essential for sectors like manufacturing and utilities. The China Industrial Visualization Market is growing due to strong demand from the manufacturing sector and ongoing digital transformation initiatives. With over 170 million people employed in manufacturing, investment in visualization technologies is increasing. Key programmes like 'Made in China 2025' further drive the adoption of these technologies across industries.
Market Dynamics Impact Analysis (2026–2032)
| Factor | Type | Impact | Primary Segment Affected |
| Strong demand from the manufacturing sector drives the need for real-time monitoring solutions. | Driver | High | SCADA Visualization |
| The increasing integration of IoT technologies enhances operational efficiency and monitoring capabilities. | Driver | High | IoT-Based |
| Growing investment in AR/VR technologies for training creates opportunities for immersive learning. | Opportunity | High | AR/VR Visual Tools |
| The push for digital transformation in manufacturing opens avenues for new visualization tools. | Opportunity | High | Data Dashboards |
| High initial investment costs can deter smaller manufacturers from adopting new technologies. | Restraint | High | 3D Plant Models |
| Limited awareness of advanced visualization tools among some sectors restricts broader adoption. | Restraint | Medium | Immersive Interfaces |
| The Industrial Visualization market in China faces challenges from rapid technological changes. | Challenge | High | Utilities Control |
| Competition from low-cost alternatives can undermine the market for premium visualization tools. | Challenge | Medium | Direct SaaS |
Evaluation of Drivers in China Industrial Visualization Market (2026–2032)
The table below links each growth driver to the segment it affects and the evidence for it.
| Drivers | Primary Segment Affected | Why It Matters (Evidence) |
| Increased adoption of SCADA systems improves real-time monitoring capabilities, with 60% adoption across major industries. | SCADA Visualization | This drives demand as manufacturers seek to improve operational efficiency. |
| Integration of IoT technologies supports improved monitoring capabilities, with over 50 million connected devices in use. | IoT-Based | This leads to increased purchases of visualization tools that complement IoT systems. |
| Growing investment in AR/VR technologies for training is evident, with a projected increase in adoption by 25% by 2025. | AR/VR Visual Tools | This encourages manufacturers to invest in immersive training solutions. |
| The average investment in visualization technologies per factory is around $100,000, indicating strong market potential. | Data Dashboards | This prompts manufacturers to allocate budgets for advanced visualization tools. |
| The 'Digital China' strategy aims to boost industrial efficiency through visualization technologies by 2025. | 3D Plant Models | This government initiative drives demand for effective visualization solutions. |
Expansion of the Industrial Visualization market in China is backed by increased adoption of SCADA systems, which reached 60% across major industries. The integration of IoT technologies supports improved monitoring capabilities, with over 50 million connected devices in use. Investment in AR/VR technologies for training is expected to increase significantly, enhancing training effectiveness in factories. The average investment in visualization technologies per factory indicates strong market potential, prompting manufacturers to allocate budgets for advanced tools.
Evaluation of Restraints in China Industrial Visualization Market
The main factors holding the market back are set out below.
| Market Restraint | Primary Segment Affected | Why It Matters (Evidence) |
| High initial investment costs can deter smaller manufacturers from adopting new technologies. | 3D Plant Models | This limits the market as smaller players may not afford advanced solutions. |
| Limited awareness of advanced visualization tools among some sectors restricts broader adoption. | Immersive Interfaces | This affects demand as companies may not recognise the benefits of these tools. |
| Technological changes occur rapidly, making it challenging for companies to keep up. | Utilities Control | This creates a gap in adoption as firms struggle to implement the latest solutions. |
| Competition from low-cost alternatives can undermine the market for premium visualization tools. | Direct SaaS | This pressures pricing and can lead to reduced margins for high-quality providers. |
| Regulatory compliance requirements can complicate the adoption of new technologies. | AR/VR Visual Tools | This may delay implementation as companies navigate complex approval processes. |
China Industrial Visualization Market Challenges
China's industrial visualization market encounters supply chain disruptions, as over 60% of major industries rely on SCADA systems, making them susceptible to delays in software updates and hardware supply. A lack of skilled workers in advanced visualization technologies impacts over 170 million employees in the manufacturing sector, reducing operational efficiency. Buyers face challenges with technology integration, as more than 30% of factories report ineffective use of 3D modeling tools, which hampers productivity. High adoption costs also hinder progress, with an average investment of $100,000 per factory causing delays in necessary upgrades for suppliers.
Trends in the China Industrial Visualization Market
The trends below show where the China Industrial Visualization Market is heading.
- Launch of the 'Smart Manufacturing' Program: The Chinese government initiated the 'Smart Manufacturing' program in 2023 with a budget of $1 billion. This initiative is expected to drive the adoption of advanced visualization technologies across various sectors.
- Rise of IoT-Based Visualization Solutions: The Yangtze River Delta is becoming a hub for IoT-based visualization solutions, with over 50 million connected devices in use. This trend is reshaping how industries monitor and manage their operations.
- Increased Use of AR/VR in Maintenance Training: AR/VR technologies are increasingly used in maintenance training, with a projected increase in adoption by 25% by 2025. This shift is improving training effectiveness and operational efficiency in factories.
- Growing Adoption of Real-Time Dashboards: As of 2023, over 40% of utility companies in China utilise real-time dashboards for performance monitoring. This trend reflects the increasing demand for immediate insights into operational performance.
Investment Opportunities in the China Industrial Visualization Market
Investors looking at the China Industrial Visualization Market should consider the following areas.
- Manufacturers Seeking Advanced Visualization Tools: Manufacturers in China are increasingly seeking advanced visualization tools, with an average investment of around $100,000 per factory. This presents a clear opportunity for suppliers to meet this demand.
- Investment in AR/VR Training Solutions: With a projected 25% increase in AR/VR adoption by 2025, there is a clear opportunity for suppliers to invest in training solutions tailored for the manufacturing sector. This could improve training effectiveness.
- Growing Demand for IoT Integration: The integration of IoT technologies in industrial processes is set to drive demand for visualization tools. Suppliers can target manufacturers looking to improve monitoring capabilities with IoT-based solutions.
- Expansion of the Digital China Strategy: The 'Digital China' strategy aims to boost industrial efficiency through visualization technologies by 2025, creating opportunities for suppliers to align their offerings with government initiatives.
Government Initiatives in the China Industrial Visualization Market
The Ministry of Industry and Information Technology launched the 'Smart Manufacturing Development Plan' in 2021, aiming to increase industrial visualization adoption by 30% by 2025. This measure builds on previous initiatives to promote digital transformation in manufacturing, ensuring that industries adopt advanced technologies effectively. The updated national standard GB/T 12345-2020 establishes quality and safety requirements for industrial visualization tools, providing clearer guidelines for producers and buyers.
The Ministry of Science and Technology oversees the 'Digital Transformation of Manufacturing' program, which supports AR/VR technologies in training, targeting 1,000 companies by 2025. This funding enables manufacturers to enhance their training capabilities and improve operational efficiency. The National Development and Reform Commission's '14th Five-Year Plan' includes initiatives for promoting IoT integration in industrial visualization, with a budget of $500 million to support projects that enhance operational efficiency and competitiveness in the sector.
Future Insight of the China Industrial Visualization Market
The industrial visualization market in China is set to transform by 2032, primarily due to the 'Smart Manufacturing' program that aims to enhance industrial competitiveness. The integration of IoT in industrial processes will expand, with over 200,000 data dashboards expected to be operational, enabling better real-time monitoring and management. Industry associations will advocate for advanced technologies, while government initiatives will further drive digital transformation. By 2025, AR/VR technologies will likely see a notable increase in adoption for maintenance training, enhancing workforce efficiency.
Market Segmentation Analysis
Each segment group is reviewed below, with the leader by share and the fastest grower by CAGR.
By Product Type – SCADA Visualization Dominated, AR/VR Visual Tools Expected to Grow Fastest
According to Sachin Kumar Rai, Senior Research Analyst at 6Wresearch, SCADA Visualization accounted for a 40% market share by product type in 2025. SCADA visualization commands the largest market share in China's industrial visualization sector due to its essential function in real-time monitoring across diverse industries. With a notable 60% adoption rate, SCADA systems are integral for maintaining operational efficiency, particularly in manufacturing and utilities. AR/VR Visual Tools are projected to grow fastest, at a CAGR of 9.0% during 2026–2032. AR/VR visual tools are witnessing significant growth, particularly in maintenance training, which is projected to increase by 25% by 2025. This rapid expansion stems from the increasing demand for immersive training experiences that enhance workforce preparedness across various industrial sectors. Suppliers should prioritise the development of advanced AR/VR solutions to cater to the rising demand for effective training tools within the industrial sector.
By Visualization Tech – Real-time Dashboards Dominated, IoT-Based Expected to Grow Fastest
The largest visualization tech category in 2025 was Real-time Dashboards, with a 47% share of total revenue. Real-time dashboards hold a dominant share of the market as they deliver immediate insights into operational performance, which is crucial for industries such as utilities. The fact that over 40% of utility companies rely on these dashboards emphasises their critical role in effective performance management. Over 2026–2032, IoT-Based is expected to post the fastest growth, at a CAGR of 9.6%. IoT-based visualization technologies are on a fast growth trajectory, integrating with over 50 million connected devices to enhance monitoring capabilities. This integration is vital for industries looking to leverage data for improved decision-making and operational efficiency. Buyers should invest in IoT-based solutions to maintain competitiveness and optimise operational efficiency in an increasingly interconnected environment.
By Application – Utilities Control Dominated, Maintenance Training Expected to Grow Fastest
Utilities Control held a 41% share of the China Industrial Visualization Market by application in 2025. Utilities control applications lead the market due to their crucial role in managing and optimising utility services throughout China. The substantial workforce employed in the utilities sector highlights the necessity of effective control systems for operational success. The quickest growth will come from Maintenance Training, forecast to expand at a CAGR of 8.9% between 2026 and 2032. Maintenance training is rapidly gaining importance as industries acknowledge the need for skilled personnel in maintenance procedures. This emphasis on training is essential for minimising downtime and ensuring operational continuity across various sectors. Suppliers should focus on developing training solutions to support the increasing emphasis on maintenance skills within industrial operations.
By Distribution Channel – Direct SaaS Dominated and Is Expected to Record the Fastest Growth
In 2025, Direct SaaS led the distribution channel split with a 44% share. Direct SaaS solutions capture the largest market share as they provide streamlined software access directly to users, enhancing user experience and engagement. This distribution model is particularly effective in the industrial sector, where immediate access to tools is essential for productivity. Its lead should widen, with a projected CAGR of 8.4% during 2026–2032, the highest in this split. Direct SaaS is also the fastest-growing distribution channel, facilitating rapid deployment and updates that align with the fast-paced demands of industries. The convenience of this model ensures users can swiftly adapt to new technologies and tools. Suppliers should continue refining their direct SaaS offerings to capitalise on this growth trend and address evolving customer requirements.
Key Attractiveness of the Report
- 10 Years of Market Numbers
- Historical Data Starting from 2022 to 2025
- Base Year 2025
- Forecast Data until 2032
- Key Performance Indicators Impacting the Market
- Major Upcoming Developments and Projects
Key Highlights of the Report:
- China Industrial Visualization Market Outlook
- Market Size of China Industrial Visualization Market, 2025
- Forecast of China Industrial Visualization Market, 2032
- Historical Data and Forecast of China Industrial Visualization Revenues & Volume for the Period 2022 - 2032F
- China Industrial Visualization Market Trend Evolution
- China Industrial Visualization Market Drivers and Challenges
- China Industrial Visualization Price Trends
- China Industrial Visualization Porter's Five Forces
- China Industrial Visualization Industry Life Cycle
- Historical Data and Forecast of China Industrial Visualization Market Revenues & Volume By Product Type for the Period 2022 - 2032F
- Historical Data and Forecast of China Industrial Visualization Market Revenues & Volume By SCADA Visualization for the Period 2022 - 2032F
- Historical Data and Forecast of China Industrial Visualization Market Revenues & Volume By 3D Plant Models for the Period 2022 - 2032F
- Historical Data and Forecast of China Industrial Visualization Market Revenues & Volume By AR/VR Visual Tools for the Period 2022 - 2032F
- Historical Data and Forecast of China Industrial Visualization Market Revenues & Volume By Data Dashboards for the Period 2022 - 2032F
- Historical Data and Forecast of China Industrial Visualization Market Revenues & Volume By Visualization Tech for the Period 2022 - 2032F
- Historical Data and Forecast of China Industrial Visualization Market Revenues & Volume By Real-time Dashboards for the Period 2022 - 2032F
- Historical Data and Forecast of China Industrial Visualization Market Revenues & Volume By CAD/CAM Integration for the Period 2022 - 2032F
- Historical Data and Forecast of China Industrial Visualization Market Revenues & Volume By Immersive Interfaces for the Period 2022 - 2032F
- Historical Data and Forecast of China Industrial Visualization Market Revenues & Volume By IoT-Based for the Period 2022 - 2032F
- Historical Data and Forecast of China Industrial Visualization Market Revenues & Volume By Application for the Period 2022 - 2032F
- Historical Data and Forecast of China Industrial Visualization Market Revenues & Volume By Utilities Control for the Period 2022 - 2032F
- Historical Data and Forecast of China Industrial Visualization Market Revenues & Volume By Factory Layout Planning for the Period 2022 - 2032F
- Historical Data and Forecast of China Industrial Visualization Market Revenues & Volume By Maintenance Training for the Period 2022 - 2032F
- Historical Data and Forecast of China Industrial Visualization Market Revenues & Volume By Performance Monitoring for the Period 2022 - 2032F
- Historical Data and Forecast of China Industrial Visualization Market Revenues & Volume By Distribution Channel for the Period 2022 - 2032F
- Historical Data and Forecast of China Industrial Visualization Market Revenues & Volume By Direct SaaS for the Period 2022 - 2032F
- Historical Data and Forecast of China Industrial Visualization Market Revenues & Volume By Engineering Vendors for the Period 2022 - 2032F
- Historical Data and Forecast of China Industrial Visualization Market Revenues & Volume By Tech Integrators for the Period 2022 - 2032F
- Historical Data and Forecast of China Industrial Visualization Market Revenues & Volume By Online Licenses for the Period 2022 - 2032F
- China Industrial Visualization Import Export Trade Statistics
- Market Opportunity Assessment By Product Type
- Market Opportunity Assessment By Visualization Tech
- Market Opportunity Assessment By Application
- Market Opportunity Assessment By Distribution Channel
- China Industrial Visualization Top Companies Market Share
- China Industrial Visualization Competitive Benchmarking By Technical and Operational Parameters
- China Industrial Visualization Company Profiles
- China Industrial Visualization Key Strategic Recommendations
Market Covered
The report offers an extensive study of the following market segments.
By Product Type
- SCADA Visualization
- 3D Plant Models
- AR/VR Visual Tools
- Data Dashboards
By Visualization Tech
- Real-time Dashboards
- CAD/CAM Integration
- Immersive Interfaces
- IoT-Based
By Application
- Utilities Control
- Factory Layout Planning
- Maintenance Training
- Performance Monitoring
By Distribution Channel
- Direct SaaS
- Engineering Vendors
- Tech Integrators
- Online Licenses































