India Inorganic Compounds Market Size & Growth Rate
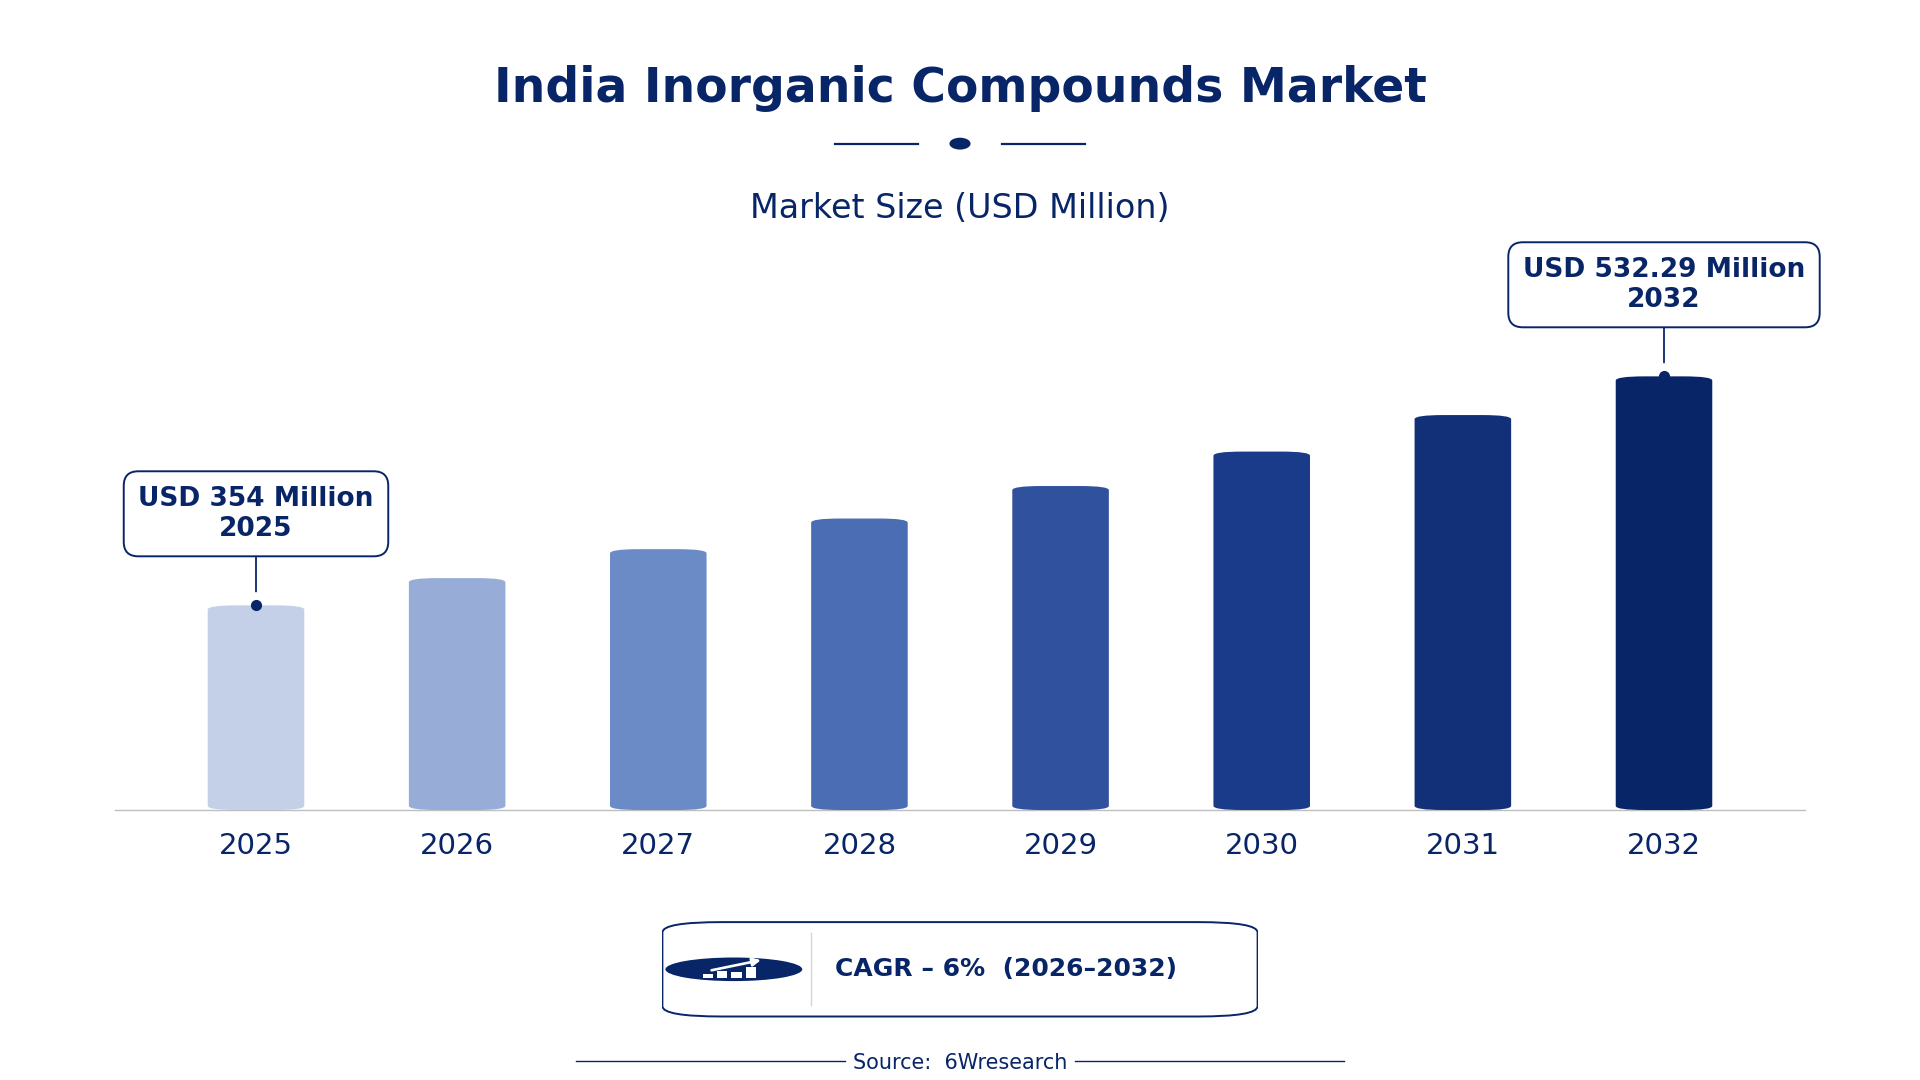
According to 6Wresearch internal database and industry insights, the India Inorganic Compounds Market was valued at USD 354.0 million in 2025 and is projected to reach USD 532.29 million by 2032, growing at a CAGR of approximately 6% during 2026–2032.
India Inorganic Compounds Market Highlights
| Report Metric | Details |
| Report Name | India Inorganic Compounds Market |
| Market Size 2025 | USD 354.0 million |
| Market Size 2032 | USD 532.29 million |
| Absolute Growth 2025–2032 | USD 178.29 million |
| CAGR 2026–2032 | 6% |
| Peak Annual Growth | 8.5% in 2030 |
| Forecast Period | 2026–2032 |
| Historical Data | 2022–2025 |
| Base Year | 2025 |
| Leading Compound Type, 2025 | Salts (44% share) |
| Leading Element Class, 2025 | Na (15% share) |
| Leading Industrial Use, 2025 | Fertilizer (34% share) |
| Leading Form Factor, 2025 | Granular (53% share) |
| Leading Sector, 2025 | Agriculture (45% share) |
| Fastest-Growing Compound Type | Inorganic Acids (8.3% CAGR) |
| Fastest-Growing Element Class | Zn (8.4% CAGR) |
| Fastest-Growing Industrial Use | Disinfectants (7.7% CAGR) |
| Fastest-Growing Form Factor | Liquid/Powder (8.2% CAGR) |
| Fastest-Growing Sector | Pharma (7.1% CAGR) |
| Growing Sector | Agriculture |
| Key End Users | Farmers, Chemical Manufacturers, Pharmaceutical Companies, Cleaning Product Producers |
India Inorganic Compounds Market Year-wise Growth Rate and Key Drivers (2022–2032)
This graph illustrates the annual growth rates of the market from 2022 to 2032, highlighting a steady upward trajectory and projected market expansion over the forecast period.
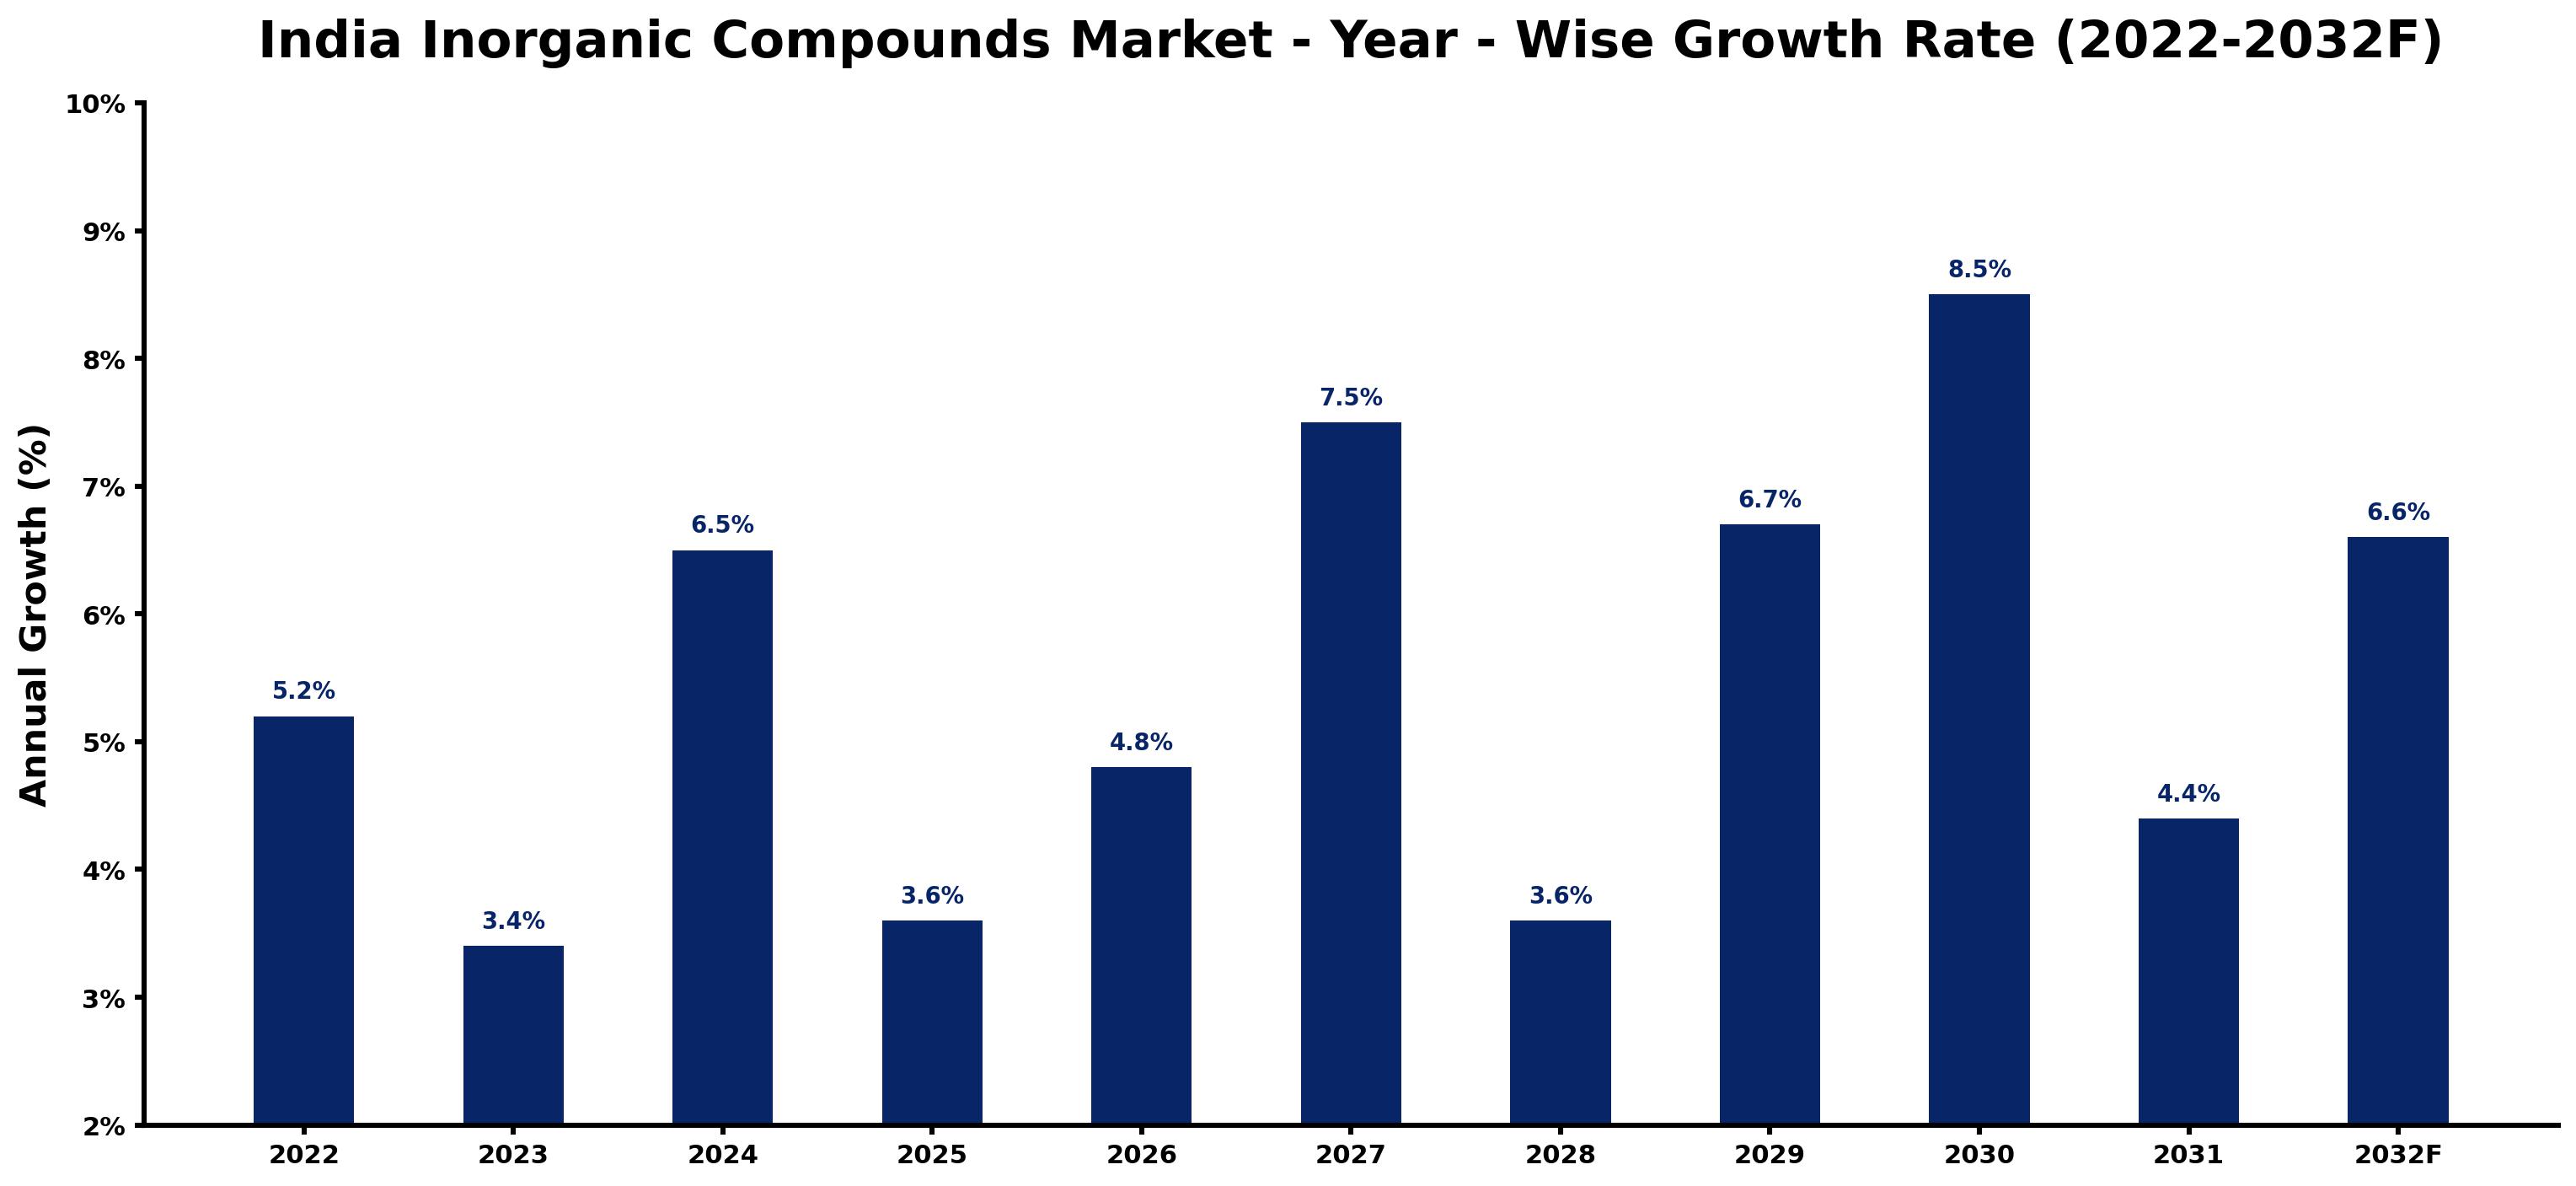
The table below sets out the estimated growth rate for each year and the main factor behind it.
| Year | Estimated Annual Growth (%) | Market Rationale |
| 2022 | 5.2 | The market experienced steady growth, driven by strong domestic demand for fertilizers. |
| 2023 | 3.4 | Growth slowed due to market adjustments and a temporary decline in agricultural exports. |
| 2024 | 6.5 | Increased production capacity and favourable weather conditions boosted growth significantly. |
| 2025 | 3.6 | Growth slowed again as the market adjusted to new fertilizer regulations and standards. |
| 2026 | 4.8 | Demand rose as the agricultural sector sought to improve crop yields with inorganic fertilizers. |
| 2027 | 7.5 | A surge in fertilizer production capacity drove higher demand from the agriculture sector. |
| 2028 | 3.6 | Growth slowed as the market stabilised following a period of rapid expansion in previous years. |
| 2029 | 6.7 | Increased investments in the chemical sector revitalised growth in the inorganic compounds market. |
| 2030 | 8.5 | The market peaked with strong demand from agriculture and pharmaceutical sectors driving purchases. |
| 2031 | 4.4 | Growth slowed as market dynamics adjusted to the peak demand levels of the previous year. |
| 2032 | 6.6 | A renewed focus on sustainable practices and organic fertilizers will support further growth. |
Note: Market size estimations and growth projections presented in this report are based on 6Wresearch's proprietary forecasting methodology, utilizing the latest available industry data, government publications, and primary research inputs.
India Inorganic Compounds Market Synopsis
Inorganic Compounds Market in India encompasses a variety of chemical substances devoid of carbon-hydrogen bonds, created through synthesis and extraction processes. These compounds find primary applications in agriculture, industry, and pharmaceuticals. The market is expanding due to heightened demand from the agriculture sector, which relies significantly on inorganic fertilizers. In 2022, India produced 2.5 million tons of inorganic fertilizers, underscoring the strength of this industry. The National Mission for Sustainable Agriculture advocates for balanced fertilizer use, further propelling market growth.
Market Dynamics Impact Analysis (2026–2032)
| Factor | Type | Impact | Primary Segment Affected |
| Increased agricultural production requirements drive demand for fertilizers. | Driver | High | Fertilizer |
| Growing pharmaceutical industry needs more inorganic chemicals for drug manufacturing. | Driver | High | Pharma |
| Investment in sustainable agriculture creates demand for balanced fertilizers. | Opportunity | High | Fertilizer |
| Rising urbanisation leads to increased demand for cleaning agents and disinfectants. | Opportunity | Medium | Cleaning Agents |
| Environmental regulations may limit production capacities for certain compounds. | Restraint | High | Inorganic Acids |
| Quality control standards may restrict market entry for new producers. | Restraint | Medium | Metal Oxides |
| Supply chain disruptions affect the timely availability of raw materials. | Challenge | High | Fertilizer |
| Competition from organic fertilizers may impact market share for inorganic products. | Challenge | Medium | Fertilizer |
Evaluation of Drivers in India Inorganic Compounds Market (2026–2032)
The main growth drivers and the segments they affect most are set out below.
| Drivers | Primary Segment Affected | Why It Matters (Evidence) |
| Rising agricultural production needs drive demand for fertilizers, with 2.5 million tons produced in 2022. | Fertilizer | Farmers are purchasing more fertilizers to improve crop yields and meet food security demands. |
| The growing pharmaceutical sector requires inorganic chemicals, projected to reach $65 billion by 2024. | Pharma | Increased drug manufacturing leads to higher purchases of inorganic compounds for production. |
| The National Mission for Sustainable Agriculture promotes balanced fertilizer use, boosting demand. | Fertilizer | Farmers are adopting more inorganic fertilizers to enhance soil health and crop productivity. |
| Urbanisation is increasing demand for cleaning agents, with a growing focus on hygiene. | Cleaning Agents | Industries are purchasing more disinfectants to ensure sanitation and public health safety. |
| Investment in chemical production facilities is expanding capacity in the sector, targeting $300 billion by 2025. | Metal Oxides | Producers are increasing output to meet rising industrial needs and consumer demands. |
The Inorganic Compounds market in India is growing on the back of rising agricultural production needs, expanding pharmaceutical demands, and urbanisation trends. In 2022, India produced 2.5 million tons of inorganic fertilizers, reflecting the agricultural sector's reliance on these compounds. The pharmaceutical industry, projected to reach $65 billion by 2024, is driving demand for inorganic chemicals used in drug manufacturing. The National Mission for Sustainable Agriculture is promoting balanced fertilizer use, encouraging farmers to adopt more inorganic fertilizers to improve soil health. Urbanisation is increasing demand for cleaning agents, with industries purchasing more disinfectants for sanitation purposes.
Evaluation of Restraints in India Inorganic Compounds Market
The following restraints limit how fast demand can grow.
| Market Restraint | Primary Segment Affected | Why It Matters (Evidence) |
| Environmental regulations may limit production capacities for certain compounds, affecting output. | Inorganic Acids | Producers face challenges complying with strict environmental standards, which can restrict operations. |
| Quality control standards may restrict market entry for new producers, limiting competition. | Metal Oxides | New entrants struggle to meet established quality benchmarks, hindering their ability to compete. |
| Supply chain disruptions affect the timely availability of raw materials, causing delays. | Fertilizer | Producers experience challenges in sourcing necessary inputs, impacting production schedules. |
| Market fluctuations in raw material prices can impact production costs and pricing strategies. | Salts | Producers may face increased costs, affecting profitability and market pricing strategies. |
| Competition from organic fertilizers may impact market share for inorganic products, reducing sales. | Fertilizer | Consumers increasingly seek organic alternatives, affecting demand for inorganic fertilizers. |
India Inorganic Compounds Market Challenges
India produced 2.5 million tons of inorganic fertilizers in 2022, yet supply chain disruptions frequently hinder deliveries to producers, causing missed critical planting seasons. Limited access to advanced technology restricts production efficiency, resulting in operational costs that may increase by 15% for manufacturers, ultimately raising prices for buyers. Intense competition among domestic producers often leads to price reductions, which can compromise product quality and compel suppliers to cut corners, jeopardising customer satisfaction. Stringent regulations, such as those established by the Fertilizer Control Order, elevate compliance costs for manufacturers, which may be passed on to buyers, influencing their purchasing decisions.
Trends in the India Inorganic Compounds Market
Buyers and suppliers in the India Inorganic Compounds Market are adjusting to the following trends.
- Shift towards Sustainable Fertilizer Practices: Farmers in Uttar Pradesh are increasingly embracing both organic and inorganic fertilizers to improve soil health, with the National Mission for Sustainable Agriculture advocating this transition. In 2022, India's agricultural sector contributed approximately 17% to the GDP, driving the demand for sustainable practices.
- Emergence of Advanced Cleaning Agents: The healthcare sector is prioritising disinfectants, particularly in urban areas, to comply with sanitation standards. As urbanisation progresses, the demand for cleaning agents is escalating, leading to a projected growth of 7.5% in the disinfectants segment by 2032.
- Transition from Traditional to Modern Fertilizers: The Fertilizer Control Order is encouraging manufacturers to innovate and refine fertilizer formulations, ensuring greater efficiency. Consequently, the inorganic fertilizers market is poised for substantial growth, with production reaching 2.5 million tons in 2022.
- Increased Focus on Quality Standards: The Bureau of Indian Standards is tightening regulations for inorganic compounds, ensuring improved quality and safety for consumers. This initiative is expected to bolster market confidence and stimulate demand, particularly in the pharmaceutical sector, projected to reach $65 billion by 2024.
Investment Opportunities in the India Inorganic Compounds Market
Several openings in the India Inorganic Compounds Market merit attention from investors.
- Timing for Sustainable Practices: With the National Mission for Sustainable Agriculture advocating balanced fertilizers, now presents an optimal opportunity for investment in sustainable practices. Farmers are increasingly seeking solutions to enhance soil fertility and crop yields.
- Growing Need for Disinfectants: Urban areas are demanding effective cleaning agents, especially disinfectants. Producers can capitalise on this need by offering high-quality products that comply with regulatory standards.
- Investment in Chemical Production Facilities: The Indian chemical sector is projected to reach $300 billion by 2025, creating opportunities for investment in production facilities. Collaborating with local partners can facilitate market entry and expansion.
- Focus on Fertilizer Efficiency: The Soil Health Card Scheme promotes efficient fertilizer use based on soil assessments. Suppliers can deliver tailored solutions to farmers, boosting productivity and sustainability.
Government Initiatives in the India Inorganic Compounds Market
The Ministry of Chemicals and Fertilizers oversees the implementation of various subsidy schemes, including the Fertilizer Subsidy Scheme, which ensures that farmers receive financial support for fertilizer purchases. Additionally, the Soil Health Card Scheme, managed by the Ministry of Agriculture and Farmers' Welfare, promotes balanced fertilizer use based on soil health assessments. This initiative helps farmers optimise their fertilizer applications, ultimately improving agricultural productivity and sustainability.
The Bureau of Indian Standards sets standards for various inorganic compounds, ensuring quality and safety for consumers. The Central Pollution Control Board monitors environmental impact from inorganic compound production, enforcing compliance with regulations to protect public health.
Future Insight of the India Inorganic Compounds Market
By 2032, buyers and suppliers in the India inorganic compounds market can anticipate considerable changes driven by technological advancements and policy support. Improved production methods will streamline operations, enabling suppliers to lower costs and enhance efficiency. The government's National Policy on Chemical and Petrochemicals will strengthen sector competitiveness, encouraging innovation and investment. Furthermore, the Indian pharmaceutical industry is projected to reach $65 billion by 2024, which will heighten demand for high-quality inorganic chemicals, benefiting both producers and buyers as they adapt to shifting market needs.
Market Segmentation Analysis
The analysis below covers each segmentation, its leading category in 2025 and its fastest-growing category through 2032.
By Compound Type – Salts Dominated, Inorganic Acids Expected to Grow Fastest
According to Shubham Deep, Research Manager at 6Wresearch, in 2025, Salts led the compound type split with a 44% share. Salts hold the largest market share in India due to their crucial role in fertilizers and food processing. The production of 2.5 million tons of inorganic fertilizers in 2022 highlights the strong demand for salts in agriculture. Over 2026–2032, Inorganic Acids are expected to post the fastest growth, at a CAGR of 8.3%. Inorganic Acids are experiencing rapid growth because of their essential applications in industrial cleaning and chemical synthesis. The heightened focus on hygiene and sanitation across various sectors is driving this increasing demand. This trend indicates that suppliers should enhance their offerings in inorganic acids to cater to the growing industrial requirements.
By Element Class – Na Dominated, Zn Expected to Grow Fastest
The largest element class category in 2025 was Na, with a 15% share of total revenue. Sodium (Na) dominates the market share as it is extensively used in various chemical reactions, making it vital for numerous industrial processes. Its versatility ensures a consistent demand across multiple sectors. The quickest growth will come from Zn, forecast to expand at a CAGR of 8.4% between 2026 and 2032. Zinc (Zn) is witnessing the fastest growth owing to its significant applications in galvanization and fertilizers, which are essential for boosting agricultural productivity. The emphasis on sustainable farming practices is further propelling this segment. Suppliers should consider expanding their product lines to include more zinc-based solutions to capitalise on this growth opportunity.
By Industrial Use – Fertilizer Dominated, Disinfectants Expected to Grow Fastest
Fertilizer took a 34% share of industrial use in 2025, more than any other category. Fertilizer applications command the largest share of the inorganic compounds market, primarily due to the agriculture sector's dependence on these products for enhancing crop yields. This reliance is underscored by the agriculture sector's contribution of about 17% to India's GDP. Disinfectants are projected to grow fastest, at a CAGR of 7.7% during 2026–2032. Disinfectants are the fastest-growing segment as they are increasingly utilised in healthcare and sanitation, especially in response to rising hygiene awareness. Ongoing public health initiatives are further boosting this demand. This suggests that suppliers should invest in developing disinfectant products to align with the increasing health and sanitation standards.
By Form Factor – Granular Dominated, Liquid/Powder Expected to Grow Fastest
Granular accounted for a 53% market share by form factor in 2025. Granular forms of inorganic compounds dominate the market share, mainly because they are the preferred format for fertilizers. This form is favoured for its ease of application in agricultural practices, ensuring effective distribution. Liquid/Powder is set to record the highest CAGR in this split, 8.2% over 2026–2032. Liquid and powder forms are growing rapidly due to their versatility in various applications, including industrial uses and pharmaceuticals. The shift towards more adaptable product formats is driving this segment's growth. Suppliers should adapt their production strategies to include more liquid and powder forms to meet evolving market preferences.
By Sector – Agriculture Dominated, Pharma Expected to Grow Fastest
Agriculture held a 45% share of the India Inorganic Compounds Market by sector in 2025. The agriculture sector holds the largest market share for inorganic compounds, driven by the necessity for fertilizers to support India's extensive agricultural landscape. Government initiatives aimed at increasing crop yields further reinforce this position. Over 2026–2032, Pharma is expected to post the fastest growth, at a CAGR of 7.1%. The pharmaceutical sector is experiencing the fastest growth as it increasingly relies on inorganic chemicals for drug manufacturing. The projected expansion of the Indian pharmaceutical industry to $65 billion by 2024 is a significant factor in this trend. This indicates that suppliers should focus on developing partnerships within the pharmaceutical sector to leverage this growth potential.
Key Attractiveness of the Report
- 10 Years of Market Numbers
- Historical Data Starting from 2022 to 2025
- Base Year 2025
- Forecast Data until 2032
- Key Performance Indicators Impacting the Market
- Major Upcoming Developments and Projects
Key Highlights of the Report:
- India Inorganic Compounds Market Outlook
- Market Size of India Inorganic Compounds Market, 2025
- Forecast of India Inorganic Compounds Market, 2032
- Historical Data and Forecast of India Inorganic Compounds Revenues & Volume for the Period 2022 - 2032F
- India Inorganic Compounds Market Trend Evolution
- India Inorganic Compounds Market Drivers and Challenges
- India Inorganic Compounds Price Trends
- India Inorganic Compounds Porter's Five Forces
- India Inorganic Compounds Industry Life Cycle
- Historical Data and Forecast of India Inorganic Compounds Market Revenues & Volume By Compound Type for the Period 2022 - 2032F
- Historical Data and Forecast of India Inorganic Compounds Market Revenues & Volume By Metal Oxides for the Period 2022 - 2032F
- Historical Data and Forecast of India Inorganic Compounds Market Revenues & Volume By Nonmetal Compounds for the Period 2022 - 2032F
- Historical Data and Forecast of India Inorganic Compounds Market Revenues & Volume By Salts for the Period 2022 - 2032F
- Historical Data and Forecast of India Inorganic Compounds Market Revenues & Volume By Inorganic Acids for the Period 2022 - 2032F
- Historical Data and Forecast of India Inorganic Compounds Market Revenues & Volume By Element Class for the Period 2022 - 2032F
- Historical Data and Forecast of India Inorganic Compounds Market Revenues & Volume By Fe, Zn, Cu for the Period 2022 - 2032F
- Historical Data and Forecast of India Inorganic Compounds Market Revenues & Volume By P, S, Cl for the Period 2022 - 2032F
- Historical Data and Forecast of India Inorganic Compounds Market Revenues & Volume By Na, K, Mg for the Period 2022 - 2032F
- Historical Data and Forecast of India Inorganic Compounds Market Revenues & Volume By HNO3, H3PO4 for the Period 2022 - 2032F
- Historical Data and Forecast of India Inorganic Compounds Market Revenues & Volume By Industrial Use for the Period 2022 - 2032F
- Historical Data and Forecast of India Inorganic Compounds Market Revenues & Volume By Ceramics, Catalysts for the Period 2022 - 2032F
- Historical Data and Forecast of India Inorganic Compounds Market Revenues & Volume By Disinfectants, Fertilizer for the Period 2022 - 2032F
- Historical Data and Forecast of India Inorganic Compounds Market Revenues & Volume By Reactants for the Period 2022 - 2032F
- Historical Data and Forecast of India Inorganic Compounds Market Revenues & Volume By Cleaning Agents for the Period 2022 - 2032F
- Historical Data and Forecast of India Inorganic Compounds Market Revenues & Volume By Form Factor for the Period 2022 - 2032F
- Historical Data and Forecast of India Inorganic Compounds Market Revenues & Volume By Granular for the Period 2022 - 2032F
- Historical Data and Forecast of India Inorganic Compounds Market Revenues & Volume By Liquid/Powder for the Period 2022 - 2032F
- Historical Data and Forecast of India Inorganic Compounds Market Revenues & Volume By Crystal for the Period 2022 - 2032F
- Historical Data and Forecast of India Inorganic Compounds Market Revenues & Volume By Liquid for the Period 2022 - 2032F
- Historical Data and Forecast of India Inorganic Compounds Market Revenues & Volume By Sector for the Period 2022 - 2032F
- Historical Data and Forecast of India Inorganic Compounds Market Revenues & Volume By Automotive & Electronics for the Period 2022 - 2032F
- Historical Data and Forecast of India Inorganic Compounds Market Revenues & Volume By Agriculture for the Period 2022 - 2032F
- Historical Data and Forecast of India Inorganic Compounds Market Revenues & Volume By Food, Pharma for the Period 2022 - 2032F
- Historical Data and Forecast of India Inorganic Compounds Market Revenues & Volume By Industrial Cleaning for the Period 2022 - 2032F
- India Inorganic Compounds Import Export Trade Statistics
- Market Opportunity Assessment By Compound Type
- Market Opportunity Assessment By Element Class
- Market Opportunity Assessment By Industrial Use
- Market Opportunity Assessment By Form Factor
- Market Opportunity Assessment By Sector
- India Inorganic Compounds Top Companies Market Share
- India Inorganic Compounds Competitive Benchmarking By Technical and Operational Parameters
- India Inorganic Compounds Company Profiles
- India Inorganic Compounds Key Strategic Recommendations
Market Covered
The report offers an extensive study of the following market segments.
By Compound Type
- Metal Oxides
- Nonmetal Compounds
- Salts
- Inorganic Acids
By Element Class
- Fe
- Zn
- Cu
- P
- S
- Cl
- Na
- K
- Mg
- HNO3
- H3PO4
By Industrial Use
- Ceramics
- Catalysts
- Disinfectants
- Fertilizer
- Reactants
- Cleaning Agents
By Form Factor
- Granular
- Liquid/Powder
- Crystal
- Liquid
By Sector
- Automotive & Electronics
- Agriculture
- Food
- Pharma
- Industrial Cleaning































