India Transit Analytics Market Size & Growth Rate
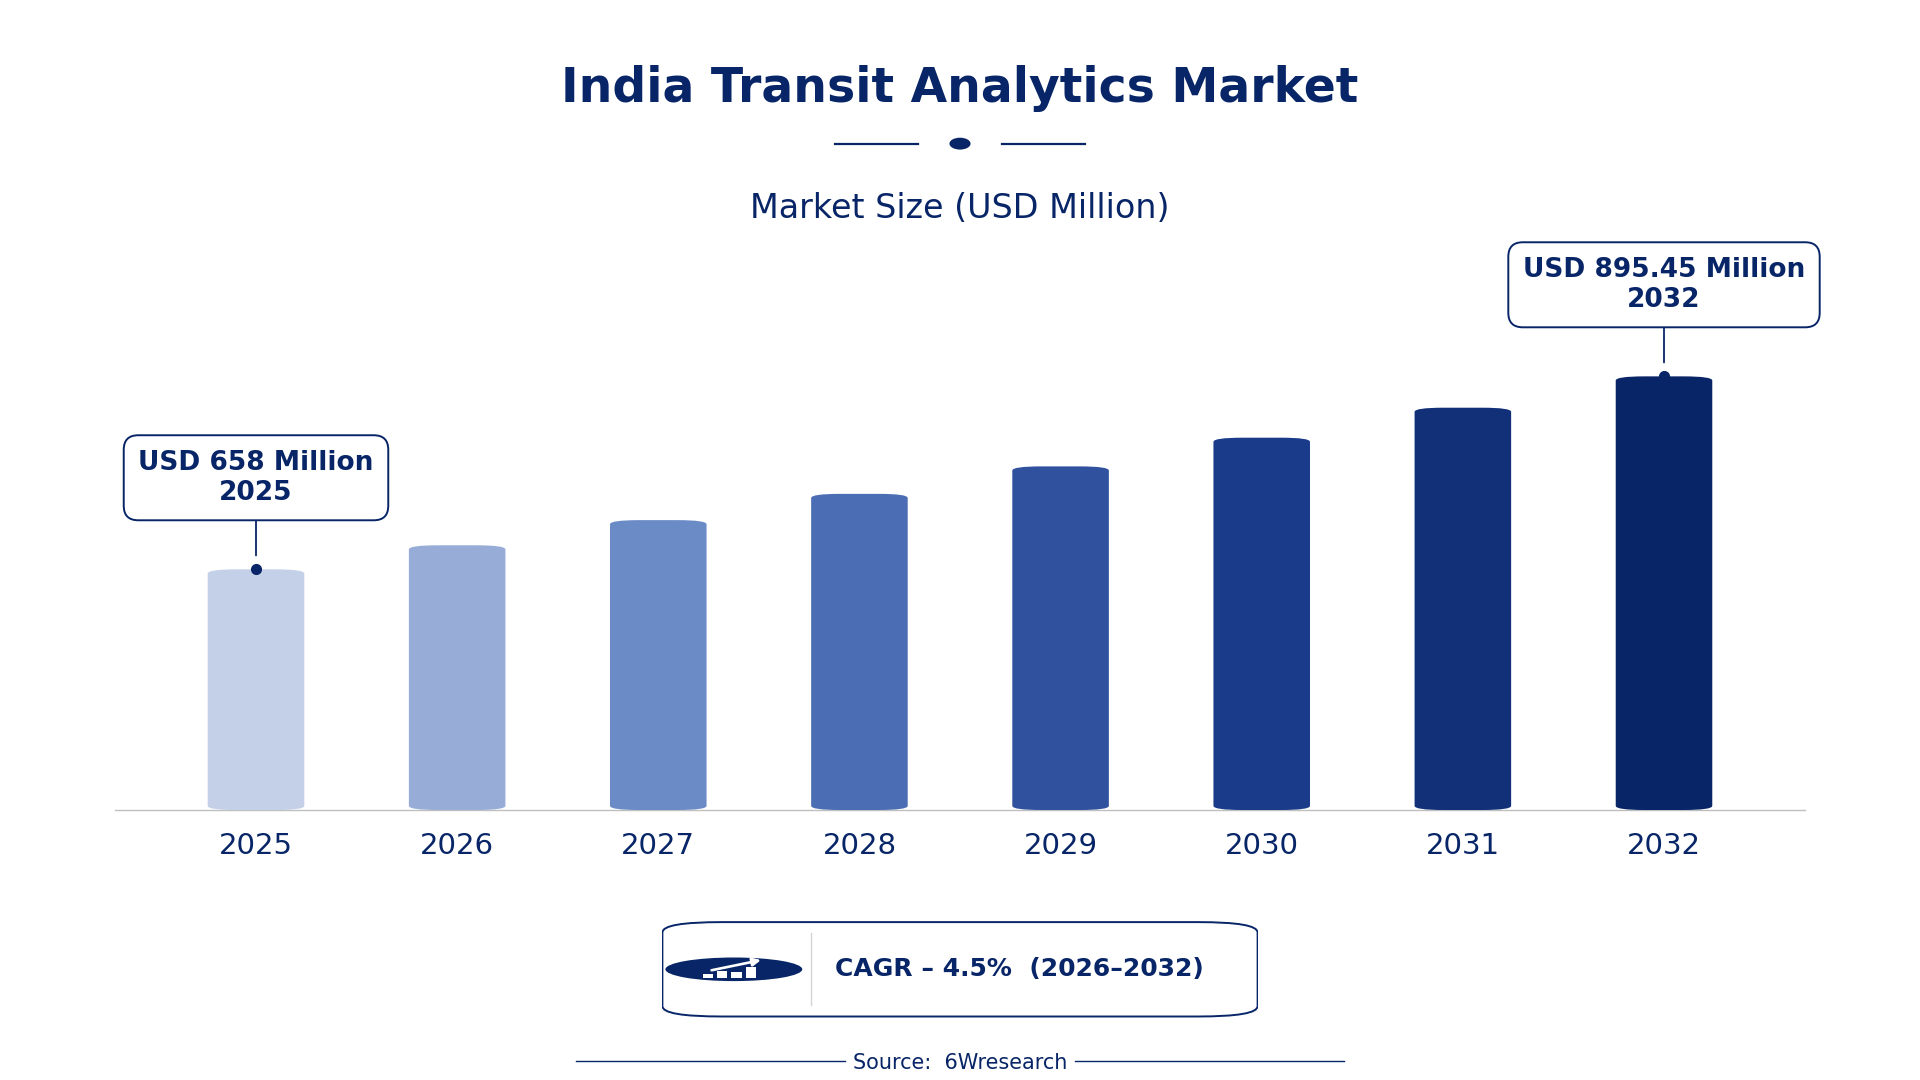
According to 6Wresearch internal database and industry insights, the India Transit Analytics Market was valued at USD 658.0 million in 2025 and is projected to reach USD 895.45 million by 2032, growing at a CAGR of approximately 4.5% during 2026–2032.
India Transit Analytics Market Highlights
| Report Metric | Details |
| Report Name | India Transit Analytics Market |
| Market Size 2025 | USD 658.0 million |
| Market Size 2032 | USD 895.45 million |
| Absolute Growth 2025–2032 | USD 237.45 million |
| CAGR 2026–2032 | 4.5% |
| Peak Annual Growth | 6.6% in 2028 |
| Forecast Period | 2026–2032 |
| Historical Data | 2022–2025 |
| Base Year | 2025 |
| Leading Analytics Type, 2025 | Operational Analytics (38% share) |
| Leading Data Focus, 2025 | Revenue Optimization (46% share) |
| Leading Application Area, 2025 | Metro Systems (39% share) |
| Leading End User, 2025 | City Transit Authorities (45% share) |
| Fastest-Growing Analytics Type | Predictive Analytics (6.2% CAGR) |
| Fastest-Growing Data Focus | Footfall Data (6.7% CAGR) |
| Fastest-Growing Application Area | Rail & Bus Fleets (7.0% CAGR) |
| Fastest-Growing End User | Transport Planners (6.1% CAGR) |
| Growing Sector | Public Transport |
| Key End Users | City Transit Authorities, Transport Planners, Urban Mobility Managers, Local Governments |
India Transit Analytics Market Year-wise Growth Rate and Key Drivers (2022–2032)
This graph illustrates the annual growth rates of the market from 2022 to 2032, highlighting a steady upward trajectory and projected market expansion over the forecast period.
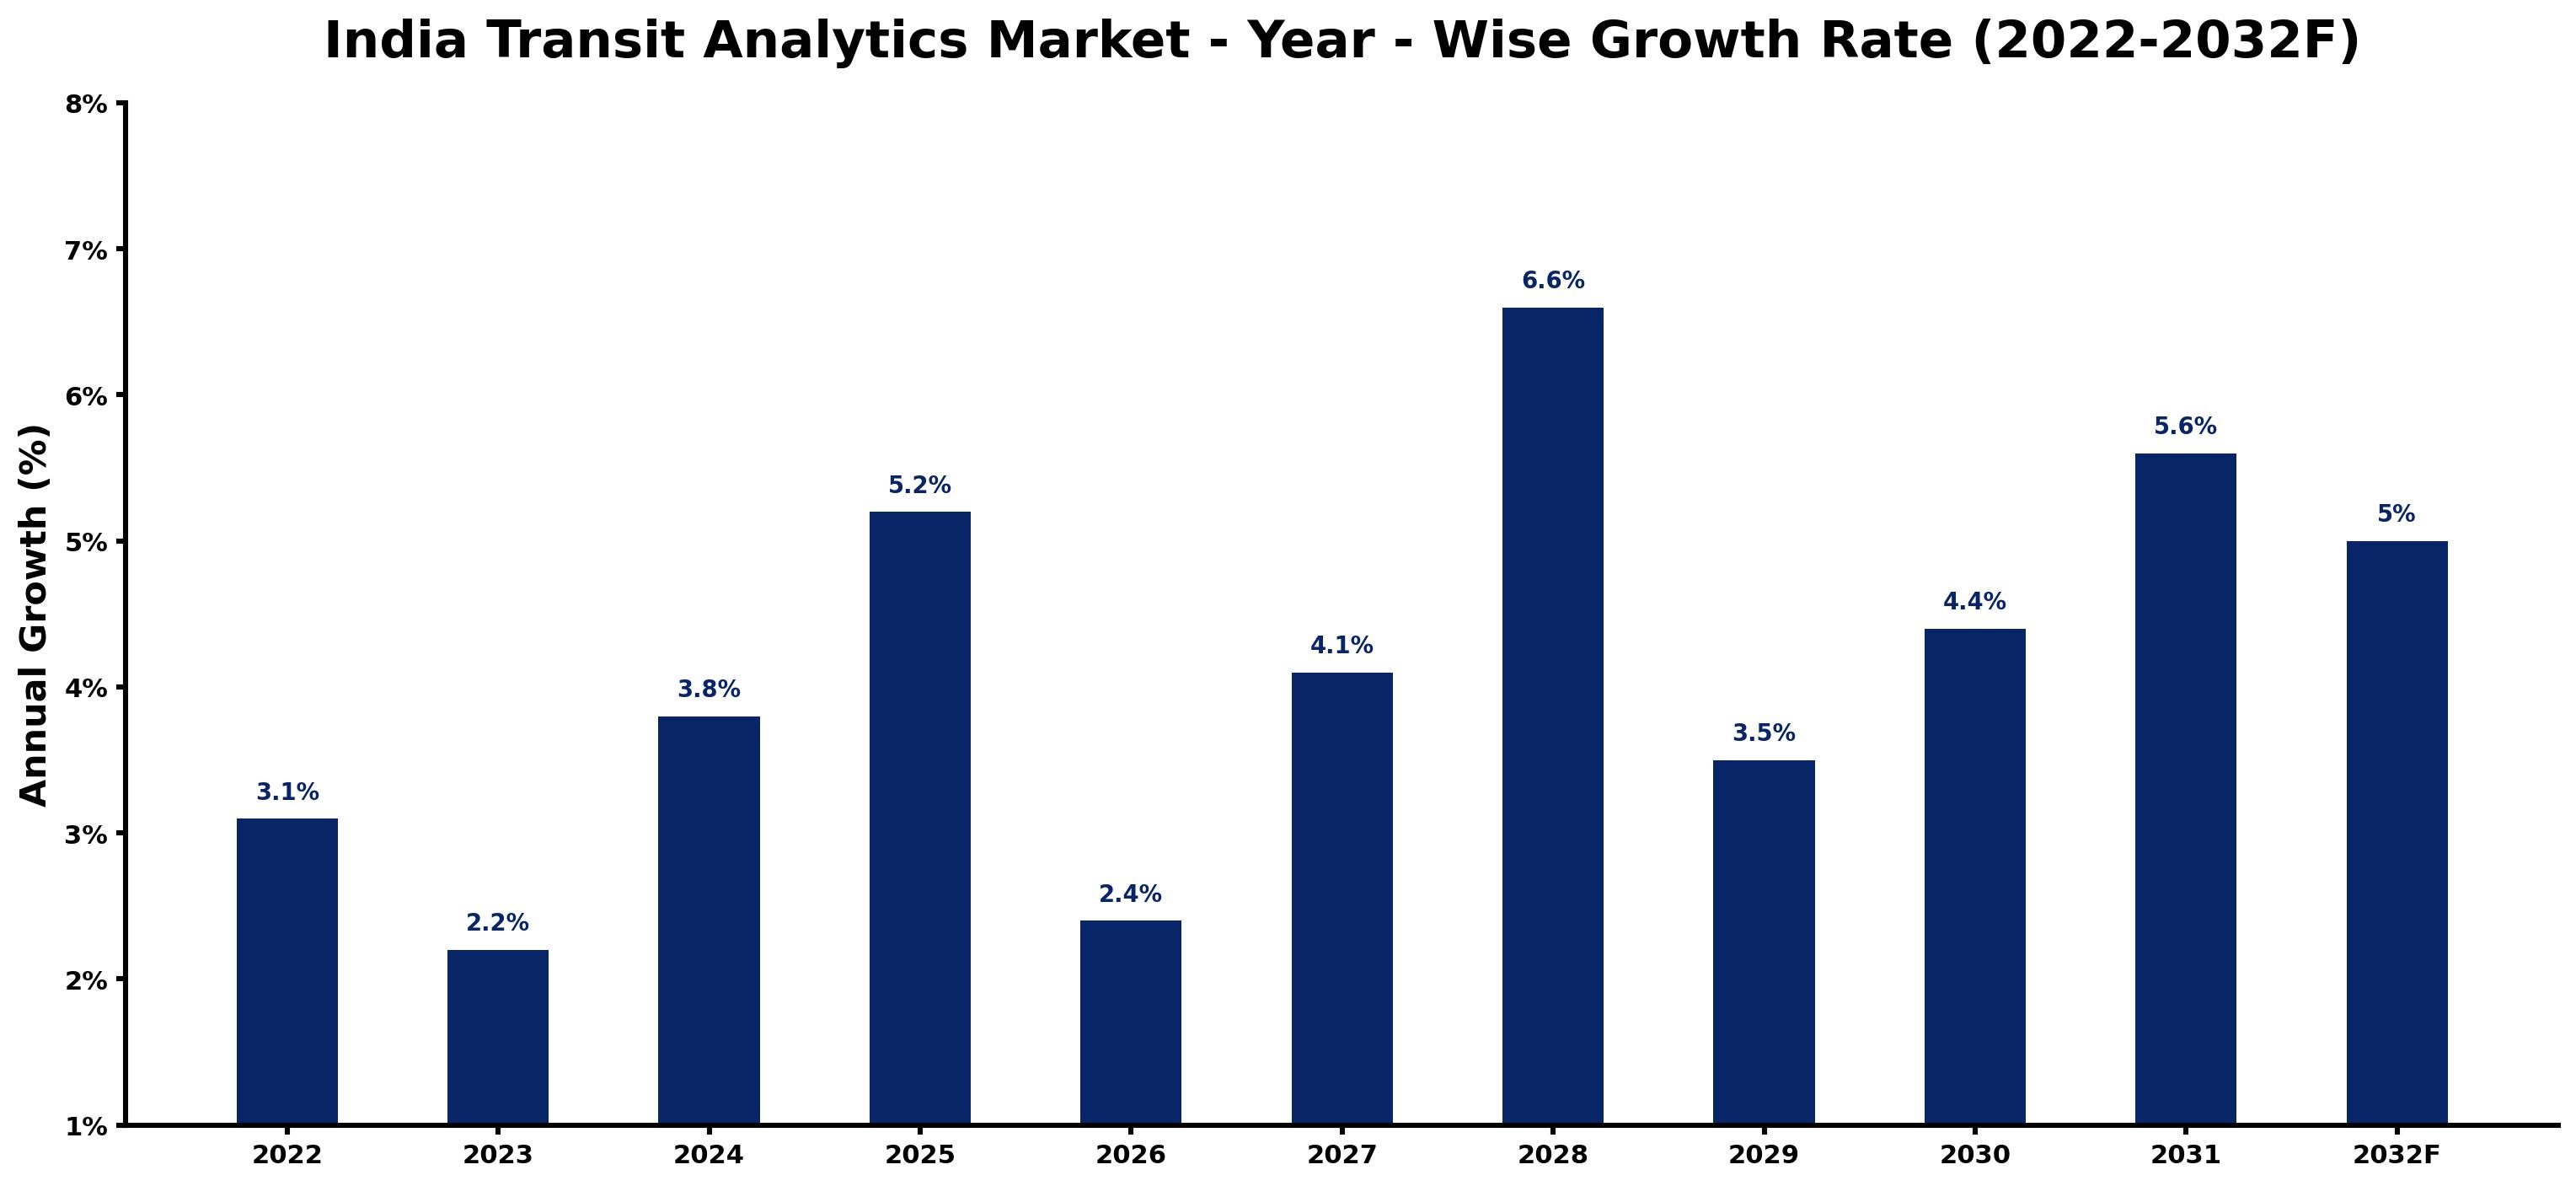
The following table presents the estimated annual growth rate for each year together with the principal factor influencing market performance.
| Year | Estimated Annual Growth (%) | Market Rationale |
| 2022 | 3.1 | Public transport usage remained high with over 700 million users annually. |
| 2023 | 2.2 | Investment growth slowed as urban transport projects faced delays in implementation due to regulatory issues. |
| 2024 | 3.8 | Increased focus on data analytics spurred demand for operational improvements in transit, particularly in metro systems. |
| 2025 | 5.2 | The Smart Cities Mission contributed significantly to investments in urban transport solutions, enhancing service delivery. |
| 2026 | 2.4 | Investment growth is projected to slow as the market adapts to new analytics standards and regulations. |
| 2027 | 4.1 | The adoption of predictive analytics is expected to gain momentum among city transit authorities as they seek efficiency. |
| 2028 | 6.6 | A peak in investment will be driven by the National Smart Mobility Mission initiatives promoting data integration. |
| 2029 | 3.5 | Growth is projected to slow as the market matures and competition increases among analytics providers. |
| 2030 | 4.4 | Increased funding for urban transport projects will boost demand for analytics solutions, particularly in metropolitan areas. |
| 2031 | 5.6 | City transit authorities are expected to expand their analytics capabilities to improve passenger experience and operational efficiency. |
| 2032 | 5.0 | Growth is projected to slow as the market stabilises with established analytics practices and user adoption. |
Note: Market size estimations and growth projections presented in this report are based on 6Wresearch's proprietary forecasting methodology, utilizing the latest available industry data, government publications, and primary research inputs.
India Transit Analytics Market Synopsis
Transit Analytics in India encompasses the application of data analysis technologies to enhance public transportation systems. This approach integrates diverse data sources to optimise routes, improve passenger experiences, and boost operational efficiency. The India Transit Analytics Market is expanding due to urbanisation and a growing demand for effective transit solutions. With over 50% of urban trips relying on public transport, initiatives like the Smart Cities Mission are catalysing investments. By 2025, the public transport sector is projected to experience a 15% increase in investment, further propelling market growth.
Market Dynamics Impact Analysis (2026–2032)
| Factor | Type | Impact | Primary Segment Affected |
| Urbanization is driving the need for efficient public transport solutions. | Driver | High | Public Transport |
| Investment in smart technologies enhances operational efficiency. | Driver | High | Operational Analytics |
| Growing urban populations create demand for improved transit services. | Opportunity | High | City Transit Authorities |
| The need for data-driven decision-making in transport planning is rising. | Opportunity | High | Transport Planners |
| Limited awareness of analytics benefits among smaller transit operators. | Restraint | Medium | Public Transport |
| High initial investment costs can deter adoption of analytics solutions. | Restraint | Medium | City Transit Authorities |
| Data privacy concerns may hinder the implementation of analytics solutions. | Challenge | Medium | Public Transport |
| Integration of multiple data sources remains a complex task for operators. | Challenge | Medium | Operational Analytics |
Evaluation of Drivers in India Transit Analytics Market (2026–2032)
The main growth drivers and the segments they affect most are set out below.
| Drivers | Primary Segment Affected | Why It Matters (Evidence) |
| Increased investment in urban transport projects drives demand for analytics. | Public Transport | India's public transport sector is expected to see a 15% increase in investment by 2025. |
| The Smart Cities Mission promotes technology integration in urban transport. | Operational Analytics | This initiative aims to enhance urban mobility in 100 cities by 2023. |
| Growing ridership in urban areas boosts demand for operational analytics. | City Transit Authorities | The average daily ridership of public transport in major cities is around 15 million passengers. |
| Predictive maintenance analytics improves service reliability for railways. | Rail & Bus Fleets | The Indian Railways has implemented predictive maintenance analytics since 2021. |
| The National Urban Transport Policy encourages data-driven decision-making. | Transport Planners | This policy was updated in 2020 to promote sustainable transport solutions. |
Market growth in India for Transit Analytics rests on increased investment in urban transport projects, rising ridership, and the integration of smart technologies. The public transport sector is projected to see a 15% increase in investment by 2025, driving analytics adoption. The Smart Cities Mission aims to improve urban mobility in 100 cities, creating demand for operational analytics among city transit authorities. With the average daily ridership of public transport in major cities around 15 million passengers, the need for data-driven solutions is increasing. The implementation of predictive maintenance analytics by the Indian Railways since 2021 has also contributed to service reliability improvements, generating more demand for analytics solutions.
Evaluation of Restraints in India Transit Analytics Market
The table below lists the restraints and the evidence behind each.
| Market Restraint | Primary Segment Affected | Why It Matters (Evidence) |
| Limited awareness of analytics benefits can hinder adoption. | Public Transport | Many smaller transit operators lack understanding of how analytics can improve efficiency, leading to underutilisation. |
| High initial investment costs deter smaller operators from adopting solutions. | City Transit Authorities | The costs associated with implementing analytics solutions can be prohibitive, limiting access for less funded authorities. |
| Data privacy concerns may restrict the use of analytics in transit. | Operational Analytics | Operators face challenges in ensuring compliance with data protection regulations, which may delay implementation. |
| Integration of diverse data sources remains complex and resource-intensive. | Public Transport | Transit authorities struggle to consolidate data from various platforms effectively, impacting operational efficiency. |
| Regulatory hurdles can slow down the implementation of analytics solutions. | Transport Planners | Changing regulations may require additional compliance efforts from transit planners, affecting project timelines. |
India Transit Analytics Market Challenges
The India Transit Analytics market still has to solve a few problems, starting with skills shortages among data analysts. Many public transport agencies struggle to recruit qualified personnel, which delays the implementation of data analysis technologies and hinders operational efficiency for transit authorities. Regulatory compliance presents another hurdle, as outdated policies can slow down the adoption of new technologies, costing agencies time and resources that could improve service delivery. Competition among transit providers is intensifying, leading to pricing pressures that can limit investment in analytics tools, ultimately affecting service quality for over 700 million annual public transport users.
Trends in the India Transit Analytics Market
The trends below show where the India Transit Analytics Market is heading.
- Smart Cities Mission Enhancing Urban Mobility: The Smart Cities Mission encourages the integration of technology in public transport systems, with a strong emphasis on data analytics. Over 60% of city transit authorities are expected to adopt analytics for operational improvements by 2025.
- Shift Towards Predictive Maintenance: Since 2021, the Indian Railways has been utilising predictive maintenance analytics to enhance service reliability. This trend is anticipated to expand, with more rail and bus fleets adopting similar methodologies.
- Focus on Passenger Flow Analytics: City Transit Authorities are increasingly leveraging passenger flow analytics to refine service planning. This shift is crucial as over 50% of urban trips in India are conducted via public transport.
- Rise of Revenue Optimization Strategies: Revenue optimization analytics is becoming crucial for transit operators aiming to boost profitability. This segment is projected to capture a 46% market share by 2025.
Investment Opportunities in the India Transit Analytics Market
Several openings in the India Transit Analytics Market merit attention from investors.
- Partnerships with Local Governments: Local governments are investing in urban transport projects, creating opportunities for analytics providers. The Indian government allocated INR 1,000 crore for urban transport projects in 2023.
- Demand for Predictive Analytics Solutions: With a projected growth rate of 6.2%, predictive analytics offers substantial growth potential. Transport planners are increasingly seeking advanced analytics solutions to improve service reliability and efficiency.
- Supply of Operational Analytics Solutions: There is a rising need for operational analytics solutions among city transit authorities. Over 60% of these authorities are expected to adopt analytics for operational improvements by 2025.
- Investment in Footfall Data Analytics: Footfall data analytics is gaining traction with a projected growth rate of 6.7%. This presents an opportunity for suppliers to cater to the needs of urban mobility managers.
Government Initiatives in the India Transit Analytics Market
The National Urban Transport Policy, updated by the Ministry of Urban Development in 2020, encourages the adoption of smart technologies in public transport, promoting sustainable transport solutions. The Smart Cities Mission, launched by the Ministry of Housing and Urban Affairs in 2015, aims to improve urban transport systems in 100 cities through technology and data analytics. Furthermore, the Urban Transport Policy revised in 2022 emphasizes the integration of data analytics in transport planning and management, ensuring efficient service delivery and compliance with modern standards.
City transit authorities benefit from the National Smart Mobility Mission, initiated by the Ministry of Road Transport and Highways in 2021, which promotes sustainable urban transport solutions with a focus on data analytics. This mission provides funding for projects that improve urban mobility, ensuring that transit agencies can implement necessary technologies. The National Institute of Urban Affairs launched a research program in 2023 to study the impact of analytics on urban mobility, offering insights that can guide future investments and policies. These initiatives collectively support the implementation of analytics solutions in public transport systems, enhancing operational efficiency and service delivery.
Future Insight of the India Transit Analytics Market
The India Transit Analytics market is set for notable changes by 2032, primarily driven by the integration of advanced data analysis technologies. The Smart Cities Mission aims to enhance urban mobility across 100 cities, improving public transport systems. By 2025, the government's allocation of INR 1,000 crore for urban transport projects will facilitate the development of data-driven solutions. Additionally, the National Smart Mobility Mission will encourage the use of technology in public transport, ensuring a more efficient and sustainable public transport system.
Market Segmentation Analysis
Each segment group is reviewed below, with the leader by share and the fastest grower by CAGR.
By Analytics Type – Operational Analytics Dominated, Predictive Analytics Expected to Grow Fastest
According to Vasudha, AM at 6Wresearch, Operational Analytics held a 38% share of the India Transit Analytics Market by analytics type in 2025. Operational Analytics commands the largest share because it is essential for real-time monitoring and decision-making in transit operations. City transit authorities rely heavily on this analytics type to ensure efficient service delivery for millions of public transport users annually. The quickest growth will come from Predictive Analytics, forecast to expand at a CAGR of 6.2% between 2026 and 2032. Predictive Analytics is experiencing rapid growth as it significantly improves service reliability through accurate demand forecasting. The implementation of predictive maintenance analytics by Indian Railways since 2021 illustrates its rising importance in enhancing operational effectiveness. Suppliers should focus on developing advanced predictive analytics solutions to meet the increasing demand from transit authorities.
By Data Focus – Revenue Optimization Dominated, Footfall Data Expected to Grow Fastest
Revenue Optimization accounted for a 46% market share by data focus in 2025. Revenue Optimization leads the market by enhancing revenue generation through strategic data-driven initiatives, which are crucial for transit authorities. This focus aligns with the anticipated 15% increase in urban transport investments by 2025, making it vital for financial performance improvement. Footfall Data is set to record the highest CAGR in this split, 6.7% over 2026–2032. Footfall Data is the fastest-growing segment as it provides critical insights into passenger traffic at stations, enabling better resource allocation. The expected rise in urban transport investments further accelerates the demand for this data type. Buyers will benefit significantly by investing in footfall data analytics to optimise operations and improve passenger experiences.
By Application Area – Metro Systems Dominated, Rail & Bus Fleets Expected to Grow Fastest
Metro Systems took a 39% share of application area in 2025, more than any other category. Metro Systems dominate the market due to their crucial role in managing urban metro services, which are vital for transit in densely populated areas. The Smart Cities Mission's objective to enhance urban mobility in 100 cities highlights the importance of metro systems in this initiative. Over 2026–2032, Rail & Bus Fleets are expected to post the fastest growth, at a CAGR of 7.0%. Rail & Bus Fleets are rapidly expanding as they are essential for optimising fleet operations, particularly with the growing emphasis on sustainable transport solutions. The government's push for electric buses by 2025 is expected to further drive this segment's growth. Suppliers should concentrate on developing analytics solutions tailored for rail and bus fleets to capitalise on the increasing demand for operational efficiency.
By End User – City Transit Authorities Dominated, Transport Planners Expected to Grow Fastest
The largest end user category in 2025 was City Transit Authorities, with a 45% share of total revenue. City Transit Authorities hold the largest share as they are the primary implementers of analytics solutions aimed at enhancing transit systems. Their pivotal role in urban mobility initiatives underscores their significance in shaping the future of the market. Transport Planners are projected to grow fastest, at a CAGR of 6.1% during 2026–2032. Transport Planners are the fastest-growing segment as they increasingly utilise data for strategic planning of transit systems. The revised National Policy on Urban Transport's emphasis on data-driven decision-making supports this upward trend. Suppliers should tailor their offerings to meet the specific needs of transport planners to seize this emerging market opportunity.
Key Attractiveness of the Report
- 10 Years of Market Numbers
- Historical Data Starting from 2022 to 2025
- Base Year 2025
- Forecast Data until 2032
- Key Performance Indicators Impacting the Market
- Major Upcoming Developments and Projects
Key Highlights of the Report:
- India Transit Analytics Market Outlook
- Market Size of India Transit Analytics Market, 2025
- Forecast of India Transit Analytics Market, 2032
- Historical Data and Forecast of India Transit Analytics Revenues & Volume for the Period 2022 - 2032F
- India Transit Analytics Market Trend Evolution
- India Transit Analytics Market Drivers and Challenges
- India Transit Analytics Price Trends
- India Transit Analytics Porter's Five Forces
- India Transit Analytics Industry Life Cycle
- Historical Data and Forecast of India Transit Analytics Market Revenues & Volume By Analytics Type for the Period 2022 - 2032F
- Historical Data and Forecast of India Transit Analytics Market Revenues & Volume By Operational Analytics for the Period 2022 - 2032F
- Historical Data and Forecast of India Transit Analytics Market Revenues & Volume By Predictive Analytics for the Period 2022 - 2032F
- Historical Data and Forecast of India Transit Analytics Market Revenues & Volume By Passenger Flow Analytics for the Period 2022 - 2032F
- Historical Data and Forecast of India Transit Analytics Market Revenues & Volume By Fare Analytics for the Period 2022 - 2032F
- Historical Data and Forecast of India Transit Analytics Market Revenues & Volume By Data Focus for the Period 2022 - 2032F
- Historical Data and Forecast of India Transit Analytics Market Revenues & Volume By Scheduling Efficiency for the Period 2022 - 2032F
- Historical Data and Forecast of India Transit Analytics Market Revenues & Volume By Maintenance Forecasting for the Period 2022 - 2032F
- Historical Data and Forecast of India Transit Analytics Market Revenues & Volume By Footfall Data for the Period 2022 - 2032F
- Historical Data and Forecast of India Transit Analytics Market Revenues & Volume By Revenue Optimization for the Period 2022 - 2032F
- Historical Data and Forecast of India Transit Analytics Market Revenues & Volume By Application Area for the Period 2022 - 2032F
- Historical Data and Forecast of India Transit Analytics Market Revenues & Volume By Metro Systems for the Period 2022 - 2032F
- Historical Data and Forecast of India Transit Analytics Market Revenues & Volume By Rail & Bus Fleets for the Period 2022 - 2032F
- Historical Data and Forecast of India Transit Analytics Market Revenues & Volume By Station Management for the Period 2022 - 2032F
- Historical Data and Forecast of India Transit Analytics Market Revenues & Volume By Public Transport for the Period 2022 - 2032F
- Historical Data and Forecast of India Transit Analytics Market Revenues & Volume By End User for the Period 2022 - 2032F
- Historical Data and Forecast of India Transit Analytics Market Revenues & Volume By City Transit Authorities for the Period 2022 - 2032F
- Historical Data and Forecast of India Transit Analytics Market Revenues & Volume By Transport Planners for the Period 2022 - 2032F
- Historical Data and Forecast of India Transit Analytics Market Revenues & Volume By Urban Mobility Managers for the Period 2022 - 2032F
- Historical Data and Forecast of India Transit Analytics Market Revenues & Volume By Local Governments for the Period 2022 - 2032F
- India Transit Analytics Import Export Trade Statistics
- Market Opportunity Assessment By Analytics Type
- Market Opportunity Assessment By Data Focus
- Market Opportunity Assessment By Application Area
- Market Opportunity Assessment By End User
- India Transit Analytics Top Companies Market Share
- India Transit Analytics Competitive Benchmarking By Technical and Operational Parameters
- India Transit Analytics Company Profiles
- India Transit Analytics Key Strategic Recommendations
Market Covered
This report examines the market across the segments below.
By Analytics Type
- Operational Analytics
- Predictive Analytics
- Passenger Flow Analytics
- Fare Analytics
By Data Focus
- Scheduling Efficiency
- Maintenance Forecasting
- Footfall Data
- Revenue Optimization
By Application Area
- Metro Systems
- Rail & Bus Fleets
- Station Management
- Public Transport
By End User
- City Transit Authorities
- Transport Planners
- Urban Mobility Managers
- Local Governments































