India Vehicle AR Interface Market Size & Growth Rate
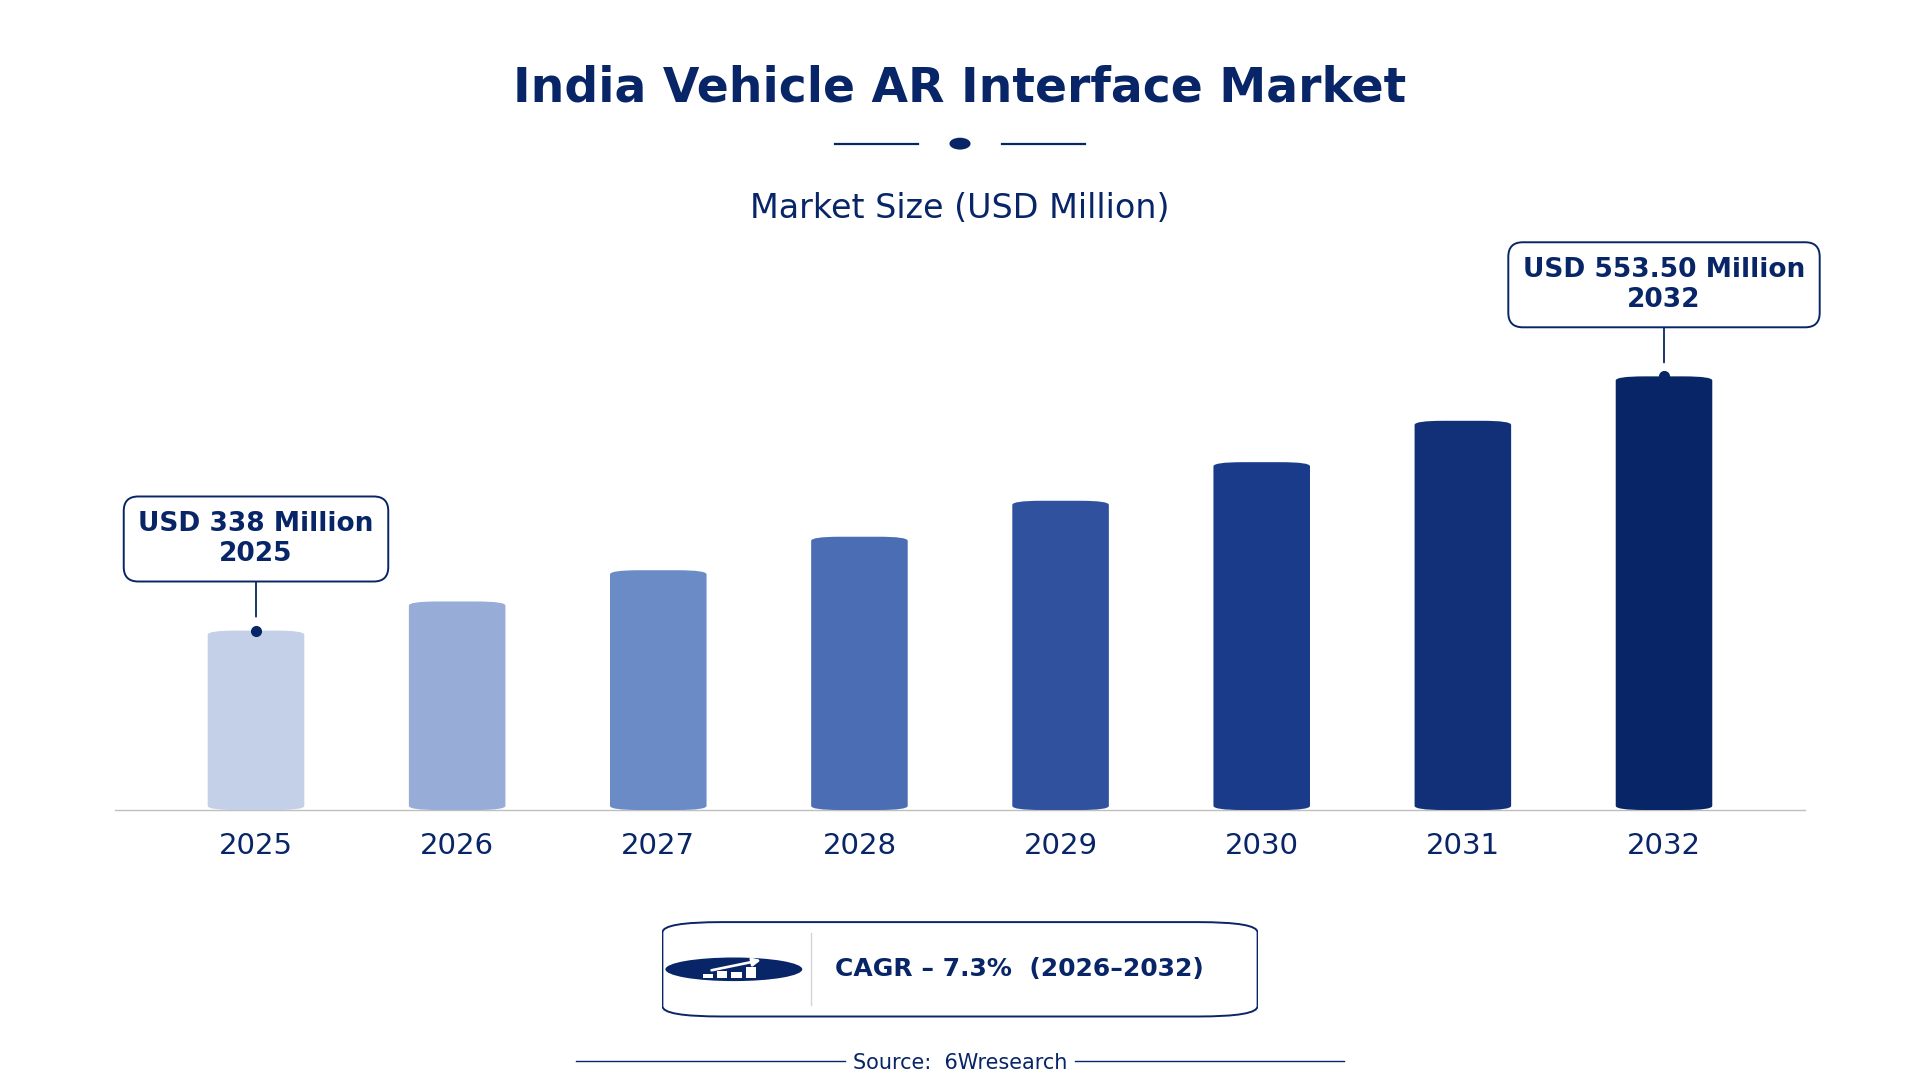
According to 6Wresearch internal database and industry insights, the India Vehicle AR Interface Market was valued at USD 338.0 million in 2025 and is projected to reach USD 553.50 million by 2032, growing at a CAGR of approximately 7.3% during 2026–2032.
India Vehicle AR Interface Market Highlights
| Report Metric | Details |
| Report Name | India Vehicle AR Interface Market |
| Market Size 2025 | USD 338.0 million |
| Market Size 2032 | USD 553.50 million |
| Absolute Growth 2025–2032 | USD 215.50 million |
| CAGR 2026–2032 | 7.3% |
| Peak Annual Growth | 9.4% in 2026 |
| Forecast Period | 2026–2032 |
| Historical Data | 2022–2025 |
| Base Year | 2025 |
| Leading Interface Type, 2025 | Head-Up Display (HUD) (48% share) |
| Leading Display Technology, 2025 | Augmented Overlay (36% share) |
| Leading Application, 2025 | Navigation (32% share) |
| Leading End User, 2025 | EV and Premium OEMs (36% share) |
| Fastest-Growing Interface Type | In-Vehicle AR Display (9.3% CAGR) |
| Fastest-Growing Application | Real-Time Driver Info (8.7% CAGR) |
| Fastest-Growing End User | Connected Vehicles (10.0% CAGR) |
| Growing Sector | Electric Vehicles |
| Key End Users | EV Manufacturers, Premium OEMs, Automotive Suppliers, Fleet Operators |
India Vehicle AR Interface Market Year-wise Growth Rate and Key Drivers (2022–2032)
This graph illustrates the annual growth rates of the market from 2022 to 2032, highlighting a steady upward trajectory and projected market expansion over the forecast period.
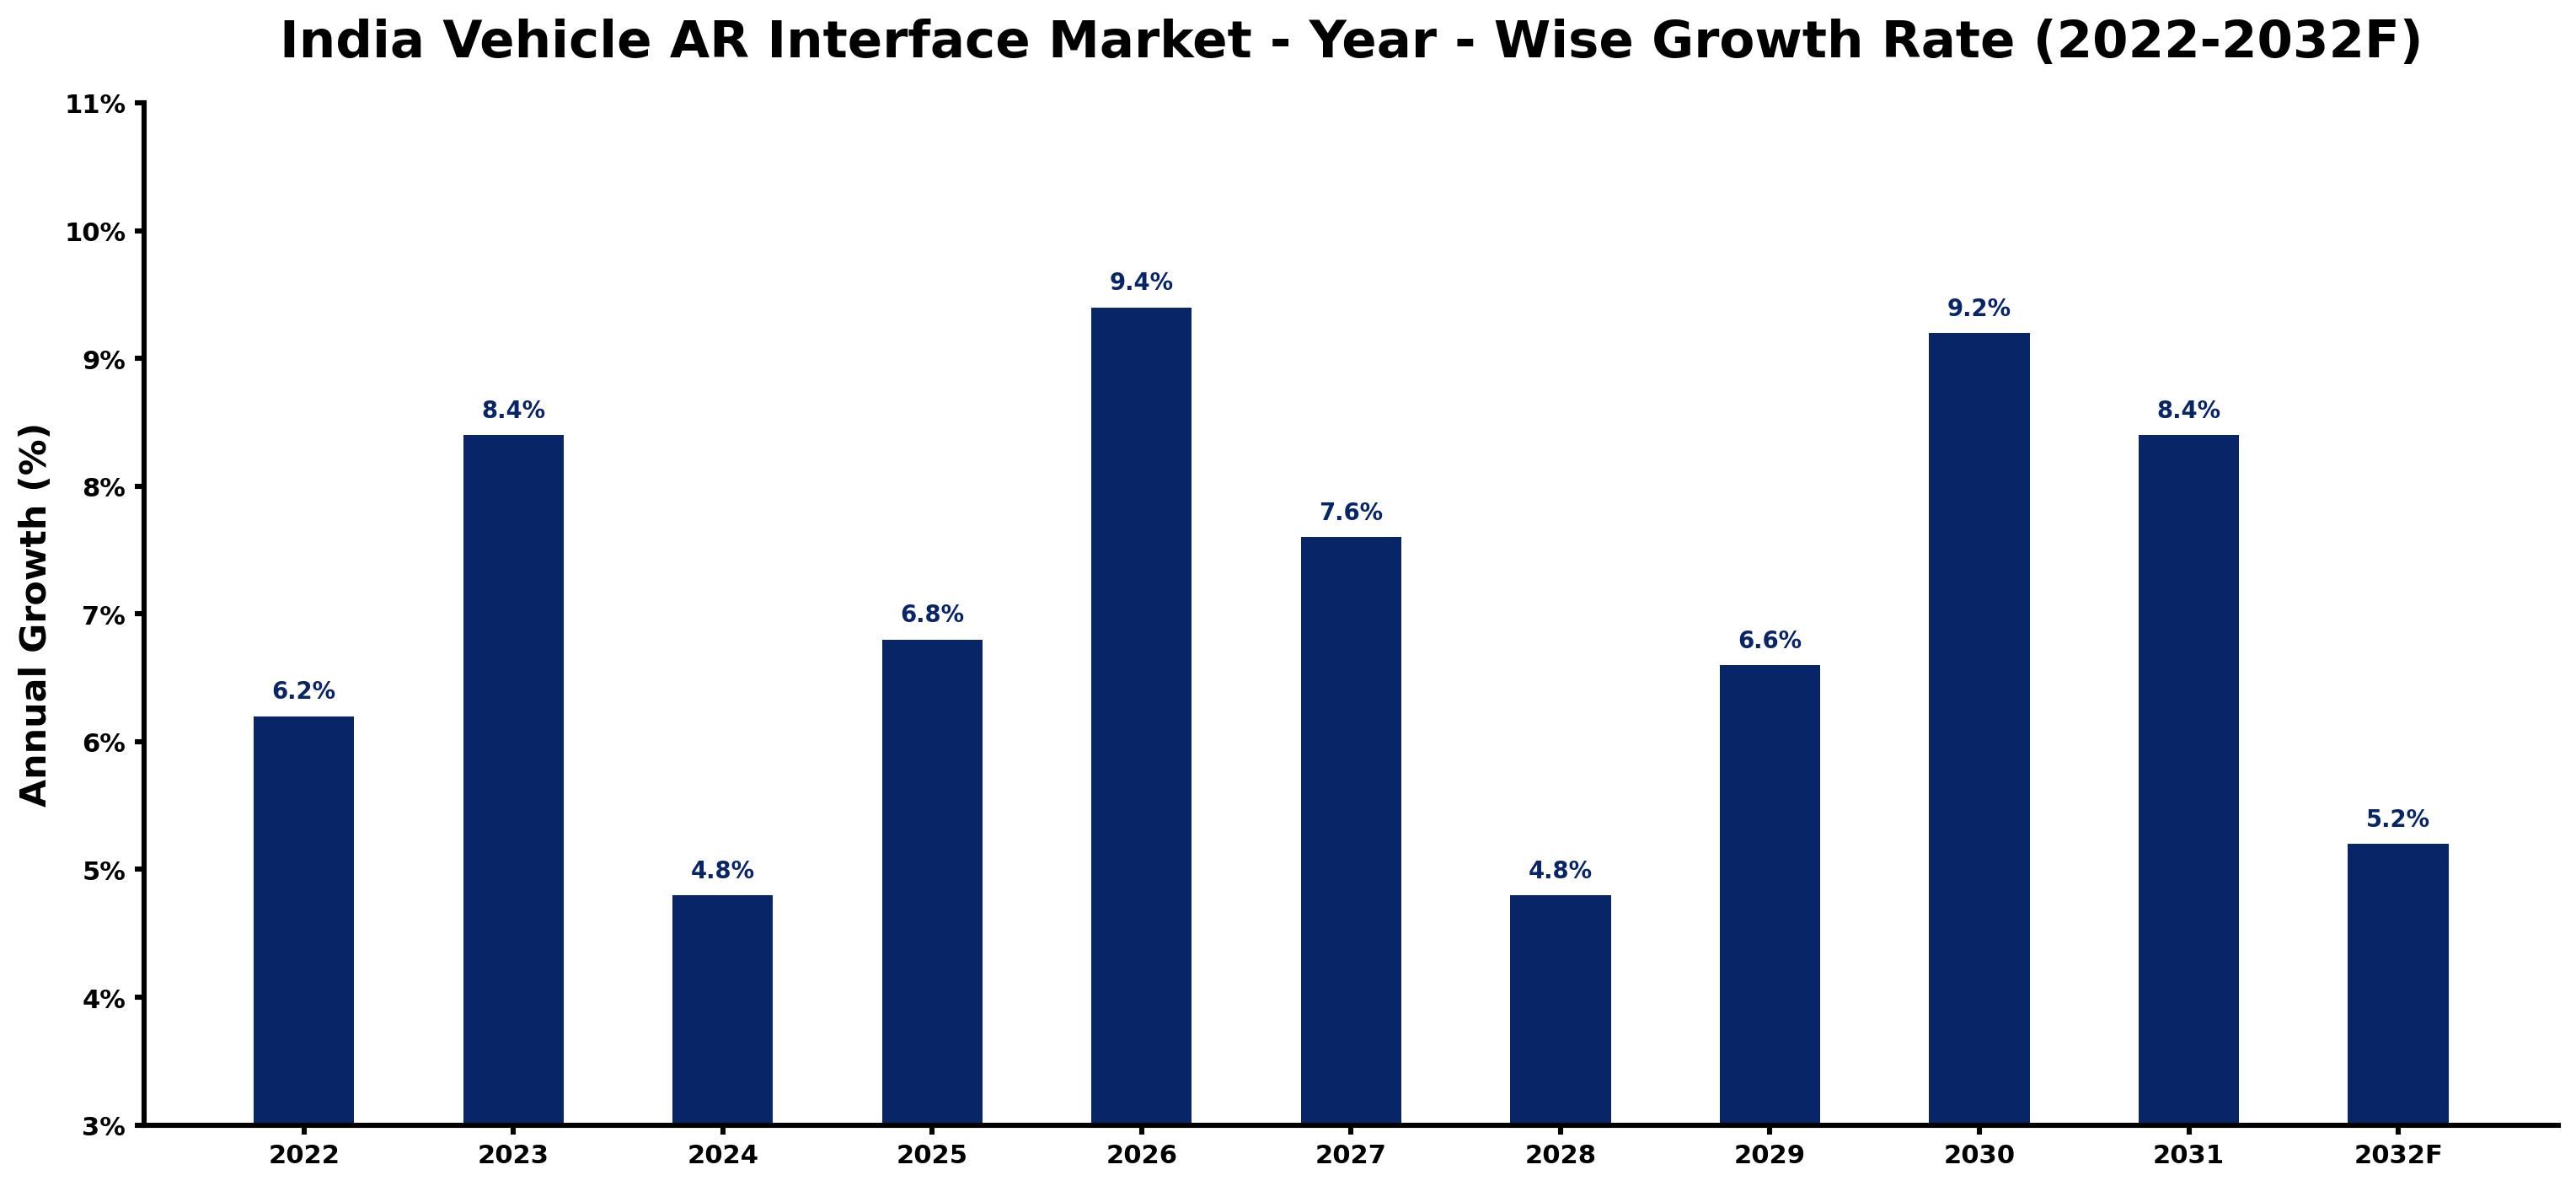
Year by year, the estimates below pair each growth rate with the development that shaped it.
| Year | Estimated Annual Growth (%) | Market Rationale |
| 2022 | 6.2 | The market showed steady growth with increased interest in advanced vehicle technologies, driven by rising consumer demand for enhanced navigation systems. |
| 2023 | 8.4 | Growth accelerated due to rising electric vehicle adoption and increased consumer awareness of AR benefits in vehicles. |
| 2024 | 4.8 | Growth slowed as the market adjusted to previous rapid expansions and demand stabilised following the introduction of new safety standards. |
| 2025 | 6.8 | Demand increased again as infrastructure for electric vehicles improved significantly, supported by government initiatives for AR technologies. |
| 2026 | 9.4 | The market peaked with heightened investments in connected vehicle technologies and AR interfaces, driven by the National Electric Mobility Mission Plan. |
| 2027 | 7.6 | Growth slowed as the market began to mature and competition intensified among suppliers of AR technologies. |
| 2028 | 4.8 | The market continued to grow but at a slower pace as integration challenges with existing vehicle systems became more apparent. |
| 2029 | 6.6 | Growth picked up again as new applications for AR interfaces emerged in vehicles, particularly in the electric vehicle segment. |
| 2030 | 9.2 | Demand surged with the government's push for connected vehicle technologies and updated safety standards, enhancing market potential. |
| 2031 | 8.4 | Growth slowed as the market faced challenges in maintaining high adoption rates amid evolving consumer preferences. |
| 2032 | 5.2 | The market growth rate declined further as competition and market maturity became evident, leading to a slowdown in new investments. |
Note: Market size estimations and growth projections presented in this report are based on 6Wresearch's proprietary forecasting methodology, utilizing the latest available industry data, government publications, and primary research inputs.
India Vehicle AR Interface Market Synopsis
The India Vehicle AR Interface Market includes technologies that overlay digital information onto real-world driving experiences. These interfaces offer navigation assistance, real-time driver information, and diagnostics through advanced hardware and software. The market is growing due to the rise in electric vehicle adoption and substantial investments in connected vehicle technologies. In 2022, over 1.4 million electric vehicles were sold, increasing the demand for these interfaces. Initiatives like the National Electric Mobility Mission Plan are driving growth by encouraging advanced automotive technologies.
Market Dynamics Impact Analysis (2026–2032)
| Factor | Type | Impact | Primary Segment Affected |
| Rising electric vehicle adoption and infrastructure development are driving demand for advanced AR interfaces. | Driver | High | Navigation |
| Increased consumer interest in real-time driver information enhances the market for AR technologies. | Driver | High | Real-Time Driver Info |
| The push for connected vehicle technologies presents opportunities for suppliers to enter the market. | Opportunity | High | Connected Vehicles |
| Growing demand for safety features in vehicles creates a need for advanced AR applications. | Opportunity | High | Advanced Driver Assist |
| High costs associated with developing AR technologies may limit smaller players' market entry. | Restraint | Medium | In-Vehicle AR Display |
| Regulatory compliance for safety standards can delay product launches and increase costs. | Restraint | Medium | Head-Up Display (HUD) |
| Buyers face challenges in integrating AR technologies with existing vehicle systems, complicating adoption. | Challenge | High | Augmented Overlay |
| Suppliers encounter difficulties in scaling production to meet increasing demand for AR interfaces. | Challenge | High | Embedded Screen |
Evaluation of Drivers in India Vehicle AR Interface Market (2026–2032)
The factors lifting demand, and the evidence behind each, are summarised below.
| Drivers | Primary Segment Affected | Why It Matters (Evidence) |
| Rising electric vehicle sales drive demand for AR interfaces to improve user experience. | Navigation | Over 1.4 million electric vehicles were sold in 2022, increasing the need for advanced navigation systems. |
| Consumer demand for real-time information encourages manufacturers to integrate AR technologies. | Real-Time Driver Info | The growing interest in vehicle performance monitoring leads to increased purchases of AR interfaces. |
| Government initiatives for electric vehicle adoption stimulate investment in AR technologies. | Connected Vehicles | The National Electric Mobility Mission Plan aims for 30% EV adoption by 2030, boosting AR interface demand. |
| Safety regulations compel manufacturers to adopt advanced AR systems in vehicles. | Advanced Driver Assist | Updated safety standards from the Automotive Research Association of India increase the need for AR applications. |
| Infrastructure development for electric vehicles supports the deployment of AR technologies. | In-Vehicle AR Display | The Delhi-Mumbai Expressway is a key region for testing connected vehicle technologies, driving AR adoption. |
Growth in the Vehicle AR Interface market in India comes from rising electric vehicle sales, which drive demand for advanced navigation systems. Over 1.4 million electric vehicles were sold in 2022, increasing the need for AR interfaces. Consumer interest in real-time driver information is prompting manufacturers to integrate AR technologies, leading to higher purchases. Infrastructure development, particularly along the Delhi-Mumbai Expressway, supports the deployment of AR technologies, creating further opportunities for growth.
Evaluation of Restraints in India Vehicle AR Interface Market
The following restraints limit how fast demand can grow.
| Market Restraint | Primary Segment Affected | Why It Matters (Evidence) |
| High development costs for AR technologies may limit market participation. | In-Vehicle AR Display | Developing advanced AR systems requires substantial investment, which can deter smaller companies. |
| Compliance with evolving safety regulations can delay product launches. | Head-Up Display (HUD) | Manufacturers must meet stringent safety standards, impacting their time-to-market. |
| Integration challenges with existing vehicle systems complicate AR adoption. | Augmented Overlay | Buyers may face difficulties incorporating new technologies into older vehicle models. |
| Limited consumer awareness of AR benefits may hinder market growth. | Embedded Screen | Potential buyers might not fully understand the advantages of AR interfaces, affecting sales. |
| Competition among suppliers can lead to price wars, impacting profitability. | Navigation | As more players enter the market, pricing pressures may reduce margins for existing suppliers. |
India Vehicle AR Interface Market Challenges
The sale of over 1.4 million electric vehicles in India in 2022 has heightened competition among suppliers of Vehicle AR Interfaces, compelling them to reduce prices and impacting profit margins. Compliance with regulatory standards set by the Automotive Research Association of India can delay product launches, creating bottlenecks for suppliers aiming to introduce new technologies. Suppliers are pressured to invest in R&D due to rapid technological advancements, raising operational costs and potentially deterring smaller players from entering the market. The high costs associated with integrating advanced hardware and software into existing vehicles can discourage buyers, particularly in a market with over 200 million registered vehicles, limiting overall adoption rates.
Trends in the India Vehicle AR Interface Market
Buyers and suppliers in the India Vehicle AR Interface Market are adjusting to the following trends.
- Shift from Traditional Displays to Augmented Reality Interfaces: The automotive industry is increasingly adopting augmented reality interfaces over traditional displays. In 2022, the sale of over 1.4 million electric vehicles in India underscored the demand for advanced navigation systems, prompting manufacturers to innovate.
- Growing Emphasis on Real-Time Information: Consumers are prioritising real-time information in vehicles, driving demand for AR technologies. The introduction of new safety standards in 2022 has led to increased integration of real-time driver information systems in vehicles.
- Increased Investment in Connected Vehicle Technologies: Investment in connected vehicle technologies is rising, with the government announcing a $1 billion fund in 2023. This funding aims to improve infrastructure for electric vehicles and promote advanced AR applications.
- Expansion of AR Applications in EVs: The use of AR applications in electric vehicles is expanding rapidly, driven by the need for advanced driver assistance systems. The National Electric Mobility Mission Plan aims for 30% EV adoption by 2030, supporting this trend.
Investment Opportunities in the India Vehicle AR Interface Market
Some of the investment opportunities in the India Vehicle AR Interface Market are mentioned below.
- Timing for Investment in AR Technologies: Now is an opportune time to invest in AR technologies as the market is projected to reach USD 338 million by 2025. Suppliers can target EV and premium OEMs to meet the growing demand.
- Demand from EV Manufacturers: Electric vehicle manufacturers are increasingly seeking advanced AR interfaces to improve user experience. Collaborating with EV manufacturers can open new avenues for suppliers in this growing market.
- Focus on Infrastructure Development: Investment in electric vehicle infrastructure is essential, with the government allocating $1 billion for development. Suppliers can partner with local governments to provide AR solutions for connected vehicles.
- Addressing Consumer Awareness Gaps: With over 200 million registered vehicles in India, there is a significant opportunity to educate consumers about AR benefits. Suppliers can develop marketing strategies to increase awareness and drive adoption.
Government Initiatives in the India Vehicle AR Interface Market
The National Electric Mobility Mission Plan 2020, launched by the Ministry of Heavy Industries, aims for 30% electric vehicle adoption by 2030. This initiative encourages manufacturers to develop advanced AR technologies that improve the driving experience. The FAME II scheme, initiated in 2019, provides subsidies for electric vehicles, further promoting the adoption of AR interfaces in vehicles. These measures create a supportive environment for producers and buyers, driving demand for innovative solutions in the market.
In 2022, the National Automotive Testing and R&D Infrastructure Project (NATRiP) received an additional budget of $500 million to enhance automotive testing facilities. This funding, administered by the Ministry of Heavy Industries, supports the development of advanced vehicle technologies, including AR interfaces. The Automotive Research Association of India (ARAI) updated safety standards for AR technologies in 2022, ensuring compliance and improving vehicle safety protocols. These initiatives facilitate the integration of AR technologies into the automotive sector, benefiting both producers and consumers.
Future Insight of the India Vehicle AR Interface Market
The Vehicle AR Interface market in India is poised for growth as the government aims for 30% electric vehicle adoption by 2030, which will drive demand for these technologies. The $1 billion fund for electric vehicle infrastructure development will facilitate the integration of AR applications into the automotive ecosystem. The National Automotive Testing and R&D Infrastructure Project will further support innovation in this field. By 2026, the Automotive Mission Plan is expected to create a $300 billion industry, opening up significant opportunities for both buyers and suppliers in the Vehicle AR Interface market.
Market Segmentation Analysis
Each segment group is reviewed below, with the leader by share and the fastest grower by CAGR.
By Interface Type – Head-Up Display (HUD) Dominated, In-Vehicle AR Display Expected to Grow Fastest
According to Bhawna Singh, Assistant Manager at 6Wresearch, the largest interface type category in 2025 was Head-Up Display (HUD), with a 48% share of total revenue. The Head-Up Display (HUD) segment holds the largest share as it provides essential driving information without distracting the driver, making it indispensable for safe navigation. Its popularity is particularly evident among electric vehicle manufacturers who prioritise real-time data integration. The quickest growth will come from In-Vehicle AR Display, forecast to expand at a CAGR of 9.3% between 2026 and 2032. The In-Vehicle AR Display is experiencing rapid growth as manufacturers increasingly focus on creating interactive user experiences that enhance driving comfort. This trend aligns with the growing demand for advanced interfaces in the electric vehicle sector, ensuring the lead of HUD continues to widen. Suppliers must prioritise HUD technology development to cater to the rising demand from electric vehicle manufacturers.
By Display Technology – Augmented Overlay Dominated and Is Expected to Record the Fastest Growth
Augmented Overlay took a 36% share of display technology in 2025, more than any other category. Augmented Overlay commands the largest market share as it effectively integrates digital data with real-world views, making it a preferred choice among vehicle manufacturers. Its role in enhancing navigation and driver assistance systems solidifies its leading position in the market. Its lead should widen, with a projected CAGR of 9.9% during 2026–2032, the highest in this split. The Augmented Overlay segment is also the fastest-growing due to its versatility across various applications, including navigation and real-time information display. With the increasing emphasis on connected vehicle technologies, this segment is set for sustained growth. Buyers will benefit from suppliers focusing on Augmented Overlay technologies, ensuring competitiveness in the evolving vehicle AR interface market.
By Application – Navigation Dominated, Real-Time Driver Info Expected to Grow Fastest
With a 32% revenue share in 2025, Navigation was the largest application category. Navigation applications dominate the market share as they are crucial for route guidance and traffic updates, particularly in densely populated urban areas. The vast number of registered vehicles in India, exceeding 200 million, significantly boosts the demand for effective navigation systems. Real-Time Driver Info is projected to grow fastest, at a CAGR of 8.7% during 2026–2032. Real-Time Driver Info is the fastest-growing application segment, driven by the increasing need for monitoring vehicle performance. The rise in electric vehicle adoption will further escalate the demand for real-time data, supporting this segment's expansion. Suppliers should enhance real-time driver information systems to align with the growing expectations of modern vehicle users.
By End User – EV and Premium OEMs Dominated, Connected Vehicles Expected to Grow Fastest
EV and Premium OEMs accounted for a 36% market share by end user in 2025. EV and Premium OEMs capture the largest market share as they are primary users of advanced AR technologies, aiming to improve their vehicle offerings. The substantial sales of electric vehicles, with over 1.4 million units sold in 2022, underscore their critical role in the market. Over 2026–2032, Connected Vehicles are expected to post the fastest growth, at a CAGR of 10.0%. Connected Vehicles are the fastest-growing end user segment, enabling communication between vehicles and infrastructure, which enhances driving safety and efficiency. The ongoing development of smart infrastructure in India will further accelerate this segment's growth. Suppliers should align their strategies with the needs of connected vehicle manufacturers to seize opportunities in this rapidly expanding market.
Key Attractiveness of the Report
- 10 Years of Market Numbers
- Historical Data Starting from 2022 to 2025
- Base Year 2025
- Forecast Data until 2032
- Key Performance Indicators Impacting the Market
- Major Upcoming Developments and Projects
Key Highlights of the Report:
- India Vehicle AR Interface Market Outlook
- Market Size of India Vehicle AR Interface Market, 2025
- Forecast of India Vehicle AR Interface Market, 2032
- Historical Data and Forecast of India Vehicle AR Interface Revenues & Volume for the Period 2022 - 2032F
- India Vehicle AR Interface Market Trend Evolution
- India Vehicle AR Interface Market Drivers and Challenges
- India Vehicle AR Interface Price Trends
- India Vehicle AR Interface Porter's Five Forces
- India Vehicle AR Interface Industry Life Cycle
- Historical Data and Forecast of India Vehicle AR Interface Market Revenues & Volume By Interface Type for the Period 2022 - 2032F
- Historical Data and Forecast of India Vehicle AR Interface Market Revenues & Volume By Head-Up Display (HUD) for the Period 2022 - 2032F
- Historical Data and Forecast of India Vehicle AR Interface Market Revenues & Volume By Windshield Display for the Period 2022 - 2032F
- Historical Data and Forecast of India Vehicle AR Interface Market Revenues & Volume By In-Vehicle AR Display for the Period 2022 - 2032F
- Historical Data and Forecast of India Vehicle AR Interface Market Revenues & Volume By Wearable AR for the Period 2022 - 2032F
- Historical Data and Forecast of India Vehicle AR Interface Market Revenues & Volume By Display Technology for the Period 2022 - 2032F
- Historical Data and Forecast of India Vehicle AR Interface Market Revenues & Volume By Projection/Optical Lens for the Period 2022 - 2032F
- Historical Data and Forecast of India Vehicle AR Interface Market Revenues & Volume By Augmented Overlay for the Period 2022 - 2032F
- Historical Data and Forecast of India Vehicle AR Interface Market Revenues & Volume By Embedded Screen for the Period 2022 - 2032F
- Historical Data and Forecast of India Vehicle AR Interface Market Revenues & Volume By Smart Glasses Integration for the Period 2022 - 2032F
- Historical Data and Forecast of India Vehicle AR Interface Market Revenues & Volume By Application for the Period 2022 - 2032F
- Historical Data and Forecast of India Vehicle AR Interface Market Revenues & Volume By Navigation, Speed, Alerts for the Period 2022 - 2032F
- Historical Data and Forecast of India Vehicle AR Interface Market Revenues & Volume By Real-Time Driver Info for the Period 2022 - 2032F
- Historical Data and Forecast of India Vehicle AR Interface Market Revenues & Volume By Infotainment, Diagnostics for the Period 2022 - 2032F
- Historical Data and Forecast of India Vehicle AR Interface Market Revenues & Volume By Fleet & Training Usage for the Period 2022 - 2032F
- Historical Data and Forecast of India Vehicle AR Interface Market Revenues & Volume By End User for the Period 2022 - 2032F
- Historical Data and Forecast of India Vehicle AR Interface Market Revenues & Volume By EV and Premium OEMs for the Period 2022 - 2032F
- Historical Data and Forecast of India Vehicle AR Interface Market Revenues & Volume By Advanced Driver Assist for the Period 2022 - 2032F
- Historical Data and Forecast of India Vehicle AR Interface Market Revenues & Volume By Connected Vehicles for the Period 2022 - 2032F
- Historical Data and Forecast of India Vehicle AR Interface Market Revenues & Volume By Autonomous Test Fleets for the Period 2022 - 2032F
- India Vehicle AR Interface Import Export Trade Statistics
- Market Opportunity Assessment By Interface Type
- Market Opportunity Assessment By Display Technology
- Market Opportunity Assessment By Application
- Market Opportunity Assessment By End User
- India Vehicle AR Interface Top Companies Market Share
- India Vehicle AR Interface Competitive Benchmarking By Technical and Operational Parameters
- India Vehicle AR Interface Company Profiles
- India Vehicle AR Interface Key Strategic Recommendations
Market Covered
Segments analysed in this report are listed below.
By Interface Type
- Head-Up Display (HUD)
- Windshield Display
- In-Vehicle AR Display
- Wearable AR
By Display Technology
- Projection/Optical Lens
- Augmented Overlay
- Embedded Screen
- Smart Glasses Integration
By Application
- Navigation
- Speed
- Alerts
- Real-Time Driver Info
- Infotainment
- Diagnostics
- Fleet & Training Usage
By End User
- EV and Premium OEMs
- Advanced Driver Assist
- Connected Vehicles
- Autonomous Test Fleets































