Indonesia Electronic Components Market (2026-2032) | Trends, Companies, Analysis, Growth, Revenue, Industry, Size, Value, Outlook, Share & Forecast
Market Forecast By Types (Passive , Active, Electro Mechanic), By Applications (Automotive, Communications, Industrial, Computing Applications, Others) And Competitive Landscape
| Product Code: ETC036528 | Publication Date: Jul 2023 | Updated Date: Jun 2026 | Product Type: Report | |
| Publisher: 6Wresearch | Author: Ravi Bhandari | No. of Pages: 70 | No. of Figures: 35 | No. of Tables: 5 |
Indonesia Electronic Components Market Summary
The indonesia electronic components market was estimated at USD 239 Million in 2025 and is projected to reach USD 316 Million by 2032, growing at a CAGR of 5.5% from 2026 to 2032.
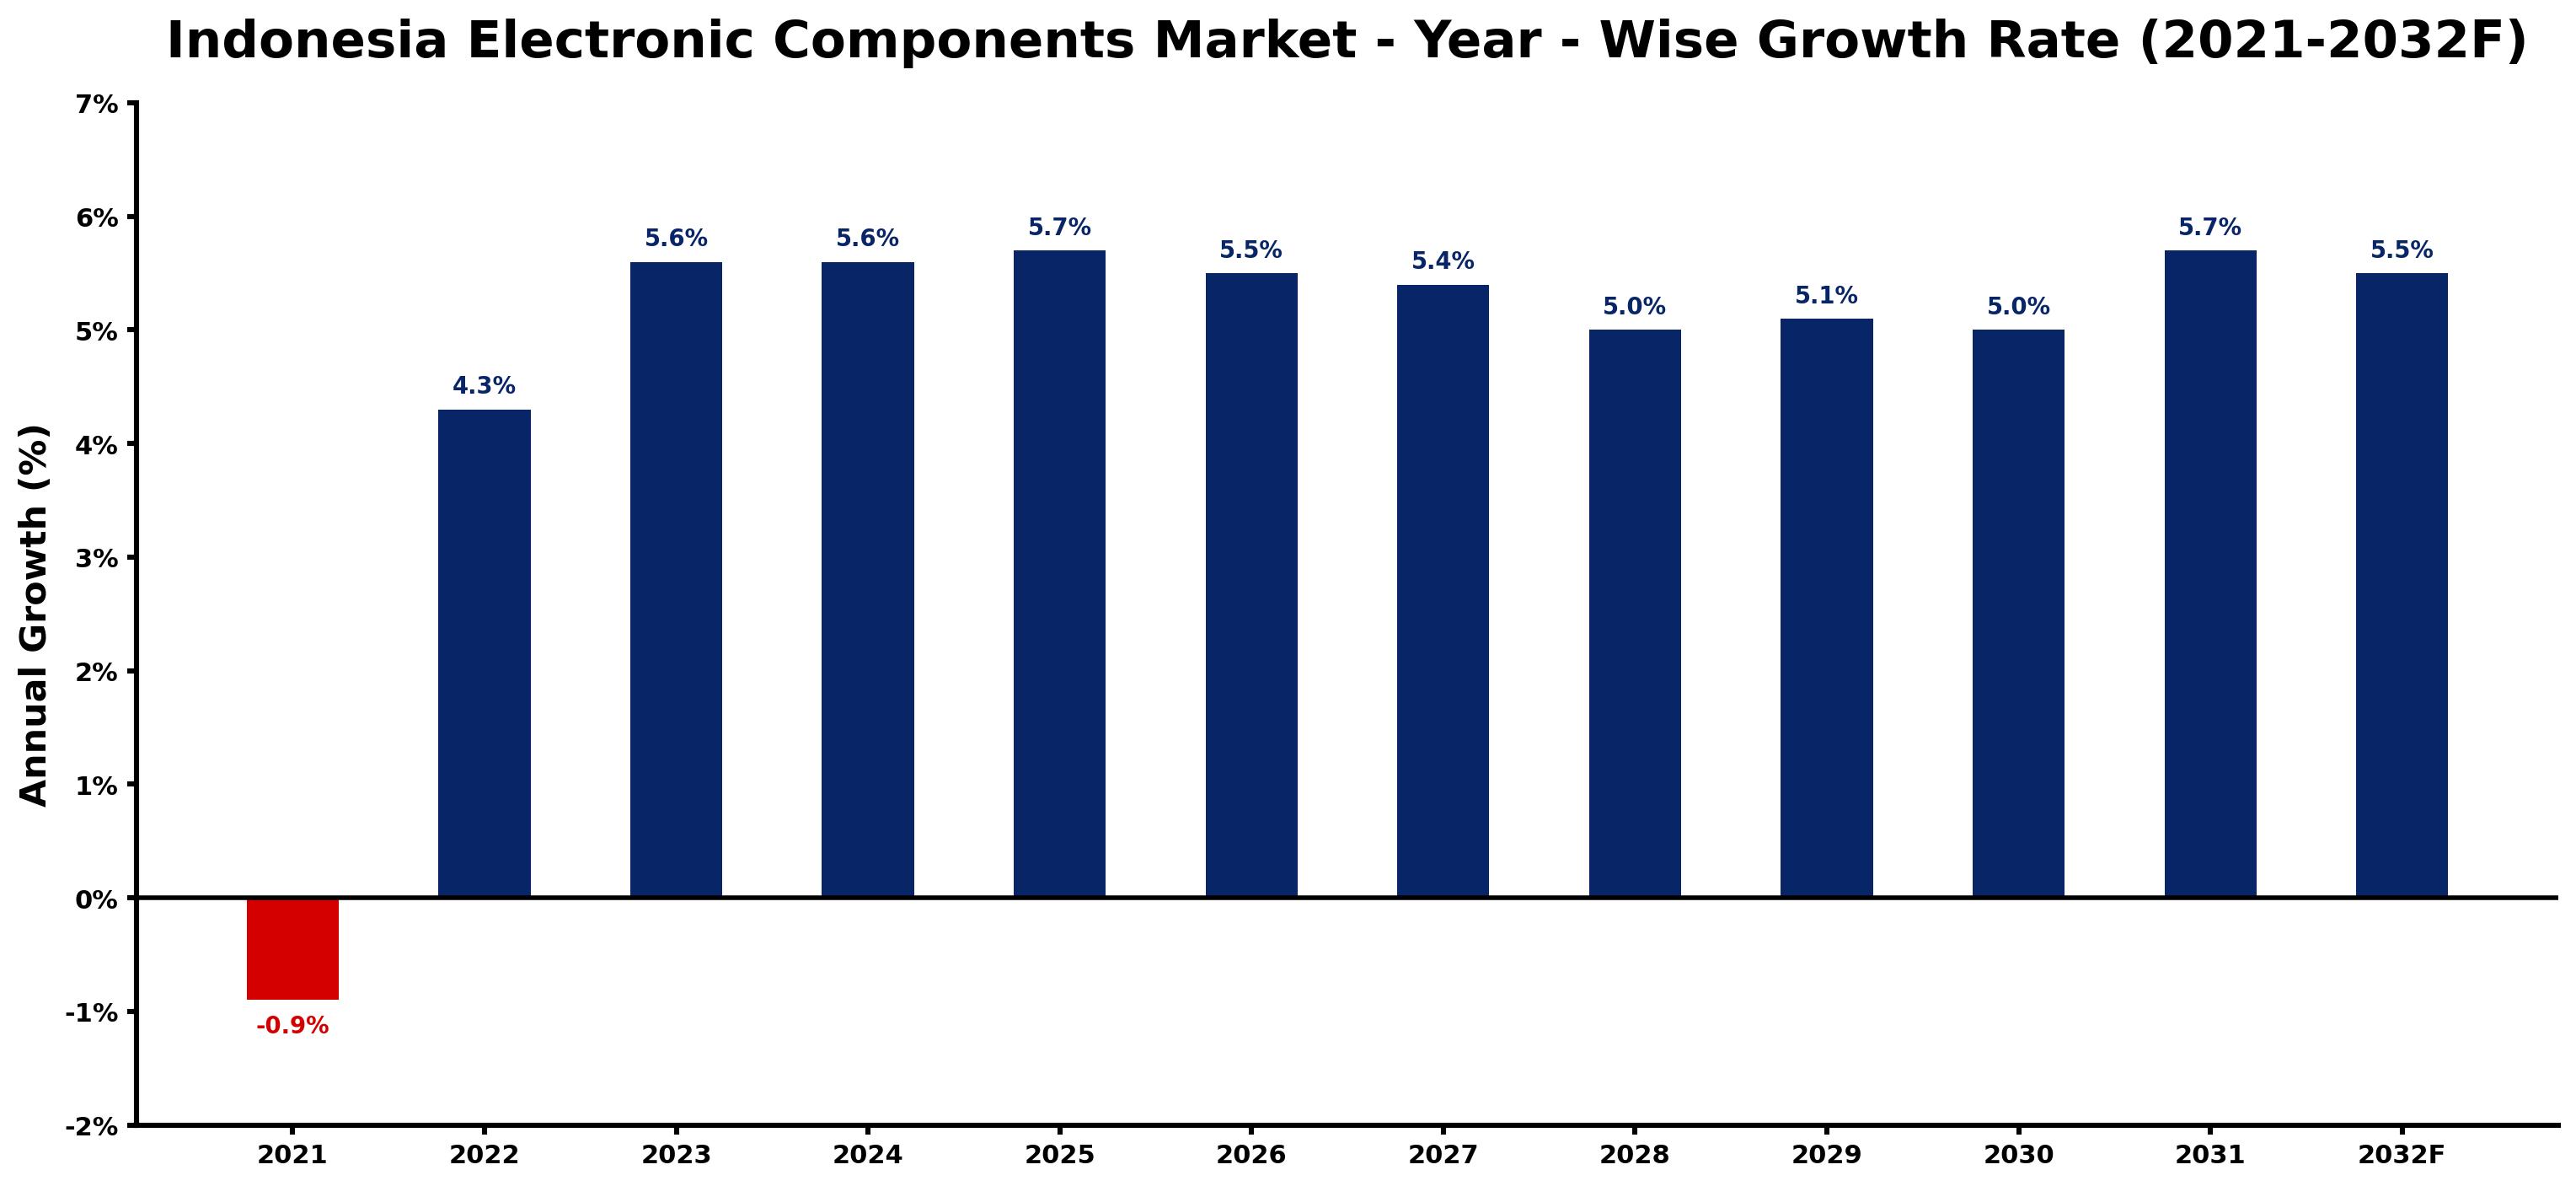
Indonesia Electronic Components Market Growth Rate Analysis (2021-2032)
The Indonesian electronic components market has exhibited a significant recovery following a 0.9% decline in 2021, driven by expanding consumer demand and increased investments in technology and infrastructure. With growth rates climbing to 4.3% in 2022 and leveling at around 5.6% in both 2023 and 2024, the upward trend highlights the rising adoption of digitalization and energy transition initiatives. As manufacturers enhance production capabilities to meet the growing requirements of industries such as automotive and telecommunications, the market is set to maintain a robust growth forecast, sustaining rates of 5.5% to 5.7% through 2032, reflecting a favorable business environment and supportive government policies.
Indonesia Electronic Components Market Year-wise Growth Rate and Key Drivers
This graph highlights how the Indonesia Electronic Components Market has steadily grown over the past five years, supported by major growth factors.
The table below presents the year wise growth rates along with the key drivers influencing the market
| Year | Growth Rate | Major Drivers |
| 2021 | -0.9% | Supply chain disruptions stemming from the pandemic hindered production capabilities and delayed product availability in the market. |
| 2022 | 4.3% | Supply chain disruptions prompted local manufacturing initiatives to enhance self-sufficiency. |
| 2023 | 5.6% | Emerging technology sectors, particularly IoT, expanded the market's growth potential significantly. |
| 2024 | 5.6% | The automotive industry's electronic transformation attracted substantial investment in components. |
| 2025 | 5.7% | Local startups began leveraging advanced technologies, stimulating competition among suppliers. |
| 2026 | 5.5% | Increased smartphone penetration resulted in higher demand for diverse electronic components. |
| 2027 | 5.4% | Digital transformation initiatives across industries highlighted the importance of reliable components. |
| 2028 | 5.0% | Collaboration between tech firms and universities fueled innovation in component design. |
| 2029 | 5.1% | Growing consumer awareness of smart home solutions drove demand for advanced sensors. |
| 2030 | 5.0% | Regional trade agreements helped reduce tariffs on imported electronic components. |
| 2031 | 5.7% | Sustainability trends encouraged manufacturers to explore eco-friendly, recyclable components. |
| 2032 | 5.5% | Integration of AI in manufacturing processes optimized production efficiency and reduced costs. |
Note - Market size estimations and growth projections presented in this report are based on 6Wresearch's advanced forecasting approach, validated with industry datasets as of June 2026.
Indonesia Electronic Components Market Synopsis
The Indonesia Electronic Components Market is projected to reach 5.5% and witness significant growth during the forecast period (2026-2032). This growth trajectory is primarily driven by the rising demand from the automotive sector and an increasing appetite for consumer electronics among Indonesian consumers. As disposable incomes rise and the population expands, the sales of electronic devices are poised to surge, presenting substantial opportunities for manufacturers to enhance their production capabilities. Furthermore, supportive government policies, including tax exemptions on imports of essential raw materials for industrial equipment, are fostering a more favorable investment climate in this sector.
Indonesia Electronic Components Market Growth Drivers
The Indonesian electronic components market is experiencing robust growth, propelled by several key factors:
- Firstly, the automotive industry is witnessing a considerable uptrend, with increasing wage levels and improved economic conditions across various regions. This surge leads to higher demand for quality electronic components essential for modern vehicles.
- Secondly, the booming consumer electronics market in Indonesia is further augmented by the country's youthful demographic, which drives demand for smartphones, laptops, and other electronic devices.
- Additionally, an expanding middle class, fueled by rising disposable incomes, is contributing to the enhanced purchasing power and increased consumption of electronic goods.
- Moreover, advancements in technology, such as the rapid evolution of Internet of Things (IoT) applications, are creating new avenues for electronic component manufacturers to explore innovative and sophisticated products.
- Lastly, the entry of various international suppliers into the market is intensifying competition and encouraging local companies to innovate and improve their offerings.
Indonesia Electronic Components Market Challenges and Restraints
Despite the growth potential, the Indonesia Electronic Components Market faces several challenges that could impede progress:
- One of the primary challenges is the implementation of import duties and tariffs aimed at protecting domestic industries. These regulations can hinder foreign manufacturers from entering the market, as they must navigate complex tax frameworks specific to Indonesia.
- Fluctuations in currency values, often influenced by geopolitical events and trade tensions, can significantly impact the pricing of imported goods, making them less competitive against local alternatives.
- Infrastructure deficiencies also pose a challenge, as inadequate logistics and transportation networks can disrupt the supply chain and lead to inefficiencies in distribution processes.
- Moreover, fluctuating market demands can create uncertainty for producers, as rapid shifts in consumer preferences necessitate agile production capabilities to keep pace with the latest trends.
- Finally, the evolving regulatory environment can introduce unexpected operational complexities for businesses, requiring them to stay vigilant and adaptable to remain compliant and competitive.
Indonesia Electronic Components Market Government Investment and Initiatives
The Indonesian government is actively fostering the electronic components sector through various investment initiatives and policies:
- The government has introduced tax incentives for manufacturers in the electronic components industry, including exemptions on import duties for key raw materials, motivating local and foreign investments.
- Additionally, national development plans prioritize infrastructure improvements crucial for supporting the electronic manufacturing sector, enhancing connectivity and logistics.
- Public spending in research and development is being promoted, leading to innovation and modernization within the industry.
- The government is also encouraging public-private partnerships to facilitate knowledge sharing and access to advanced technologies that can bolster local manufacturing capabilities.
- Finally, educational initiatives aimed at upskilling the workforce in electronic engineering and technology are being implemented, ensuring a well-prepared labor pool to support industry growth.
Indonesia Electronic Components Market Latest Developments (May 2025 - June 2026)
Recent developments in the Indonesia Electronic Components Market indicate a dynamic shift toward innovation and technological advancement. Over the specified period, there has been a noticeable increase in collaborations between local manufacturers and international firms, aimed at enhancing product quality and diversifying offerings. The government has also reinforced its commitment to supporting the industry through continued investment in infrastructure, which is essential for boosting production efficiency. Moreover, rising consumer demand for smart devices has prompted manufacturers to focus on sustainable and high-performance electronic components, reflecting a growing trend toward environmentally-conscious production practices. This evolving landscape sets the stage for a lively and competitive market environment moving forward.
Indonesia Electronic Components Market - Key Attractiveness of the Report
- 10 Years of Market Numbers
- Historical Data Starting from 2022 to 2025
- Base Year: 2025
- Forecast Data until 2032
- Key Performance Indicators Impacting the Market
- Major Upcoming Developments and Projects
Key Highlights of the Report:
- Indonesia Electronic Components Market Outlook
- Market Size of Indonesia Electronic Components Market, 2025
- Forecast of Indonesia Electronic Components Market, 2032F
- Historical Data and Forecast of Indonesia Electronic Components Revenues & Volume for the Period 2022-2032F
- Indonesia Electronic Components Market Trend Evolution
- Indonesia Electronic Components Market Drivers and Challenges
- Indonesia Electronic Components Price Trends
- Indonesia Electronic Components Porter's Five Forces
- Indonesia Electronic Components Industry Life Cycle
- Historical Data and Forecast of Indonesia Electronic Components Market Revenues & Volume By Types for the Period 2022-2032F
- Historical Data and Forecast of Indonesia Electronic Components Market Revenues & Volume By Passive for the Period 2022-2032F
- Historical Data and Forecast of Indonesia Electronic Components Market Revenues & Volume By Active for the Period 2022-2032F
- Historical Data and Forecast of Indonesia Electronic Components Market Revenues & Volume By Electro Mechanic for the Period 2022-2032F
- Historical Data and Forecast of Indonesia Electronic Components Market Revenues & Volume By Applications for the Period 2022-2032F
- Historical Data and Forecast of Indonesia Electronic Components Market Revenues & Volume By Automotive for the Period 2022-2032F
- Historical Data and Forecast of Indonesia Electronic Components Market Revenues & Volume By Communications for the Period 2022-2032F
- Historical Data and Forecast of Indonesia Electronic Components Market Revenues & Volume By Industrial for the Period 2022-2032F
- Historical Data and Forecast of Indonesia Electronic Components Market Revenues & Volume By Computing Applications for the Period 2022-2032F
- Historical Data and Forecast of Indonesia Electronic Components Market Revenues & Volume By Others for the Period 2022-2032F
- Indonesia Electronic Components Import Export Trade Statistics
- Market Opportunity Assessment By Types
- Market Opportunity Assessment By Applications
- Indonesia Electronic Components Top Companies Market Share
- Indonesia Electronic Components Competitive Benchmarking By Technical and Operational Parameters
- Indonesia Electronic Components Company Profiles
- Indonesia Electronic Components Key Strategic Recommendations
Frequently Asked Questions About the Market Study (FAQs):
The market growth is largely driven by the increasing demand from the automotive sector and consumer electronics market, supported by rising disposable income and a young population.
Challenges include import tariffs that complicate foreign entries, currency fluctuations affecting pricing, and infrastructure deficiencies impacting supply chains.
The government is implementing tax incentives, investing in infrastructure, promoting R&D, and facilitating public-private partnerships to enhance local manufacturing capabilities.
Recent developments include increased collaborations with international firms, a focus on sustainable product development, and ongoing governmental investment in infrastructure improvements.
6Wresearch actively monitors the Indonesia Electronic Components Market and publishes its comprehensive annual report, highlighting emerging trends, growth drivers, revenue analysis, and forecast outlook. Our insights help businesses to make data-backed strategic decisions with ongoing market dynamics. Our analysts track relevent industries related to the Indonesia Electronic Components Market, allowing our clients with actionable intelligence and reliable forecasts tailored to emerging regional needs.
Yes, we provide customisation as per your requirements. To learn more, feel free to contact us on sales@6wresearch.com
1 Executive Summary |
2 Introduction |
2.1 Key Highlights of the Report |
2.2 Report Description |
2.3 Market Scope & Segmentation |
2.4 Research Methodology |
2.5 Assumptions |
3 Indonesia Electronic Components Market Overview |
3.1 Indonesia Country Macro Economic Indicators |
3.2 Indonesia Electronic Components Market Revenues & Volume, 2022 & 2032F |
3.3 Indonesia Electronic Components Market - Industry Life Cycle |
3.4 Indonesia Electronic Components Market - Porter's Five Forces |
3.5 Indonesia Electronic Components Market Revenues & Volume Share, By Types, 2022 & 2032F |
3.6 Indonesia Electronic Components Market Revenues & Volume Share, By Applications, 2022 & 2032F |
4 Indonesia Electronic Components Market Dynamics |
4.1 Impact Analysis |
4.2 Market Drivers |
4.3 Market Restraints |
5 Indonesia Electronic Components Market Trends |
6 Indonesia Electronic Components Market, By Types |
6.1 Indonesia Electronic Components Market, By Types |
6.1.1 Overview and Analysis |
6.1.2 Indonesia Electronic Components Market Revenues & Volume, By Types, 2022-2032F |
6.1.3 Indonesia Electronic Components Market Revenues & Volume, By Passive , 2022-2032F |
6.1.4 Indonesia Electronic Components Market Revenues & Volume, By Active, 2022-2032F |
6.1.5 Indonesia Electronic Components Market Revenues & Volume, By Electro Mechanic, 2022-2032F |
6.2 Indonesia Electronic Components Market, By Applications |
6.2.1 Overview and Analysis |
6.2.2 Indonesia Electronic Components Market Revenues & Volume, By Automotive, 2022-2032F |
6.2.3 Indonesia Electronic Components Market Revenues & Volume, By Communications, 2022-2032F |
6.2.4 Indonesia Electronic Components Market Revenues & Volume, By Industrial, 2022-2032F |
6.2.5 Indonesia Electronic Components Market Revenues & Volume, By Computing Applications, 2022-2032F |
6.2.6 Indonesia Electronic Components Market Revenues & Volume, By Others, 2022-2032F |
7 Indonesia Electronic Components Market Import-Export Trade Statistics |
7.1 Indonesia Electronic Components Market Export to Major Countries |
7.2 Indonesia Electronic Components Market Imports from Major Countries |
8 Indonesia Electronic Components Market Key Performance Indicators |
9 Indonesia Electronic Components Market - Opportunity Assessment |
9.1 Indonesia Electronic Components Market Opportunity Assessment, By Types, 2022 & 2032F |
9.2 Indonesia Electronic Components Market Opportunity Assessment, By Applications, 2022 & 2032F |
10 Indonesia Electronic Components Market - Competitive Landscape |
10.1 Indonesia Electronic Components Market Revenue Share, By Companies, 2025 |
10.2 Indonesia Electronic Components Market Competitive Benchmarking, By Operating and Technical Parameters |
11 Company Profiles |
12 Recommendations |
13 Disclaimer |
Global Go To Market Strategy - 2030
Export potential enables firms to identify high-growth global markets with greater confidence by combining advanced trade intelligence with a structured quantitative methodology. The framework analyzes emerging demand trends and country-level import patterns while integrating macroeconomic and trade datasets such as GDP and population forecasts, bilateral import–export flows, tariff structures, elasticity differentials between developed and developing economies, geographic distance, and import demand projections. Using weighted trade values from 2020–2024 as the base period to project country-to-country export potential for 2030, these inputs are operationalized through calculated drivers such as gravity model parameters, tariff impact factors, and projected GDP per-capita growth. Through an analysis of hidden potentials, demand hotspots, and market conditions that are most favorable to success, this method enables firms to focus on target countries, maximize returns, and global expansion with data, backed by accuracy.
By factoring in the projected importer demand gap that is currently unmet and could be potential opportunity, it identifies the potential for the Exporter (Country) among 190 countries, against the general trade analysis, which identifies the biggest importer or exporter.
To discover high-growth global markets and optimize your business strategy:
Click Here
Pricing
- Single User License$ 1,995
- Department License$ 2,400
- Site License$ 3,120
- Global License$ 3,795

Leadership Perspectives from Industry Events
Search
Thought Leadership and Analyst Meet


Our Clients
6WResearch In News
- India Air Conditioner Market Set for Strong Rebound in 2026 After Weather-Led Correction and GST-Driven Recovery: 6Wresearch
- ADAS in India: How Automatic Emergency Braking, Blind Spot Detection & Driver Monitoring are Transforming Road Safety
- Doha a strategic location for EV manufacturing hub: IPA Qatar
- Demand for luxury TVs surging in the GCC, says Samsung
- Empowering Growth: The Thriving Journey of Bangladesh’s Cable Industry
- Demand for luxury TVs surging in the GCC, says Samsung
Latest Reports
- Poland Fire Protection Systems Market (2026-2032)
- Cape Verde Portable Hand-Thrown Extinguisher Market (2026-2032)
- Canada Portable Hand-Thrown Extinguisher Market (2026-2032)
- Cameroon Portable Hand-Thrown Extinguisher Market (2026-2032)
- Burundi Portable Hand-Thrown Extinguisher Market (2026-2032)
- Burkina Faso Portable Hand-Thrown Extinguisher Market (2026-2032)
- Bulgaria Portable Hand-Thrown Extinguisher Market (2026-2032)
- Brunei Portable Hand-Thrown Extinguisher Market (2026-2032)
- Botswana Portable Hand-Thrown Extinguisher Market (2026-2032)
- Bosnia and Herzegovina Portable Hand-Thrown Extinguisher Market (2026-2032)
Industry Events and Analyst Meet

HIMTEX 2026

India Refining Summit 2026

India EV Show 2026

EV tech India Expo 2026

Auto Tech Asia 2026
Whitepaper
- Middle East & Africa Commercial Security Market Click here to view more.
- Middle East & Africa Fire Safety Systems & Equipment Market Click here to view more.
- GCC Drone Market Click here to view more.
- Middle East Lighting Fixture Market Click here to view more.
- GCC Physical & Perimeter Security Market Click here to view more.