Indonesia Fish Processing Market (2026-2032) | Share, Value, Industry, Growth, Companies, Forecast, Analysis, Trends, Outlook, Revenue & Size
Market Forecast By Source (Marine, Inland, Freshwater), By Application (Food, Feed, Biomedical, Others), By Processing (Frozen, Preserved, Others), By Equipment (Gutting, Scaling, Filleting, Deboning, Skinning, Curing & Smoking, Others) And Competitive Landscape
| Product Code: ETC042608 | Publication Date: Jul 2023 | Updated Date: Jun 2026 | Product Type: Report | |
| Publisher: 6Wresearch | Author: Ravi Bhandari | No. of Pages: 70 | No. of Figures: 35 | No. of Tables: 5 |
Indonesia Fish Processing Market Summary
The indonesia fish processing market was estimated at USD 199 Million in 2025 and is projected to reach USD 264 Million by 2032, growing at a CAGR of 5.6% from 2026 to 2032.
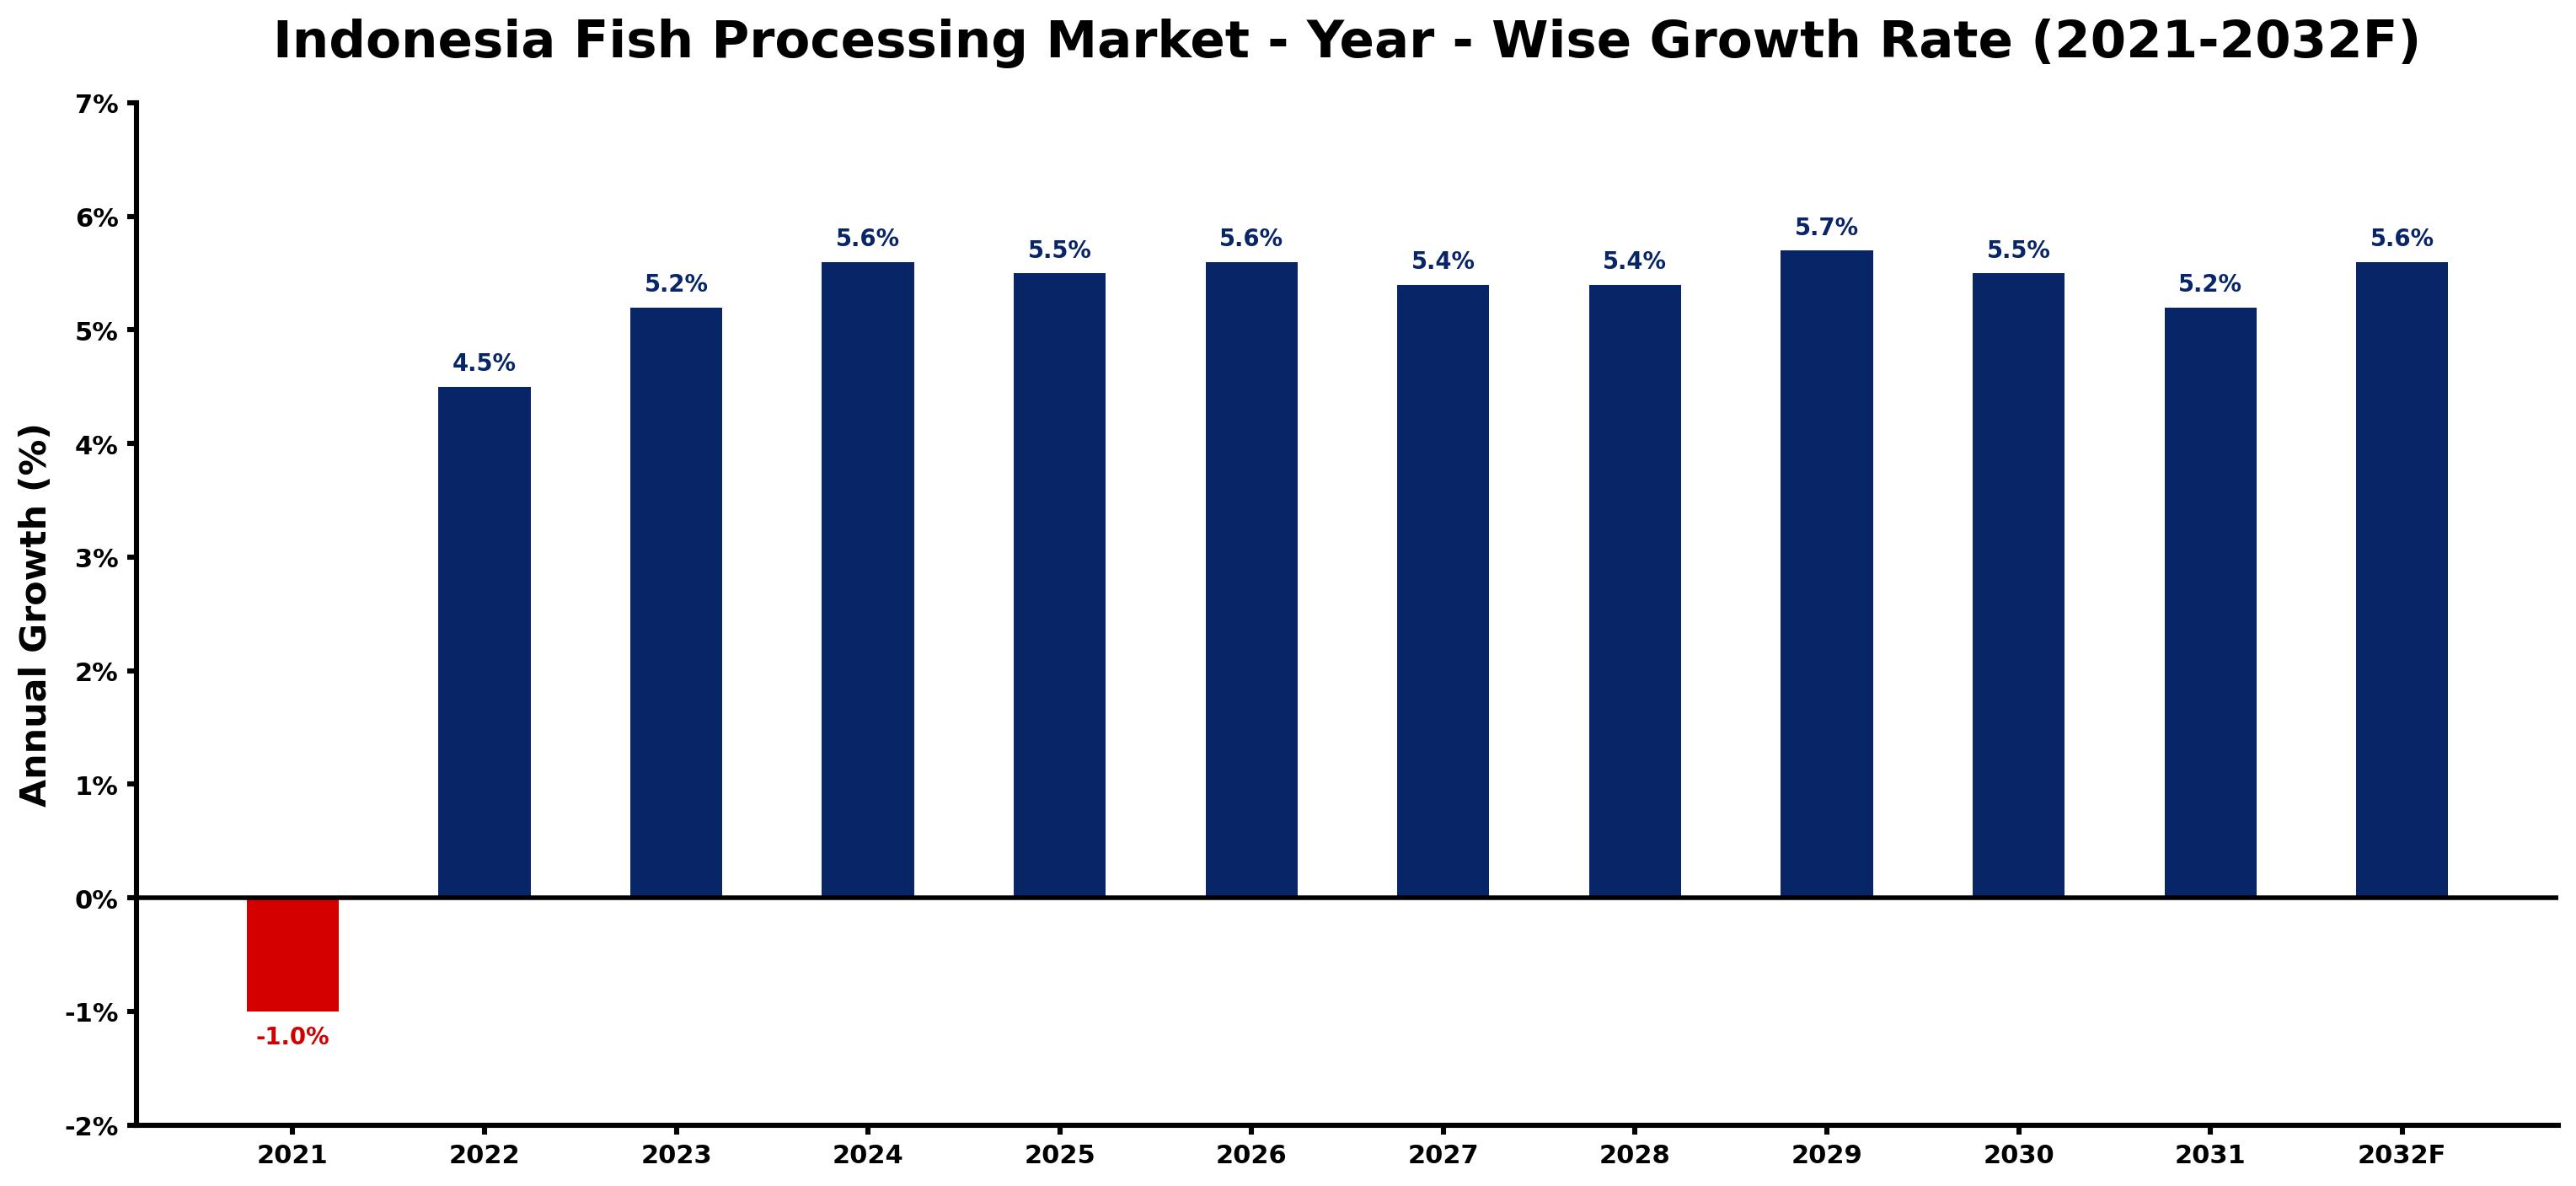
Indonesia Fish Processing Market Growth Rate Analysis (2021-2032)
The Indonesian fish processing market experienced a decline of 1.0% in 2021, primarily due to supply chain disruptions and rising operational costs amid the pandemic. However, a marked recovery began in 2022, with growth rebounding to 4.5%. This positive trend has continued, with projections suggesting expansion rates of 5.2% in 2023 and further accelerating to 5.6% in both 2024 and 2026. Key drivers include increasing consumer demand for processed fish products, heightened investments in modern processing technologies, and supportive government policies aimed at boosting the fisheries sector. By 2032, the market is expected to maintain a robust growth rate of 5.6%, reflecting ongoing advancements and a strengthening export market.
Indonesia Fish Processing Market Year-wise Growth Rate and Key Drivers
This graph highlights how the Indonesia Fish Processing Market has steadily grown over the past five years, supported by major growth factors.
The table below presents the year wise growth rates along with the key drivers influencing the market
| Year | Growth Rate | Major Drivers |
| 2021 | -1.0% | Severe overfishing and unsustainable practices led to diminished fish stocks, impacting processing capabilities and market stability. |
| 2022 | 4.5% | Consumer preferences shift towards sustainable seafood options, enhancing market appeal significantly. |
| 2023 | 5.2% | Technological innovations improve processing efficiency, reducing operational costs considerably. |
| 2024 | 5.6% | Export opportunities expand as international markets seek premium Indonesian seafood products. |
| 2025 | 5.5% | Investment in cold chain logistics enhances product quality and reduces spoilage rates. |
| 2026 | 5.6% | Rural awareness programs encourage fish farming, creating a diverse supply base. |
| 2027 | 5.4% | Partnerships with global brands introduce quality standards and best practices in processing. |
| 2028 | 5.4% | Rising urbanization drives increased demand for convenient, ready-to-eat seafood products. |
| 2029 | 5.7% | Increased collaboration between government and private sectors boosts industry infrastructure development. |
| 2030 | 5.5% | Improved training programs elevate workforce skills, enhancing processing capabilities and efficiency. |
| 2031 | 5.2% | Growing interest in aquaculture supports sustainable practices within the fish processing sector. |
| 2032 | 5.6% | Economic stability fosters consumer spending, further propelling seafood market growth. |
Note - Market size estimations and growth projections presented in this report are based on 6Wresearch's advanced forecasting approach, validated with industry datasets as of June 2026.
Indonesia Fish Processing Market Synopsis
The Indonesia Fish Processing Market is projected to reach 5.6% and witness significant growth during the forecast period (2026-2032). This growth can be primarily attributed to a steadily increasing demand for seafood products driven by their recognized health benefits. The rise in disposable income among consumers, coupled with heightened awareness regarding the nutritional advantages of seafood, has been pivotal in fostering this trend. Furthermore, favorable government initiatives, such as the “Promoting Fishery Products†program launched by the Ministry of Marine Affairs and Fisheries, are crucial drivers of market expansion.
Indonesia Fish Processing Market Growth Drivers
The growth trajectory of the Indonesia Fish Processing Market is influenced by several key drivers:
- The increasing preference for seafood among consumers is largely due to its rich nutrient profile, which includes essential vitamins and minerals. Seafood is known for its heart health benefits, particularly in lowering cholesterol levels and providing Omega-3 fatty acids, making it a preferred food choice.
- With a rise in per capita income, consumers are spending more on high-quality food items, including processed fish products. This shift is a significant factor contributing to market growth.
- Government initiatives aimed at enhancing fisheries infrastructure and modernizing fishing equipment are empowering local fishing communities, thereby improving domestic fish production and consumer preference for local products over imports.
- The increasing health consciousness among consumers is steering them towards healthier dietary choices, which further boosts demand for fish-based products.
- Technological advancements in processing methods are enhancing the quality and shelf-life of fish products, making them more appealing to a broader audience.
Indonesia Fish Processing Market Challenges and Restraints
Despite the promising growth outlook, the Indonesia Fish Processing Market faces several challenges that must be addressed:
- The capital-intensive nature of establishing fish processing facilities poses a barrier for small-scale operators. The financial burden of acquiring advanced machinery and technology can deter new entrants and limit competition.
- Inconsistent supply due to overfishing and environmental changes can negatively impact fish availability and processing operations.
- Regulatory compliance, particularly concerning food safety and environmental protection, can be complex and costly, especially for smaller businesses with limited resources.
- Market volatility in global fish prices can impact local processing margins, making it challenging for processors to maintain profitability.
- Consumer preferences are constantly evolving, necessitating agile business strategies to adapt to changing tastes and trends, which can strain manufacturing capabilities.
Indonesia Fish Processing Market Government Investment and Initiatives
The Indonesian government is taking proactive steps to bolster the fish processing sector through various investments and initiatives:
- The “Promoting Fishery Products†program aims to enhance the overall efficiency and productivity of the fisheries sector by investing in infrastructure and technology.
- Public spending on research and development is increasing, which focuses on sustainable fishing practices and innovative processing techniques that can benefit local communities.
- Support for small-scale fishers is being prioritized through financial incentives and training programs, which encourage best practices in fish processing and sustainability.
- The government's focus on improving export capabilities through quality control measures is also intended to expand market access for Indonesian fish products.
- Partnerships with private sector players are being fostered to modernize the fishing fleet, ensuring that local fishers are equipped with the tools necessary for efficient production.
Indonesia Fish Processing Market Latest Developments (May 2025 - June 2026)
In the recent months leading up to mid-2026, the Indonesia Fish Processing Market has seen several noteworthy developments:
- Innovations in processing technology continue to emerge, with local firms investing in machinery that enhances product quality and minimizes waste.
- Increased collaboration between government bodies and the private sector is evident, particularly in research initiatives aimed at improving fish health and sustainability.
- Market players are expanding their product lines to include value-added processed fish products, catering to the growing health-oriented consumers.
- The implementation of stricter regulation on food safety in the processing sector is enhancing product quality and consumer confidence.
- Sustainability initiatives are gaining momentum, with companies focusing on environmentally friendly practices in both production and packaging.
Indonesia Fish Processing Market - Key Attractiveness of the Report
- 10 Years of Market Numbers
- Historical Data Starting from 2022 to 2025
- Base Year: 2025
- Forecast Data until 2032
- Key Performance Indicators Impacting the Market
- Major Upcoming Developments and Projects
Key Highlights of the Report:
- Indonesia Fish Processing Market Outlook
- Market Size of Indonesia Fish Processing Market, 2025
- Forecast of Indonesia Fish Processing Market, 2032F
- Historical Data and Forecast of Indonesia Fish Processing Revenues & Volume for the Period 2022-2032F
- Indonesia Fish Processing Market Trend Evolution
- Indonesia Fish Processing Market Drivers and Challenges
- Indonesia Fish Processing Price Trends
- Indonesia Fish Processing Porter's Five Forces
- Indonesia Fish Processing Industry Life Cycle
- Historical Data and Forecast of Indonesia Fish Processing Market Revenues & Volume By Source for the Period 2022-2032F
- Historical Data and Forecast of Indonesia Fish Processing Market Revenues & Volume By Marine for the Period 2022-2032F
- Historical Data and Forecast of Indonesia Fish Processing Market Revenues & Volume By Inland for the Period 2022-2032F
- Historical Data and Forecast of Indonesia Fish Processing Market Revenues & Volume By Freshwater for the Period 2022-2032F
- Historical Data and Forecast of Indonesia Fish Processing Market Revenues & Volume By Application for the Period 2022-2032F
- Historical Data and Forecast of Indonesia Fish Processing Market Revenues & Volume By Food for the Period 2022-2032F
- Historical Data and Forecast of Indonesia Fish Processing Market Revenues & Volume By Feed for the Period 2022-2032F
- Historical Data and Forecast of Indonesia Fish Processing Market Revenues & Volume By Biomedical for the Period 2022-2032F
- Historical Data and Forecast of Indonesia Fish Processing Market Revenues & Volume By Others for the Period 2022-2032F
- Historical Data and Forecast of Indonesia Fish Processing Market Revenues & Volume By Processing for the Period 2022-2032F
- Historical Data and Forecast of Indonesia Fish Processing Market Revenues & Volume By Frozen for the Period 2022-2032F
- Historical Data and Forecast of Indonesia Fish Processing Market Revenues & Volume By Preserved for the Period 2022-2032F
- Historical Data and Forecast of Indonesia Fish Processing Market Revenues & Volume By Others for the Period 2022-2032F
- Historical Data and Forecast of Indonesia Fish Processing Market Revenues & Volume By Equipment for the Period 2022-2032F
- Historical Data and Forecast of Indonesia Fish Processing Market Revenues & Volume By Gutting for the Period 2022-2032F
- Historical Data and Forecast of Indonesia Fish Processing Market Revenues & Volume By Scaling for the Period 2022-2032F
- Historical Data and Forecast of Indonesia Fish Processing Market Revenues & Volume By Filleting for the Period 2022-2032F
- Historical Data and Forecast of Indonesia Fish Processing Market Revenues & Volume By Deboning for the Period 2022-2032F
- Historical Data and Forecast of Indonesia Fish Processing Market Revenues & Volume By Skinning for the Period 2022-2032F
- Historical Data and Forecast of Indonesia Fish Processing Market Revenues & Volume By Curing & Smoking for the Period 2022-2032F
- Historical Data and Forecast of Indonesia Fish Processing Market Revenues & Volume By Others for the Period 2022-2032F
- Indonesia Fish Processing Import Export Trade Statistics
- Market Opportunity Assessment By Source
- Market Opportunity Assessment By Application
- Market Opportunity Assessment By Processing
- Market Opportunity Assessment By Equipment
- Indonesia Fish Processing Top Companies Market Share
- Indonesia Fish Processing Competitive Benchmarking By Technical and Operational Parameters
- Indonesia Fish Processing Company Profiles
- Indonesia Fish Processing Key Strategic Recommendations
Frequently Asked Questions About the Market Study (FAQs):
The growth is driven by rising health awareness, increases in disposable income, and government initiatives promoting local fish products.
Key challenges include high capital requirements for processing facilities, regulatory compliance complexities, and market volatility regarding fish prices.
The government is actively investing in infrastructure, promoting sustainable practices, and encouraging the modernization of fish processing technologies.
There is a notable shift towards healthier, processed fish products as consumers become increasingly health-conscious, prompting processors to adapt their offerings accordingly.
6Wresearch actively monitors the Indonesia Fish Processing Market and publishes its comprehensive annual report, highlighting emerging trends, growth drivers, revenue analysis, and forecast outlook. Our insights help businesses to make data-backed strategic decisions with ongoing market dynamics. Our analysts track relevent industries related to the Indonesia Fish Processing Market, allowing our clients with actionable intelligence and reliable forecasts tailored to emerging regional needs.
Yes, we provide customisation as per your requirements. To learn more, feel free to contact us on sales@6wresearch.com
1 Executive Summary |
2 Introduction |
2.1 Key Highlights of the Report |
2.2 Report Description |
2.3 Market Scope & Segmentation |
2.4 Research Methodology |
2.5 Assumptions |
3 Indonesia Fish Processing Market Overview |
3.1 Indonesia Country Macro Economic Indicators |
3.2 Indonesia Fish Processing Market Revenues & Volume, 2022 & 2032F |
3.3 Indonesia Fish Processing Market - Industry Life Cycle |
3.4 Indonesia Fish Processing Market - Porter's Five Forces |
3.5 Indonesia Fish Processing Market Revenues & Volume Share, By Source, 2022 & 2032F |
3.6 Indonesia Fish Processing Market Revenues & Volume Share, By Application, 2022 & 2032F |
3.7 Indonesia Fish Processing Market Revenues & Volume Share, By Processing, 2022 & 2032F |
3.8 Indonesia Fish Processing Market Revenues & Volume Share, By Equipment, 2022 & 2032F |
4 Indonesia Fish Processing Market Dynamics |
4.1 Impact Analysis |
4.2 Market Drivers |
4.3 Market Restraints |
5 Indonesia Fish Processing Market Trends |
6 Indonesia Fish Processing Market, By Types |
6.1 Indonesia Fish Processing Market, By Source |
6.1.1 Overview and Analysis |
6.1.2 Indonesia Fish Processing Market Revenues & Volume, By Source, 2022-2032F |
6.1.3 Indonesia Fish Processing Market Revenues & Volume, By Marine, 2022-2032F |
6.1.4 Indonesia Fish Processing Market Revenues & Volume, By Inland, 2022-2032F |
6.1.5 Indonesia Fish Processing Market Revenues & Volume, By Freshwater, 2022-2032F |
6.2 Indonesia Fish Processing Market, By Application |
6.2.1 Overview and Analysis |
6.2.2 Indonesia Fish Processing Market Revenues & Volume, By Food, 2022-2032F |
6.2.3 Indonesia Fish Processing Market Revenues & Volume, By Feed, 2022-2032F |
6.2.4 Indonesia Fish Processing Market Revenues & Volume, By Biomedical, 2022-2032F |
6.2.5 Indonesia Fish Processing Market Revenues & Volume, By Others, 2022-2032F |
6.3 Indonesia Fish Processing Market, By Processing |
6.3.1 Overview and Analysis |
6.3.2 Indonesia Fish Processing Market Revenues & Volume, By Frozen, 2022-2032F |
6.3.3 Indonesia Fish Processing Market Revenues & Volume, By Preserved, 2022-2032F |
6.3.4 Indonesia Fish Processing Market Revenues & Volume, By Others, 2022-2032F |
6.4 Indonesia Fish Processing Market, By Equipment |
6.4.1 Overview and Analysis |
6.4.2 Indonesia Fish Processing Market Revenues & Volume, By Gutting, 2022-2032F |
6.4.3 Indonesia Fish Processing Market Revenues & Volume, By Scaling, 2022-2032F |
6.4.4 Indonesia Fish Processing Market Revenues & Volume, By Filleting, 2022-2032F |
6.4.5 Indonesia Fish Processing Market Revenues & Volume, By Deboning, 2022-2032F |
6.4.6 Indonesia Fish Processing Market Revenues & Volume, By Skinning, 2022-2032F |
6.4.7 Indonesia Fish Processing Market Revenues & Volume, By Curing & Smoking, 2022-2032F |
7 Indonesia Fish Processing Market Import-Export Trade Statistics |
7.1 Indonesia Fish Processing Market Export to Major Countries |
7.2 Indonesia Fish Processing Market Imports from Major Countries |
8 Indonesia Fish Processing Market Key Performance Indicators |
9 Indonesia Fish Processing Market - Opportunity Assessment |
9.1 Indonesia Fish Processing Market Opportunity Assessment, By Source, 2022 & 2032F |
9.2 Indonesia Fish Processing Market Opportunity Assessment, By Application, 2022 & 2032F |
9.3 Indonesia Fish Processing Market Opportunity Assessment, By Processing, 2022 & 2032F |
9.4 Indonesia Fish Processing Market Opportunity Assessment, By Equipment, 2022 & 2032F |
10 Indonesia Fish Processing Market - Competitive Landscape |
10.1 Indonesia Fish Processing Market Revenue Share, By Companies, 2025 |
10.2 Indonesia Fish Processing Market Competitive Benchmarking, By Operating and Technical Parameters |
11 Company Profiles |
12 Recommendations |
13 Disclaimer |
Global Go To Market Strategy - 2030
Export potential enables firms to identify high-growth global markets with greater confidence by combining advanced trade intelligence with a structured quantitative methodology. The framework analyzes emerging demand trends and country-level import patterns while integrating macroeconomic and trade datasets such as GDP and population forecasts, bilateral import–export flows, tariff structures, elasticity differentials between developed and developing economies, geographic distance, and import demand projections. Using weighted trade values from 2020–2024 as the base period to project country-to-country export potential for 2030, these inputs are operationalized through calculated drivers such as gravity model parameters, tariff impact factors, and projected GDP per-capita growth. Through an analysis of hidden potentials, demand hotspots, and market conditions that are most favorable to success, this method enables firms to focus on target countries, maximize returns, and global expansion with data, backed by accuracy.
By factoring in the projected importer demand gap that is currently unmet and could be potential opportunity, it identifies the potential for the Exporter (Country) among 190 countries, against the general trade analysis, which identifies the biggest importer or exporter.
To discover high-growth global markets and optimize your business strategy:
Click Here
Pricing
- Single User License$ 1,995
- Department License$ 2,400
- Site License$ 3,120
- Global License$ 3,795

Leadership Perspectives from Industry Events
Search
Thought Leadership and Analyst Meet


Our Clients
6WResearch In News
- India Air Conditioner Market Set for Strong Rebound in 2026 After Weather-Led Correction and GST-Driven Recovery: 6Wresearch
- ADAS in India: How Automatic Emergency Braking, Blind Spot Detection & Driver Monitoring are Transforming Road Safety
- Doha a strategic location for EV manufacturing hub: IPA Qatar
- Demand for luxury TVs surging in the GCC, says Samsung
- Empowering Growth: The Thriving Journey of Bangladesh’s Cable Industry
- Demand for luxury TVs surging in the GCC, says Samsung
Latest Reports
- Poland Fire Protection Systems Market (2026-2032)
- Cape Verde Portable Hand-Thrown Extinguisher Market (2026-2032)
- Canada Portable Hand-Thrown Extinguisher Market (2026-2032)
- Cameroon Portable Hand-Thrown Extinguisher Market (2026-2032)
- Burundi Portable Hand-Thrown Extinguisher Market (2026-2032)
- Burkina Faso Portable Hand-Thrown Extinguisher Market (2026-2032)
- Bulgaria Portable Hand-Thrown Extinguisher Market (2026-2032)
- Brunei Portable Hand-Thrown Extinguisher Market (2026-2032)
- Botswana Portable Hand-Thrown Extinguisher Market (2026-2032)
- Bosnia and Herzegovina Portable Hand-Thrown Extinguisher Market (2026-2032)
Industry Events and Analyst Meet

HIMTEX 2026

India Refining Summit 2026

India EV Show 2026

EV tech India Expo 2026

Auto Tech Asia 2026
Whitepaper
- Middle East & Africa Commercial Security Market Click here to view more.
- Middle East & Africa Fire Safety Systems & Equipment Market Click here to view more.
- GCC Drone Market Click here to view more.
- Middle East Lighting Fixture Market Click here to view more.
- GCC Physical & Perimeter Security Market Click here to view more.