Ireland Collimating Lens Market (2026-2032) | Outlook, Growth, Forecast, Analysis, Companies, Share, Segmentation, Value, Revenue, Size, Trends & Industry
Market Forecast By Light Source (LED, Laser, Others), By Material (Glass , Plastic), By End Use (Automobile, Medical, LiDAR, Light , Display Measurement, spectrometer), By Wavelength (<1,000, 1,000‚œ1,500, 1,500‚œ2,000, >2,000) And Competitive Landscape
| Product Code: ETC5585230 | Publication Date: Nov 2023 | Updated Date: Mar 2026 | Product Type: Market Research Report | |
| Publisher: 6Wresearch | Author: Vasudha | No. of Pages: 60 | No. of Figures: 30 | No. of Tables: 5 |
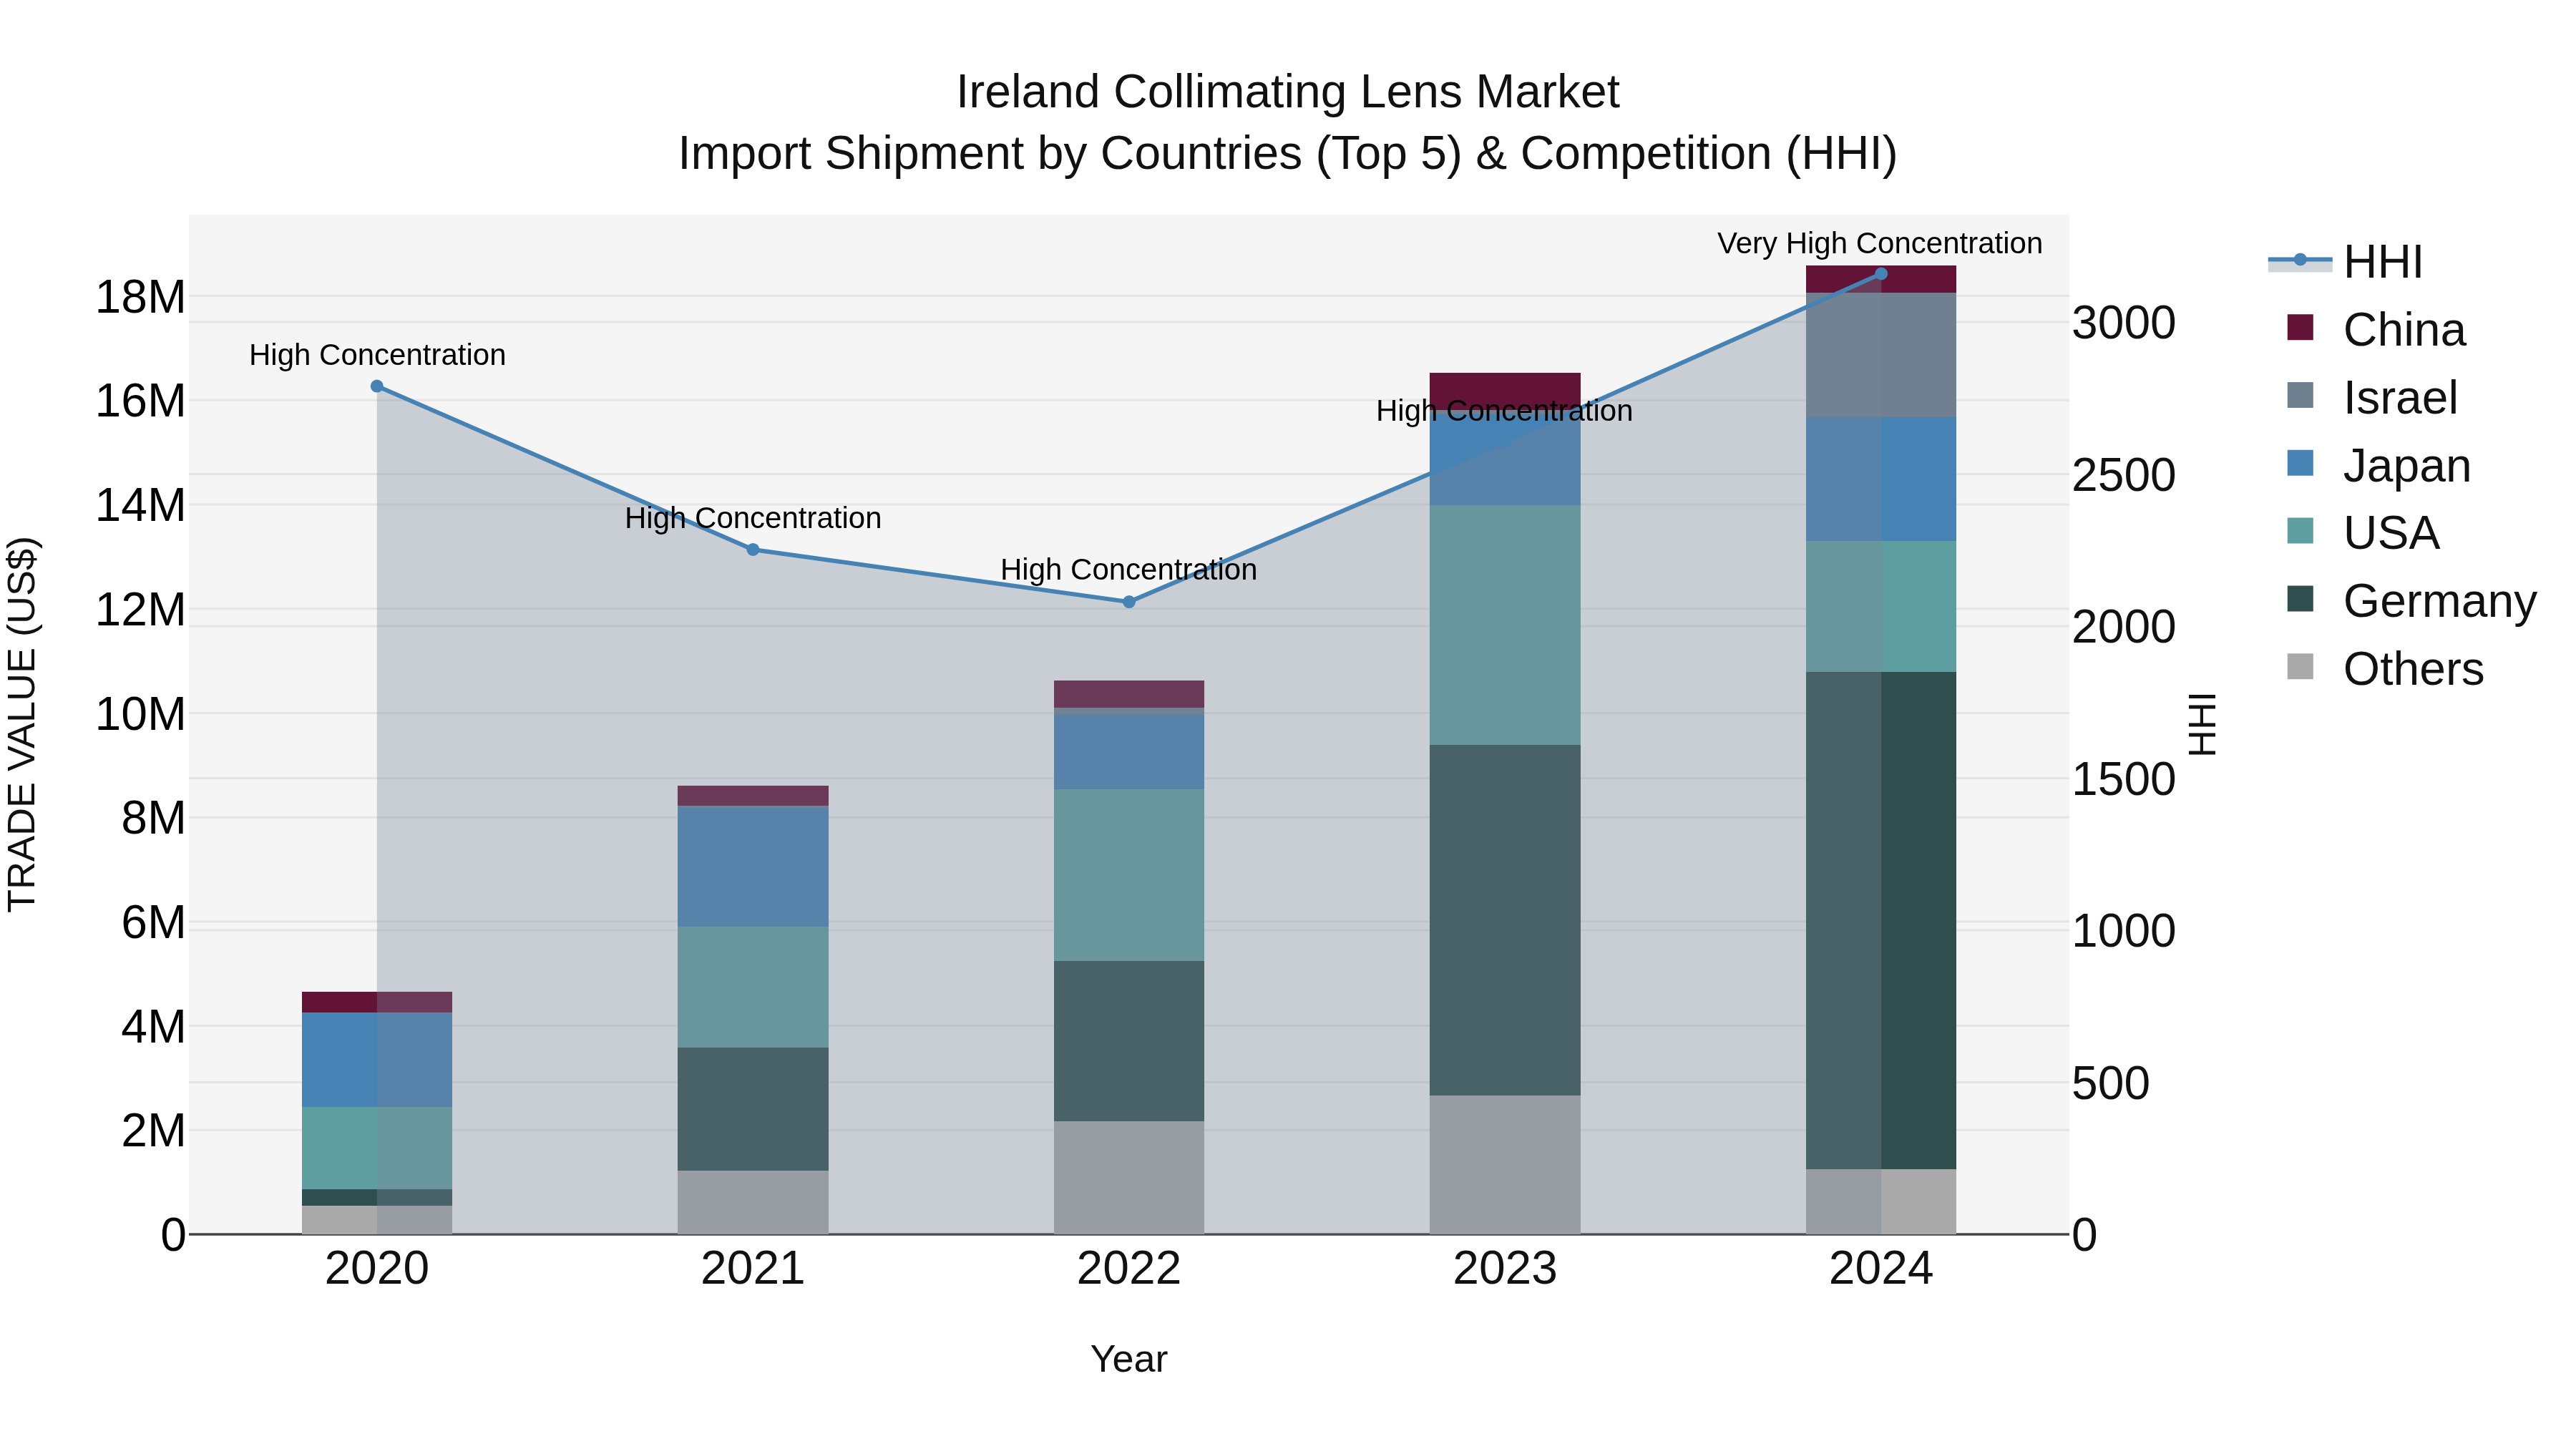
Ireland Collimating Lens Market Top 5 Importing Countries and Market Competition (HHI) Analysis
The market for collimating lens imports in Ireland continues to show strong growth, with a significant increase in concentration among the top exporting countries in 2024. Germany, USA, Israel, Japan, and China are the key players fueling this growth. The high Herfindahl-Hirschman Index (HHI) indicates a competitive market landscape, while the impressive Compound Annual Growth Rate (CAGR) of 41.37% from 2020 to 2024 reflects a robust industry expansion. Moreover, the growth rate of 12.43% from 2023 to 2024 highlights the accelerating pace of market development in this sector.
Key Highlights of the Report:
- Ireland Collimating Lens Market Outlook
- Market Size of Ireland Collimating Lens Market, 2025
- Forecast of Ireland Collimating Lens Market, 2032
- Historical Data and Forecast of Ireland Collimating Lens Revenues & Volume for the Period 2022 - 2032F
- Ireland Collimating Lens Market Trend Evolution
- Ireland Collimating Lens Market Drivers and Challenges
- Ireland Collimating Lens Price Trends
- Ireland Collimating Lens Porter`s Five Forces
- Ireland Collimating Lens Industry Life Cycle
- Historical Data and Forecast of Ireland Collimating Lens Market Revenues & Volume By Light Source for the Period 2022 - 2032F
- Historical Data and Forecast of Ireland Collimating Lens Market Revenues & Volume By LED for the Period 2022 - 2032F
- Historical Data and Forecast of Ireland Collimating Lens Market Revenues & Volume By Laser for the Period 2022 - 2032F
- Historical Data and Forecast of Ireland Collimating Lens Market Revenues & Volume By Others for the Period 2022 - 2032F
- Historical Data and Forecast of Ireland Collimating Lens Market Revenues & Volume By Material for the Period 2022 - 2032F
- Historical Data and Forecast of Ireland Collimating Lens Market Revenues & Volume By Glass for the Period 2022 - 2032F
- Historical Data and Forecast of Ireland Collimating Lens Market Revenues & Volume By Plastic for the Period 2022 - 2032F
- Historical Data and Forecast of Ireland Collimating Lens Market Revenues & Volume By End Use for the Period 2022 - 2032F
- Historical Data and Forecast of Ireland Collimating Lens Market Revenues & Volume By Automobile for the Period 2022 - 2032F
- Historical Data and Forecast of Ireland Collimating Lens Market Revenues & Volume By Medical for the Period 2022 - 2032F
- Historical Data and Forecast of Ireland Collimating Lens Market Revenues & Volume By LiDAR for the Period 2022 - 2032F
- Historical Data and Forecast of Ireland Collimating Lens Market Revenues & Volume By Light for the Period 2022 - 2032F
- Historical Data and Forecast of Ireland Collimating Lens Market Revenues & Volume By Display Measurement for the Period 2022 - 2032F
- Historical Data and Forecast of Ireland Collimating Lens Market Revenues & Volume By spectrometer for the Period 2022 - 2032F
- Historical Data and Forecast of Ireland Collimating Lens Market Revenues & Volume By Wavelength for the Period 2022 - 2032F
- Historical Data and Forecast of Ireland Collimating Lens Market Revenues & Volume By <1,000 for the Period 2022 - 2032F
- Historical Data and Forecast of Ireland Collimating Lens Market Revenues & Volume By 1,000???1,500 for the Period 2022 - 2032F
- Historical Data and Forecast of Ireland Collimating Lens Market Revenues & Volume By 1,500???2,000 for the Period 2022 - 2032F
- Historical Data and Forecast of Ireland Collimating Lens Market Revenues & Volume By >2,000 for the Period 2022 - 2032F
- Ireland Collimating Lens Import Export Trade Statistics
- Market Opportunity Assessment By Light Source
- Market Opportunity Assessment By Material
- Market Opportunity Assessment By End Use
- Market Opportunity Assessment By Wavelength
- Ireland Collimating Lens Top Companies Market Share
- Ireland Collimating Lens Competitive Benchmarking By Technical and Operational Parameters
- Ireland Collimating Lens Company Profiles
- Ireland Collimating Lens Key Strategic Recommendations
Frequently Asked Questions About the Market Study (FAQs):
6Wresearch actively monitors the Ireland Collimating Lens Market and publishes its comprehensive annual report, highlighting emerging trends, growth drivers, revenue analysis, and forecast outlook. Our insights help businesses to make data-backed strategic decisions with ongoing market dynamics. Our analysts track relevent industries related to the Ireland Collimating Lens Market, allowing our clients with actionable intelligence and reliable forecasts tailored to emerging regional needs.
Yes, we provide customisation as per your requirements. To learn more, feel free to contact us on sales@6wresearch.com
1 Executive Summary |
2 Introduction |
2.1 Key Highlights of the Report |
2.2 Report Description |
2.3 Market Scope & Segmentation |
2.4 Research Methodology |
2.5 Assumptions |
3 Ireland Collimating Lens Market Overview |
3.1 Ireland Country Macro Economic Indicators |
3.2 Ireland Collimating Lens Market Revenues & Volume, 2022 & 2032F |
3.3 Ireland Collimating Lens Market - Industry Life Cycle |
3.4 Ireland Collimating Lens Market - Porter's Five Forces |
3.5 Ireland Collimating Lens Market Revenues & Volume Share, By Light Source , 2022 & 2032F |
3.6 Ireland Collimating Lens Market Revenues & Volume Share, By Material , 2022 & 2032F |
3.7 Ireland Collimating Lens Market Revenues & Volume Share, By End Use , 2022 & 2032F |
3.8 Ireland Collimating Lens Market Revenues & Volume Share, By Wavelength, 2022 & 2032F |
4 Ireland Collimating Lens Market Dynamics |
4.1 Impact Analysis |
4.2 Market Drivers |
4.2.1 Increasing demand for advanced optical technologies in industries such as healthcare, aerospace, and defense. |
4.2.2 Growing adoption of collimating lenses in emerging applications like LiDAR systems, virtual reality (VR), and augmented reality (AR). |
4.2.3 Technological advancements leading to the development of high-quality and efficient collimating lenses. |
4.3 Market Restraints |
4.3.1 High initial investment required for the manufacturing of precision collimating lenses. |
4.3.2 Competition from substitute technologies impacting market penetration. |
4.3.3 Challenges in maintaining consistent quality and performance standards across different lens variants. |
5 Ireland Collimating Lens Market Trends |
6 Ireland Collimating Lens Market Segmentations |
6.1 Ireland Collimating Lens Market, By Light Source |
6.1.1 Overview and Analysis |
6.1.2 Ireland Collimating Lens Market Revenues & Volume, By LED, 2022 - 2032F |
6.1.3 Ireland Collimating Lens Market Revenues & Volume, By Laser, 2022 - 2032F |
6.1.4 Ireland Collimating Lens Market Revenues & Volume, By Others, 2022 - 2032F |
6.2 Ireland Collimating Lens Market, By Material |
6.2.1 Overview and Analysis |
6.2.2 Ireland Collimating Lens Market Revenues & Volume, By Glass , 2022 - 2032F |
6.2.3 Ireland Collimating Lens Market Revenues & Volume, By Plastic, 2022 - 2032F |
6.3 Ireland Collimating Lens Market, By End Use |
6.3.1 Overview and Analysis |
6.3.2 Ireland Collimating Lens Market Revenues & Volume, By Automobile, 2022 - 2032F |
6.3.3 Ireland Collimating Lens Market Revenues & Volume, By Medical, 2022 - 2032F |
6.3.4 Ireland Collimating Lens Market Revenues & Volume, By LiDAR, 2022 - 2032F |
6.3.5 Ireland Collimating Lens Market Revenues & Volume, By Light , 2022 - 2032F |
6.3.6 Ireland Collimating Lens Market Revenues & Volume, By Display Measurement, 2022 - 2032F |
6.3.7 Ireland Collimating Lens Market Revenues & Volume, By spectrometer, 2022 - 2032F |
6.4 Ireland Collimating Lens Market, By Wavelength |
6.4.1 Overview and Analysis |
6.4.2 Ireland Collimating Lens Market Revenues & Volume, By <1,000, 2022 - 2032F |
6.4.3 Ireland Collimating Lens Market Revenues & Volume, By 1,000? ??1,500, 2022 - 2032F |
6.4.4 Ireland Collimating Lens Market Revenues & Volume, By 1,500? ??2,000, 2022 - 2032F |
6.4.5 Ireland Collimating Lens Market Revenues & Volume, By >2,000, 2022 - 2032F |
7 Ireland Collimating Lens Market Import-Export Trade Statistics |
7.1 Ireland Collimating Lens Market Export to Major Countries |
7.2 Ireland Collimating Lens Market Imports from Major Countries |
8 Ireland Collimating Lens Market Key Performance Indicators |
8.1 Average lead time for delivering customized collimating lenses to customers. |
8.2 Percentage of repeat customers indicating product satisfaction and loyalty. |
8.3 Rate of adoption of collimating lenses in new applications or industries. |
8.4 Number of patents filed or granted for innovative collimating lens designs. |
8.5 Customer satisfaction scores based on feedback and reviews. |
9 Ireland Collimating Lens Market - Opportunity Assessment |
9.1 Ireland Collimating Lens Market Opportunity Assessment, By Light Source , 2022 & 2032F |
9.2 Ireland Collimating Lens Market Opportunity Assessment, By Material , 2022 & 2032F |
9.3 Ireland Collimating Lens Market Opportunity Assessment, By End Use , 2022 & 2032F |
9.4 Ireland Collimating Lens Market Opportunity Assessment, By Wavelength, 2022 & 2032F |
10 Ireland Collimating Lens Market - Competitive Landscape |
10.1 Ireland Collimating Lens Market Revenue Share, By Companies, 2025 |
10.2 Ireland Collimating Lens Market Competitive Benchmarking, By Operating and Technical Parameters |
11 Company Profiles |
12 Recommendations | 13 Disclaimer |
Global Go To Market Strategy - 2030
Export potential enables firms to identify high-growth global markets with greater confidence by combining advanced trade intelligence with a structured quantitative methodology. The framework analyzes emerging demand trends and country-level import patterns while integrating macroeconomic and trade datasets such as GDP and population forecasts, bilateral import–export flows, tariff structures, elasticity differentials between developed and developing economies, geographic distance, and import demand projections. Using weighted trade values from 2020–2024 as the base period to project country-to-country export potential for 2030, these inputs are operationalized through calculated drivers such as gravity model parameters, tariff impact factors, and projected GDP per-capita growth. Through an analysis of hidden potentials, demand hotspots, and market conditions that are most favorable to success, this method enables firms to focus on target countries, maximize returns, and global expansion with data, backed by accuracy.
By factoring in the projected importer demand gap that is currently unmet and could be potential opportunity, it identifies the potential for the Exporter (Country) among 190 countries, against the general trade analysis, which identifies the biggest importer or exporter.
To discover high-growth global markets and optimize your business strategy:
Click Here
Pricing
- Single User License$ 1,995
- Department License$ 2,400
- Site License$ 3,120
- Global License$ 3,795

Leadership Perspectives from Industry Events
Search
Thought Leadership and Analyst Meet


Our Clients
6WResearch In News
- Doha a strategic location for EV manufacturing hub: IPA Qatar
- Demand for luxury TVs surging in the GCC, says Samsung
- Empowering Growth: The Thriving Journey of Bangladesh’s Cable Industry
- Demand for luxury TVs surging in the GCC, says Samsung
- Video call with a traditional healer? Once unthinkable, it’s now common in South Africa
- Intelligent Buildings To Smooth GCC’s Path To Net Zero
Latest Reports
- Poland Fire Protection Systems Market (2026-2032)
- Cape Verde Portable Hand-Thrown Extinguisher Market (2026-2032)
- Canada Portable Hand-Thrown Extinguisher Market (2026-2032)
- Cameroon Portable Hand-Thrown Extinguisher Market (2026-2032)
- Burundi Portable Hand-Thrown Extinguisher Market (2026-2032)
- Burkina Faso Portable Hand-Thrown Extinguisher Market (2026-2032)
- Bulgaria Portable Hand-Thrown Extinguisher Market (2026-2032)
- Brunei Portable Hand-Thrown Extinguisher Market (2026-2032)
- Botswana Portable Hand-Thrown Extinguisher Market (2026-2032)
- Bosnia and Herzegovina Portable Hand-Thrown Extinguisher Market (2026-2032)
Industry Events and Analyst Meet

HIMTEX 2026

India Refining Summit 2026

India EV Show 2026

EV tech India Expo 2026

Auto Tech Asia 2026
Whitepaper
- Middle East & Africa Commercial Security Market Click here to view more.
- Middle East & Africa Fire Safety Systems & Equipment Market Click here to view more.
- GCC Drone Market Click here to view more.
- Middle East Lighting Fixture Market Click here to view more.
- GCC Physical & Perimeter Security Market Click here to view more.