Japan 3D Visualization Market Size & Growth Rate
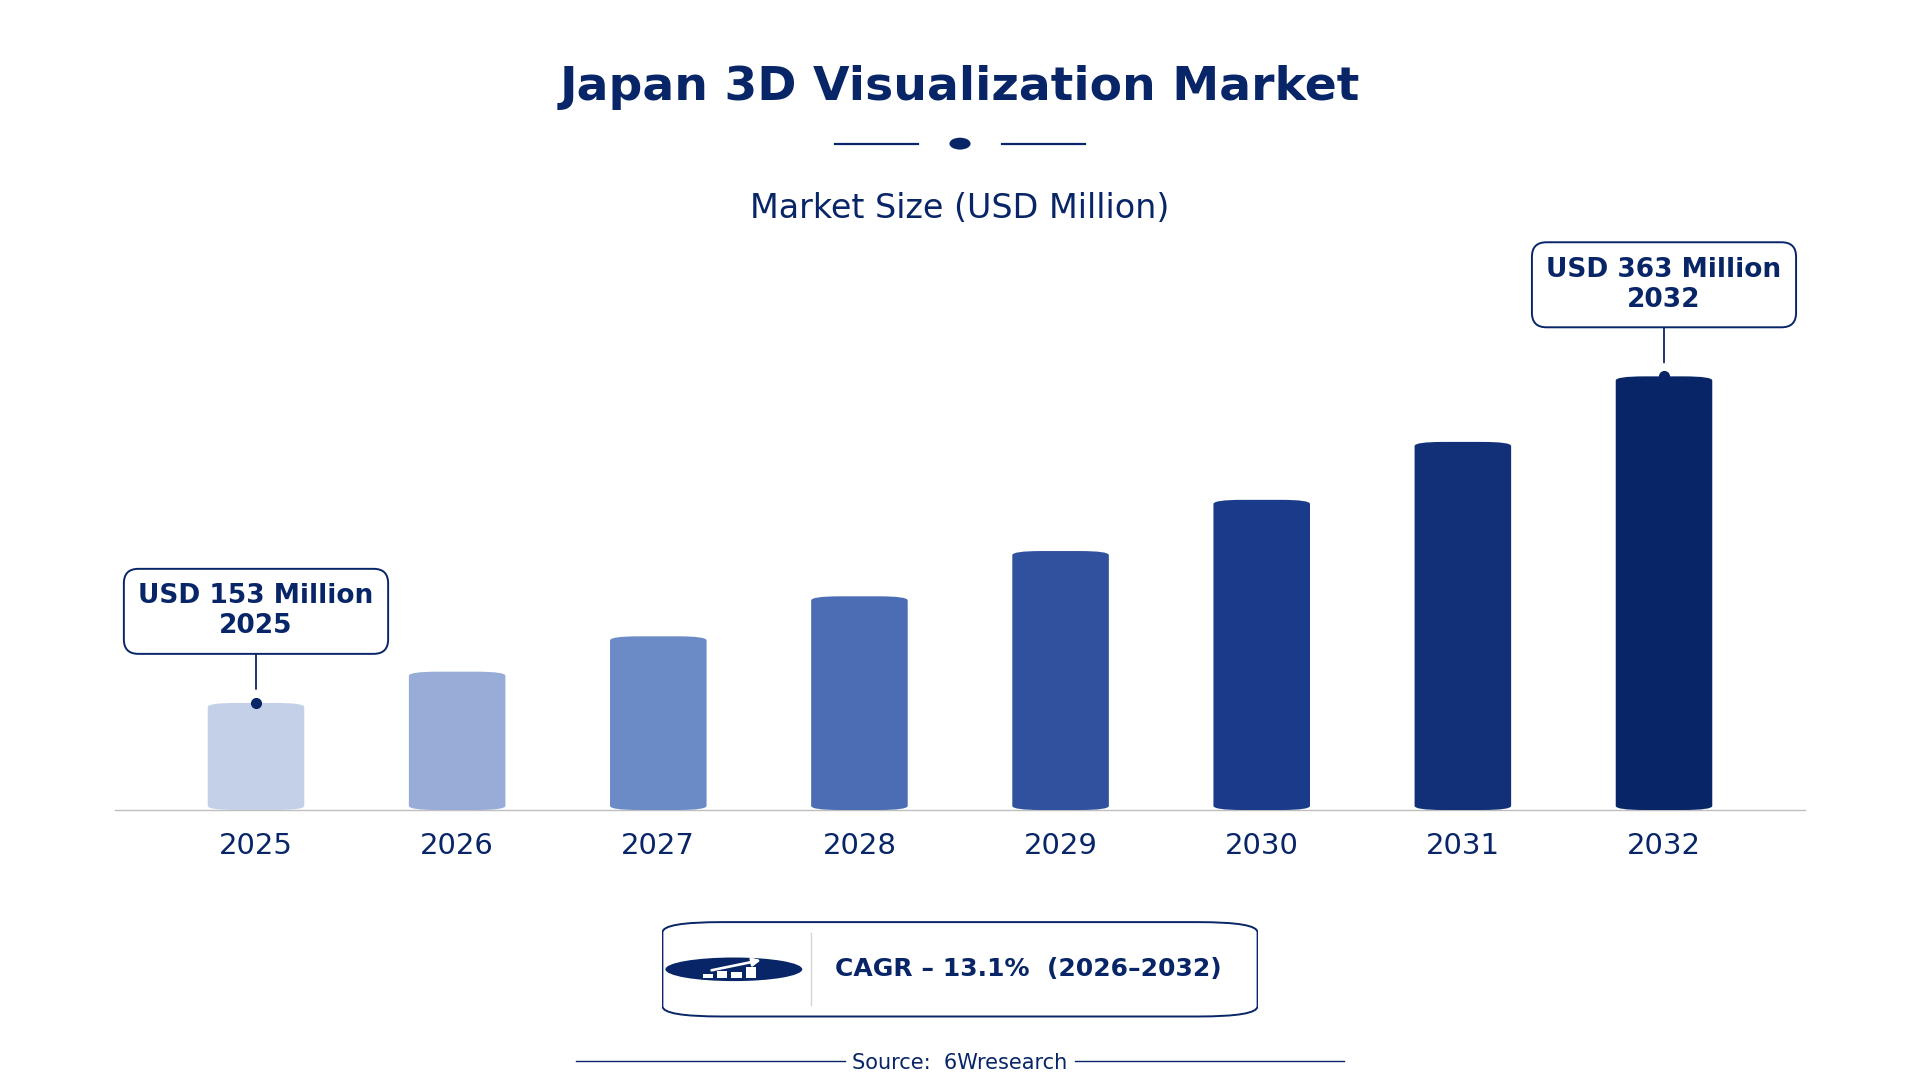
According to 6Wresearch internal database and industry insights, the Japan 3D Visualization Market was valued at USD 153 Million in 2025 and is projected to reach USD 363 Million by 2032, growing at a CAGR of approximately 13.1% during 2026–2032.
Japan 3D Visualization Market Highlights
| Report Metric | Details |
| Report Name | Japan 3D Visualization Market (2026-2032) |
| Market Size 2025 | USD 153 Million |
| Market Size 2032 | USD 363 Million |
| Absolute Growth 2025–2032 | USD 210 Million |
| CAGR 2026–2032 | 13.1% |
| Peak Annual Growth | 14.2% in 2026 |
| Forecast Period | 2026–2032 |
| Historical Data | 2022–2025 |
| Base Year | 2025 |
| Leading Solution Type, 2025 | 3D Modeling Software (41% share) |
| Leading Deployment Mode, 2025 | Cloud-Based (47% share) |
| Leading Platform Type, 2025 | Desktop (48% share) |
| Leading Distribution Channel, 2025 | Online Subscription (41% share) |
| Leading End User Industry, 2025 | Gaming (45% share) |
| Fastest-Growing Solution Type | AR/VR Integration (19.3% CAGR) |
| Fastest-Growing Platform Type | Web-Based (18.5% CAGR) |
| Fastest-Growing Distribution Channel | Direct Sales (17.6% CAGR) |
| Fastest-Growing End User Industry | Architecture (16.9% CAGR) |
| Growing Sector | 3D Visualization |
| Key End Users | Film and Animation, Gaming, Architecture, Real Estate |
Japan 3D Visualization Market Year-wise Growth Rate and Key Drivers (2022–2032)
This graph illustrates the annual growth rates of the market from 2022 to 2032, highlighting a steady upward trajectory and projected market expansion over the forecast period.
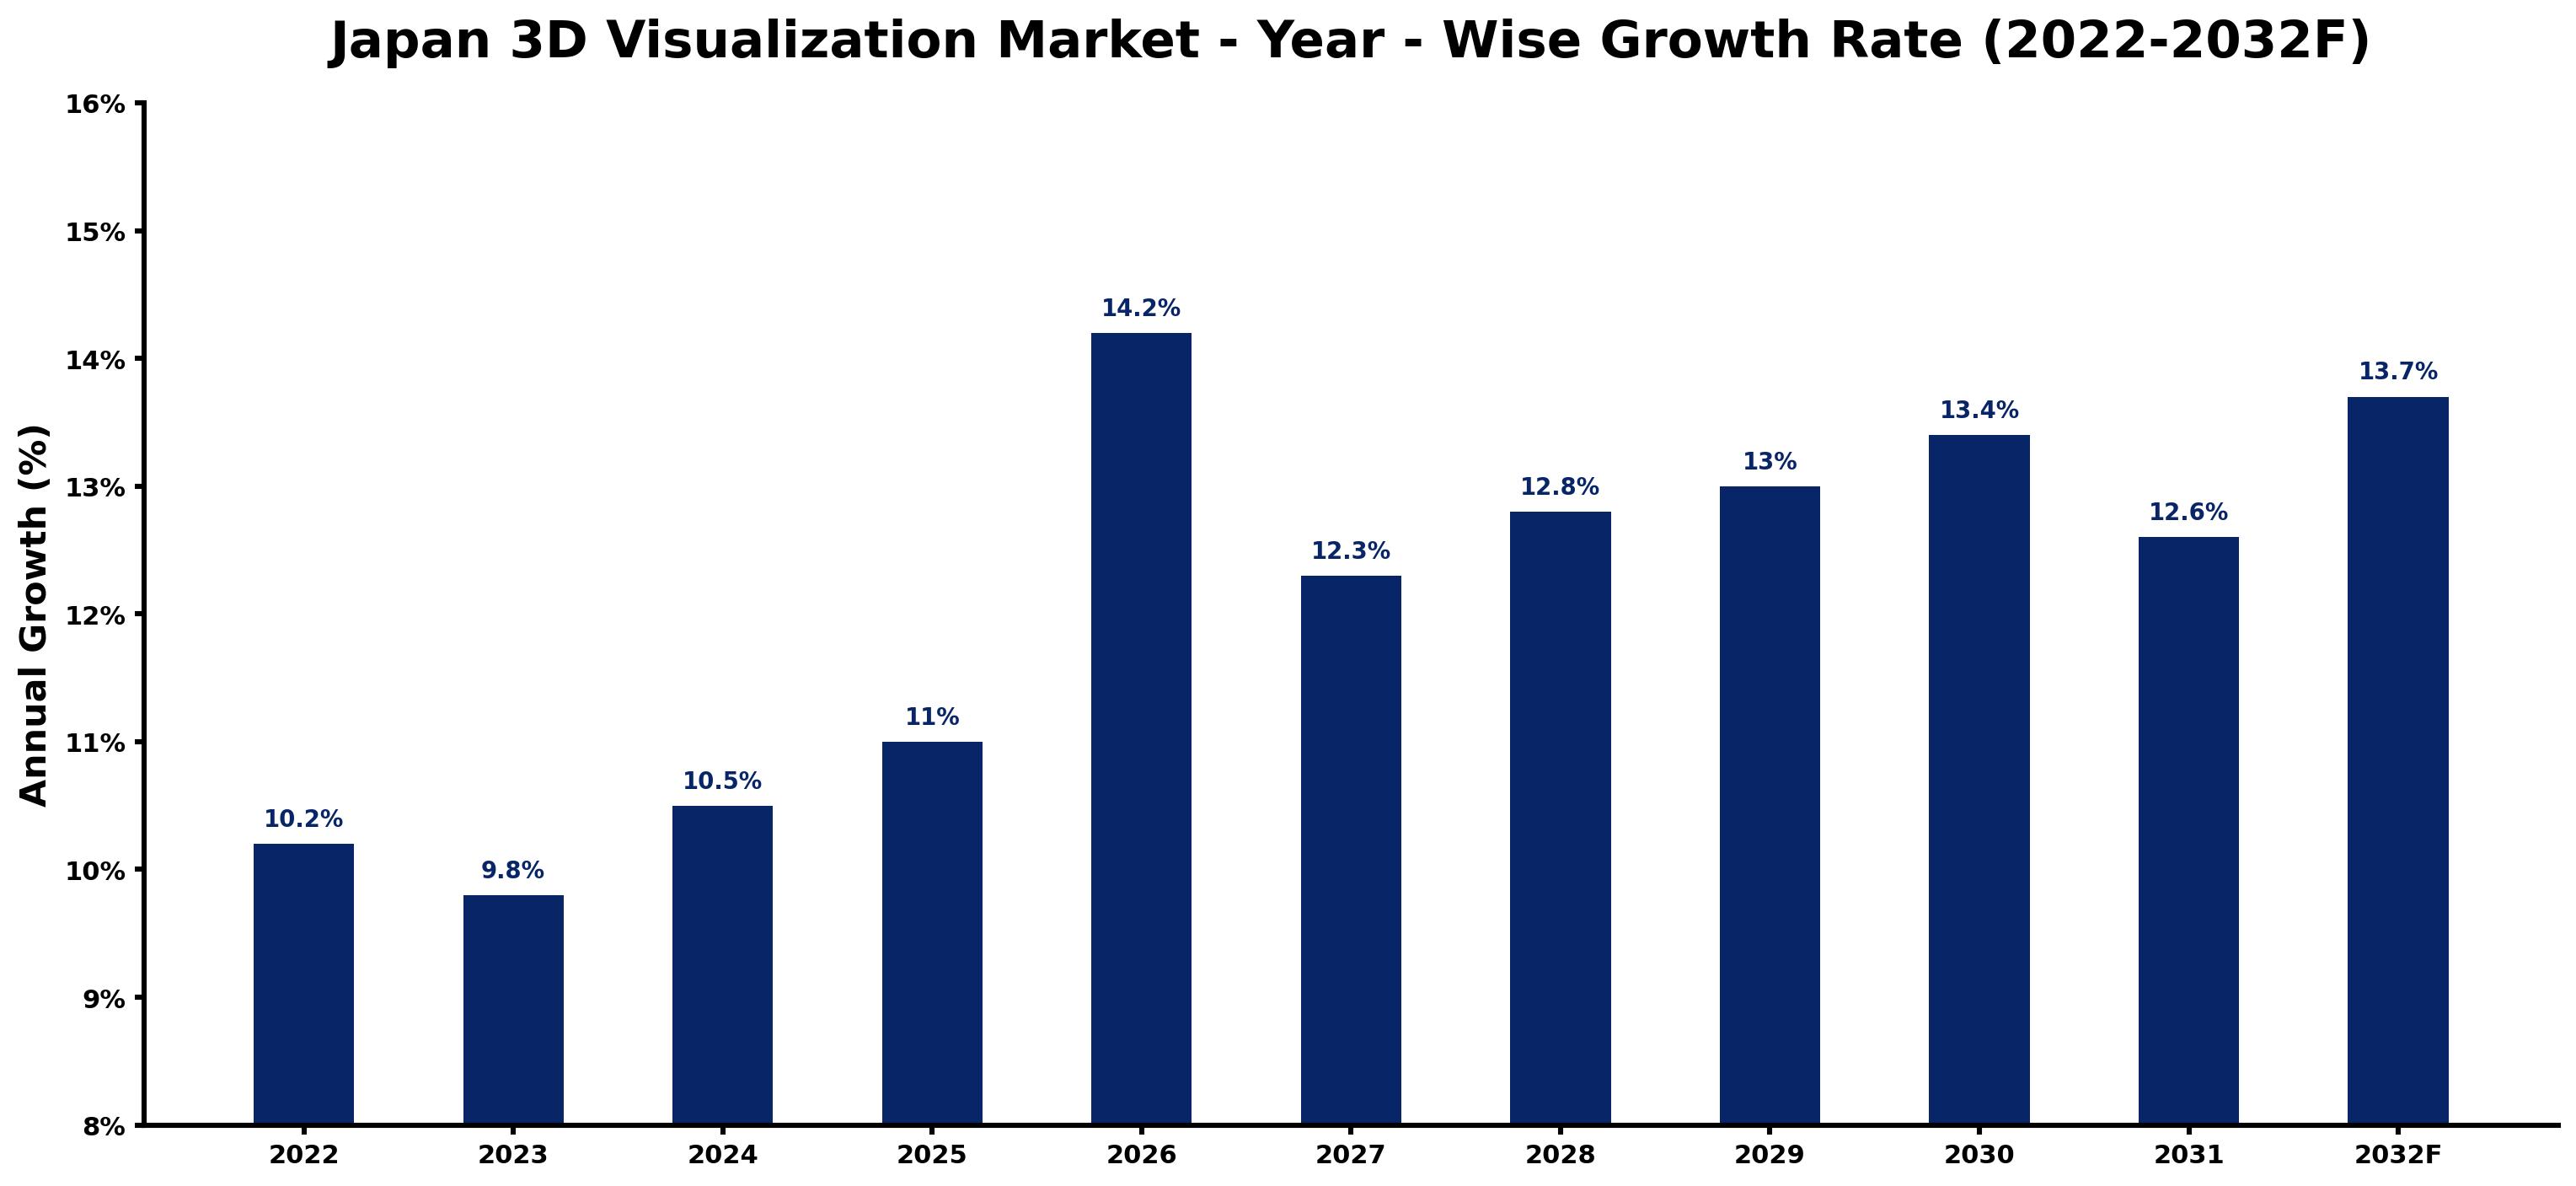
Below, each year's estimated growth is shown next to the factor that most influenced it.
| Year | Estimated Annual Growth (%) | Market Rationale |
| 2022 | 10.2 | The market experienced steady growth, reflecting strong demand from the entertainment sector. |
| 2023 | 9.8 | Growth slowed slightly due to market saturation in some segments, yet demand remained strong. |
| 2024 | 10.5 | Increased adoption of 3D visualization tools accelerated growth as firms sought competitive advantages. |
| 2025 | 11.0 | The market expanded further as the architectural sector embraced advanced visualization techniques. |
| 2026 | 14.2 | Rapid technological advancements in AR/VR technologies boosted market growth. |
| 2027 | 12.3 | Growth slowed as competition intensified, leading to price adjustments among providers. |
| 2028 | 12.8 | Demand increased as more industries recognised the value of 3D visualization for project planning. |
| 2029 | 13.0 | The market continued to grow as educational institutions integrated 3D visualization into curricula. |
| 2030 | 13.4 | Increased investments in gaming technologies further propelled the market forward. |
| 2031 | 12.6 | Growth moderated as firms focused on optimising existing technologies rather than new investments. |
| 2032 | 13.7 | The market surged as cloud-based solutions became the preferred choice for many users. |
Note: Market size estimations and growth projections presented in this report are based on 6Wresearch's proprietary forecasting methodology, utilizing the latest available industry data, government publications, and primary research inputs.
Japan 3D Visualization Market Synopsis
3D Visualization involves creating three-dimensional representations of objects or environments through specialized software. This technology is essential in sectors like film, gaming, architecture, and real estate, where visualisation aids in concept development. The Japan 3D Visualization Market is growing due to rising demand from the gaming industry, which sold over 5 million consoles in 2023, and the architectural sector, employing over 200,000 professionals. Advancements in AR/VR technologies and cloud-based solutions are driving further adoption across various sectors.
Market Dynamics Impact Analysis (2026–2032)
| Factor | Type | Impact | Primary Segment Affected |
| Growing demand for immersive experiences in gaming and training applications | Driver | High | AR/VR Integration |
| Increased adoption of cloud-based solutions for flexibility and accessibility | Driver | High | Cloud-Based |
| Expansion of the architectural sector's use of 3D visualization for client presentations | Opportunity | High | Architecture |
| Emerging demand for 3D visualization in educational institutions and training facilities | Opportunity | Medium | Simulation Software |
| High costs associated with advanced software licensing and training | Restraint | High | 3D Modeling Software |
| Limited awareness among potential users about the benefits of 3D visualization technologies | Restraint | Medium | AR/VR Integration |
| Intense competition leading to price wars among software providers | Challenge | High | Cloud-Based |
| Rapid technological changes requiring constant updates and training for users | Challenge | Medium | Simulation Software |
Evaluation of Drivers in Japan 3D Visualization Market (2026–2032)
The following drivers explain most of the expected growth.
| Drivers | Primary Segment Affected | Why It Matters (Evidence) |
| Increased sales of gaming consoles | Gaming | Over 5 million consoles sold in 2023 spurred demand for advanced graphics and 3D technologies. |
| Rising architectural projects requiring visualisation tools | Architecture | The architectural sector employs over 200,000 professionals, driving demand for precision design tools. |
| Growing interest in AR/VR technologies | AR/VR Integration | The number of AR/VR users in Japan surpassed 10 million in 2023, enhancing immersive experiences. |
| Adoption of cloud-based solutions for software deployment | Cloud-Based | Cloud-based solutions account for over 40% of software deployments, offering flexibility and accessibility. |
| Increased production in the film and animation sector | Film & Animation | The Japan Animation Association reported a 15% increase in production in 2023, boosting demand. |
Purchasing is picking up as over 5 million gaming consoles were sold in Japan in 2023, driving demand for advanced graphics and 3D technologies. The architectural sector employs over 200,000 professionals, which increases the need for precision design tools. The number of AR/VR users in Japan surpassed 10 million in 2023, enhancing immersive experiences across various applications. The Japan Animation Association reported a 15% increase in production in 2023, boosting demand for 3D visualization tools. The architectural sector's ongoing projects are expected to further stimulate demand for advanced visualization solutions.
Evaluation of Restraints in Japan 3D Visualization Market
These are the pressures that could keep growth below its potential.
| Market Restraint | Primary Segment Affected | Why It Matters (Evidence) |
| High costs associated with advanced software licensing | 3D Modeling Software | Advanced software licenses can exceed USD 10,000, limiting access for smaller firms. |
| Limited awareness about 3D visualization benefits | AR/VR Integration | Many potential users lack knowledge about the advantages of integrating 3D technologies. |
| Inadequate training programs for new technologies | Simulation Software | A shortage of training resources hampers effective adoption of simulation tools. |
| Dependence on high-performance hardware for optimal use | Cloud-Based | Users require significant investment in hardware to fully utilise cloud-based 3D solutions. |
| Fragmented market with many small players | Film & Animation | The presence of numerous small firms dilutes brand recognition and market share. |
Japan 3D Visualization Market Challenges
Producers in the 3D visualization market face intense competition from emerging technologies, which pressures profit margins and can reduce investment in new projects. Buyers struggle with the high costs of advanced software, leading to delays in project completion and potential revenue losses of up to 15%. Importers encounter rising costs due to fluctuating software licensing fees, which can increase operational expenses by up to 20% and affect pricing strategies. A lack of skilled professionals hinders producers' ability to meet project demands, resulting in longer turnaround times and missed opportunities for clients in sectors like entertainment and construction.
Trends in the Japan 3D Visualization Market
Buyers and suppliers in the Japan 3D Visualization Market are adjusting to the following trends.
- Shift to Cloud-Based Solutions: The Tokyo region is experiencing a shift towards cloud-based solutions for 3D visualization, accounting for over 40% of deployments. This trend allows firms to access advanced tools without significant upfront investments, streamlining workflows.
- Increasing AR/VR Adoption in Education: Educational institutions are increasingly adopting AR/VR technologies for immersive learning experiences. In 2023, the number of AR/VR users in Japan surpassed 10 million, highlighting the growing integration of these technologies in training.
- Growing Demand for Real Estate Virtual Tours: The real estate sector is embracing 3D visualization for virtual tours, enhancing property marketing. This trend is driven by a rising number of online property listings, which increased by 20% in 2023.
- Expansion of Gaming Graphics Technologies: The gaming industry is prioritising advanced graphics technologies, as highlighted by the Tokyo Game Show 2023. This event showcased innovations that cater to the increasing demand for immersive gaming experiences.
Investment Opportunities in the Japan 3D Visualization Market
Investors looking at the Japan 3D Visualization Market should consider the following areas.
- Tokyo as a Hub for 3D Visualization: Tokyo's vibrant tech scene presents opportunities for investment in 3D visualization solutions, with over 5 million gaming consoles sold in 2023. Firms can enter through local partnerships or joint ventures.
- Architectural Firms Seeking Advanced Tools: With over 200,000 professionals in the architectural sector, there is a demand for advanced 3D visualization tools. Collaborating with local firms can facilitate market entry.
- Real Estate Virtual Tour Services: The real estate sector's increasing use of virtual tours creates opportunities for service providers. Firms can invest in technology solutions to cater to this growing need.
- AR/VR Integration in Education: The rise of AR/VR users in Japan, surpassing 10 million, indicates a need for educational tools. Companies can partner with educational institutions to provide tailored solutions.
Government Initiatives in the Japan 3D Visualization Market
The AI Promotion Act (2025) encourages the adoption of AI technologies among 3D visualization producers, promoting innovation and competitiveness in the sector. This measure aims to support firms that integrate AI into their offerings, improving their capabilities and market reach.
The Digital Agency, established in September 2021, oversees government digital transformation initiatives. This agency supports 3D visualization buyers by ensuring that digital tools meet established standards, facilitating smoother implementation across various sectors.
Future Insight of the Japan 3D Visualization Market
The Tokyo Game Show 2023 showcased advancements in 3D gaming technologies, indicating a shift towards more immersive experiences. By 2032, the architectural sector will likely adopt new digital transformation initiatives supported by the Ministry of Economy, Trade and Industry. As the number of AR/VR users in Japan surpasses 10 million, suppliers will need to innovate their offerings to stay competitive. New standards will emerge, improving collaboration and efficiency across projects, particularly in the film and animation sectors.
Market Segmentation Analysis
Japan 3D Visualization Market report covers a detailed analysis of the following market segments:
By Solution Type – 3D Modeling Software Leads, AR/VR Integration Expected to Grow Fastest
According to Saurav Kr Singh, Senior Research Analyst at 6Wresearch, in 2025, 3D Modeling Software led the solution type split with a 41% share. 3D Modeling Software holds the largest share as it is essential for creating detailed models across various sectors, particularly in architecture and gaming. The significant reliance on these tools in the Tokyo region, a hub for film and animation, emphasises their critical role. AR/VR Integration is set to record the highest CAGR in this split, 19.3% over 2026–2032. AR/VR Integration is experiencing rapid growth due to its integral role in delivering immersive experiences, especially in gaming and training. The notable advancements highlighted at the Tokyo Game Show 2023 demonstrate the increasing demand for these technologies, indicating a robust growth trajectory. Suppliers should prioritise the development of AR/VR features to meet the rising expectations of users.
By Deployment Mode – Cloud-Based Leads and Records the Fastest Growth
The largest deployment mode category in 2025 was Cloud-Based, at 47% of revenue. Cloud-Based solutions dominate the market as they provide flexibility and accessibility, which are highly valued by users in various sectors. Over 40% of software deployments in the industry are cloud-based, reflecting this trend. The same category is also set to grow fastest, at a CAGR of 14.5% during 2026–2032. The growth of Cloud-Based deployment continues as it meets the increasing demand for scalable and accessible solutions across industries. The ongoing digital transformation initiatives supported by the Ministry of Economy, Trade and Industry further drive this trend. Buyers will benefit from the convenience and scalability offered by cloud-based solutions.
By Platform Type – Desktop Leads, Web-Based Expected to Grow Fastest
Desktop accounted for 48% of the market by platform type in 2025. Desktop platforms remain the primary choice for professional use in the 3D visualization market, particularly among architects and designers. This traditional platform supports the complex software required for detailed modelling and rendering tasks. Over 2026–2032, Web-Based is expected to post the fastest growth, at a CAGR of 18.5%. Web-Based platforms are gaining traction due to their ease of access, allowing users to work from various locations without the need for powerful hardware. This shift aligns with the growing trend towards remote work and collaboration. Suppliers should consider developing more web-based solutions to cater to the changing preferences of users.
By Distribution Channel – Online Subscription Leads, Direct Sales Expected to Grow Fastest
Online Subscription took 41% of distribution channel revenue in 2025, more than any other category. Online Subscription leads the distribution channel as it offers ongoing access to software, appealing to users who prefer flexible payment models. This approach has gained popularity among consumers seeking continuous updates and support for their software needs. Direct Sales is projected to grow fastest, at a CAGR of 17.6% during 2026–2032. Direct Sales are witnessing rapid growth as they remain the primary method for software distribution, allowing for direct engagement with customers. This strategy facilitates tailored solutions that align with specific client requirements, enhancing overall customer satisfaction. Suppliers need to refine their direct sales approaches to effectively connect with and serve potential customers.
By End User Industry – Gaming Leads, Architecture Expected to Grow Fastest
With 45% of end user industry revenue in 2025, Gaming was the largest category. Gaming is the dominant end user industry, significantly driving demand for advanced graphics and immersive experiences. The sale of over 5 million gaming consoles in 2023 underscores the sector's critical role in the 3D visualization market. Architecture is set to record the highest CAGR in this split, 16.9% over 2026–2032. Architecture is growing the fastest as it becomes increasingly vital for design and client presentations, reflecting a heightened reliance on visualisation tools within the sector. The architectural community's increasing demand for detailed visualisation supports this upward trend. Suppliers should customise their products to address the unique needs of the architecture sector to leverage this growth opportunity.
Key Attractiveness of the Report
- 10 Years of Market Numbers
- Historical Data Starting from 2022 to 2025
- Base Year 2025
- Forecast Data until 2032
- Key Performance Indicators Impacting the Market
- Major Upcoming Developments and Projects
Key Highlights of the Report:
- Japan 3D Visualization Market Outlook
- Market Size of Japan 3D Visualization Market, 2025
- Forecast of Japan 3D Visualization Market, 2032
- Historical Data and Forecast of Japan 3D Visualization Revenues & Volume for the Period 2022-2032F
- Japan 3D Visualization Market Trend Evolution
- Japan 3D Visualization Market Drivers and Challenges
- Japan 3D Visualization Price Trends
- Japan 3D Visualization Porter's Five Forces
- Japan 3D Visualization Industry Life Cycle
- Historical Data and Forecast of Japan 3D Visualization Market Revenues & Volume By Solution Type for the Period 2022-2032F
- Historical Data and Forecast of Japan 3D Visualization Market Revenues & Volume By 3D Modeling Software for the Period 2022-2032F
- Historical Data and Forecast of Japan 3D Visualization Market Revenues & Volume By Simulation Software for the Period 2022-2032F
- Historical Data and Forecast of Japan 3D Visualization Market Revenues & Volume By AR/VR Integration for the Period 2022-2032F
- Historical Data and Forecast of Japan 3D Visualization Market Revenues & Volume By CAD Tools for the Period 2022-2032F
- Historical Data and Forecast of Japan 3D Visualization Market Revenues & Volume By Deployment Mode for the Period 2022-2032F
- Historical Data and Forecast of Japan 3D Visualization Market Revenues & Volume By On-Premise for the Period 2022-2032F
- Historical Data and Forecast of Japan 3D Visualization Market Revenues & Volume By Cloud-Based for the Period 2022-2032F
- Historical Data and Forecast of Japan 3D Visualization Market Revenues & Volume By Hybrid for the Period 2022-2032F
- Historical Data and Forecast of Japan 3D Visualization Market Revenues & Volume By SaaS for the Period 2022-2032F
- Historical Data and Forecast of Japan 3D Visualization Market Revenues & Volume By Platform Type for the Period 2022-2032F
- Historical Data and Forecast of Japan 3D Visualization Market Revenues & Volume By Desktop for the Period 2022-2032F
- Historical Data and Forecast of Japan 3D Visualization Market Revenues & Volume By Mobile for the Period 2022-2032F
- Historical Data and Forecast of Japan 3D Visualization Market Revenues & Volume By VR Headsets for the Period 2022-2032F
- Historical Data and Forecast of Japan 3D Visualization Market Revenues & Volume By Web-Based for the Period 2022-2032F
- Historical Data and Forecast of Japan 3D Visualization Market Revenues & Volume By Distribution Channel for the Period 2022-2032F
- Historical Data and Forecast of Japan 3D Visualization Market Revenues & Volume By Direct Sales for the Period 2022-2032F
- Historical Data and Forecast of Japan 3D Visualization Market Revenues & Volume By Online Subscription for the Period 2022-2032F
- Historical Data and Forecast of Japan 3D Visualization Market Revenues & Volume By Specialized Resellers for the Period 2022-2032F
- Historical Data and Forecast of Japan 3D Visualization Market Revenues & Volume By B2B Platforms for the Period 2022-2032F
- Historical Data and Forecast of Japan 3D Visualization Market Revenues & Volume By End User Industry for the Period 2022-2032F
- Historical Data and Forecast of Japan 3D Visualization Market Revenues & Volume By Film & Animation for the Period 2022-2032F
- Historical Data and Forecast of Japan 3D Visualization Market Revenues & Volume By Gaming for the Period 2022-2032F
- Historical Data and Forecast of Japan 3D Visualization Market Revenues & Volume By Real Estate for the Period 2022-2032F
- Historical Data and Forecast of Japan 3D Visualization Market Revenues & Volume By Architecture for the Period 2022-2032F
- Japan 3D Visualization Import Export Trade Statistics
- Market Opportunity Assessment By Solution Type
- Market Opportunity Assessment By Deployment Mode
- Market Opportunity Assessment By Platform Type
- Market Opportunity Assessment By Distribution Channel
- Market Opportunity Assessment By End User Industry
- Japan 3D Visualization Top Companies Market Share
- Japan 3D Visualization Competitive Benchmarking By Technical and Operational Parameters
- Japan 3D Visualization Company Profiles
- Japan 3D Visualization Key Strategic Recommendations
Market Covered
Segments analysed in this report are listed below.
By Solution Type
- 3D Modeling Software
- Simulation Software
- AR/VR Integration
- CAD Tools
By Deployment Mode
- On-Premise
- Cloud-Based
- Hybrid
- SaaS
By Platform Type
- Desktop
- Mobile
- VR Headsets
- Web-Based
By Distribution Channel
- Direct Sales
- Online Subscription
- Specialized Resellers
- B2B Platforms
By End User Industry
- Film & Animation
- Gaming
- Real Estate
- Architecture































