Japan Agricultural Repellents Market Size & Growth Rate
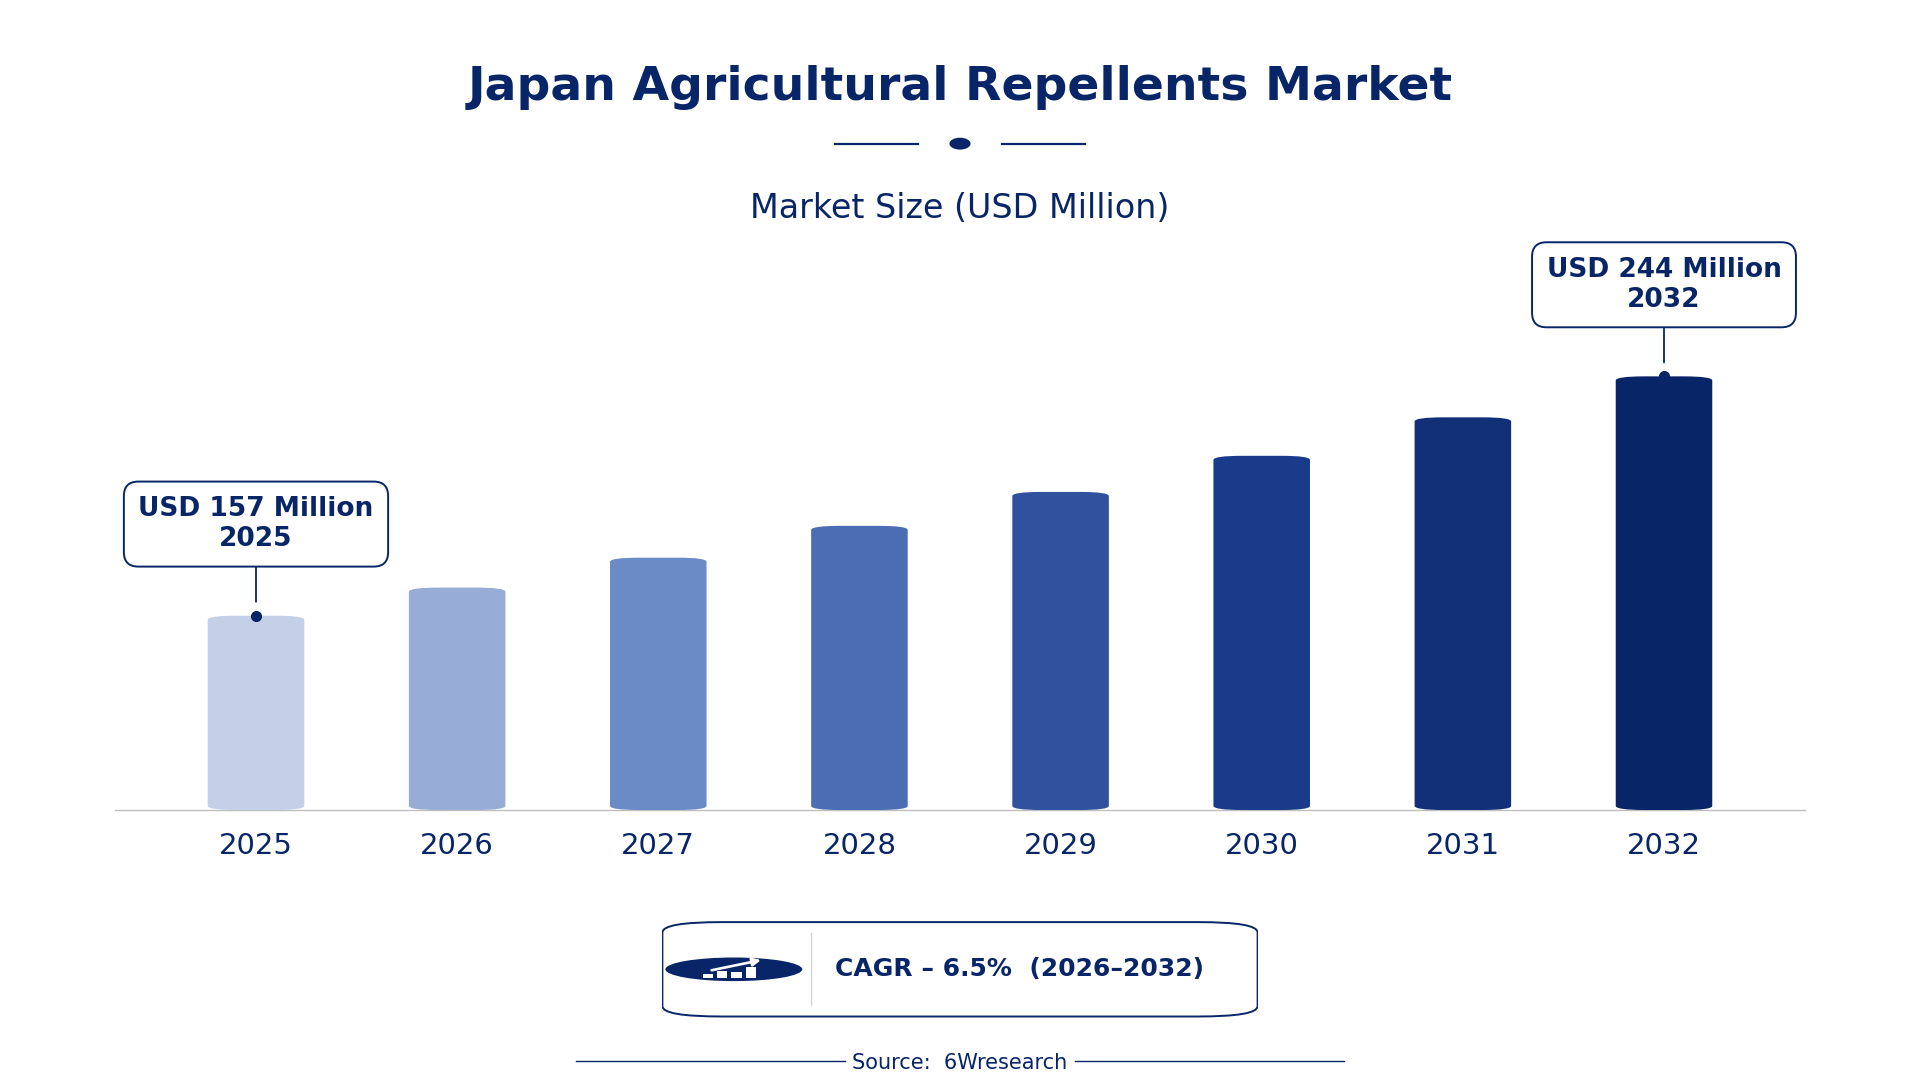
According to 6Wresearch internal database and industry insights, the Japan Agricultural Repellents Market was valued at USD 157 Million in 2025 and is projected to reach USD 244 Million by 2032, growing at a CAGR of approximately 6.5% during 2026–2032.
Japan Agricultural Repellents Market Highlights
| Report Metric | Details |
| Report Name | Japan Agricultural Repellents Market (2026-2032) |
| Market Size 2025 | USD 157 Million |
| Market Size 2032 | USD 244 Million |
| Absolute Growth 2025–2032 | USD 87 Million |
| CAGR 2026–2032 | 6.5% |
| Peak Annual Growth | 7.3% in 2028 |
| Forecast Period | 2026–2032 |
| Historical Data | 2022–2025 |
| Base Year | 2025 |
| Leading Agricultural Repellents Market, 2025 | Natural Repellents (47% share) |
| Leading Product Type, 2025 | Herbivores (46% share) |
| Leading Target Type, 2025 | Online Platforms (36% share) |
| Leading Distribution Channel, 2025 | Organic Farms (42% share) |
| Fastest-Growing Agricultural Repellents Market | Chemical Repellents (8.8% CAGR) |
| Fastest-Growing Product Type | Insects (9.1% CAGR) |
| Fastest-Growing Target Type | Agri Retailers (9.5% CAGR) |
| Fastest-Growing Distribution Channel | Crop Growers (8.3% CAGR) |
| Growing Sector | Agricultural sector |
| Key End Users | Farmers, Organic growers, Agricultural retailers, Crop producers |
Japan Agricultural Repellents Market Year-wise Growth Rate and Key Drivers (2022–2032)
This graph illustrates the annual growth rates of the market from 2022 to 2032, highlighting a steady upward trajectory and projected market expansion over the forecast period.
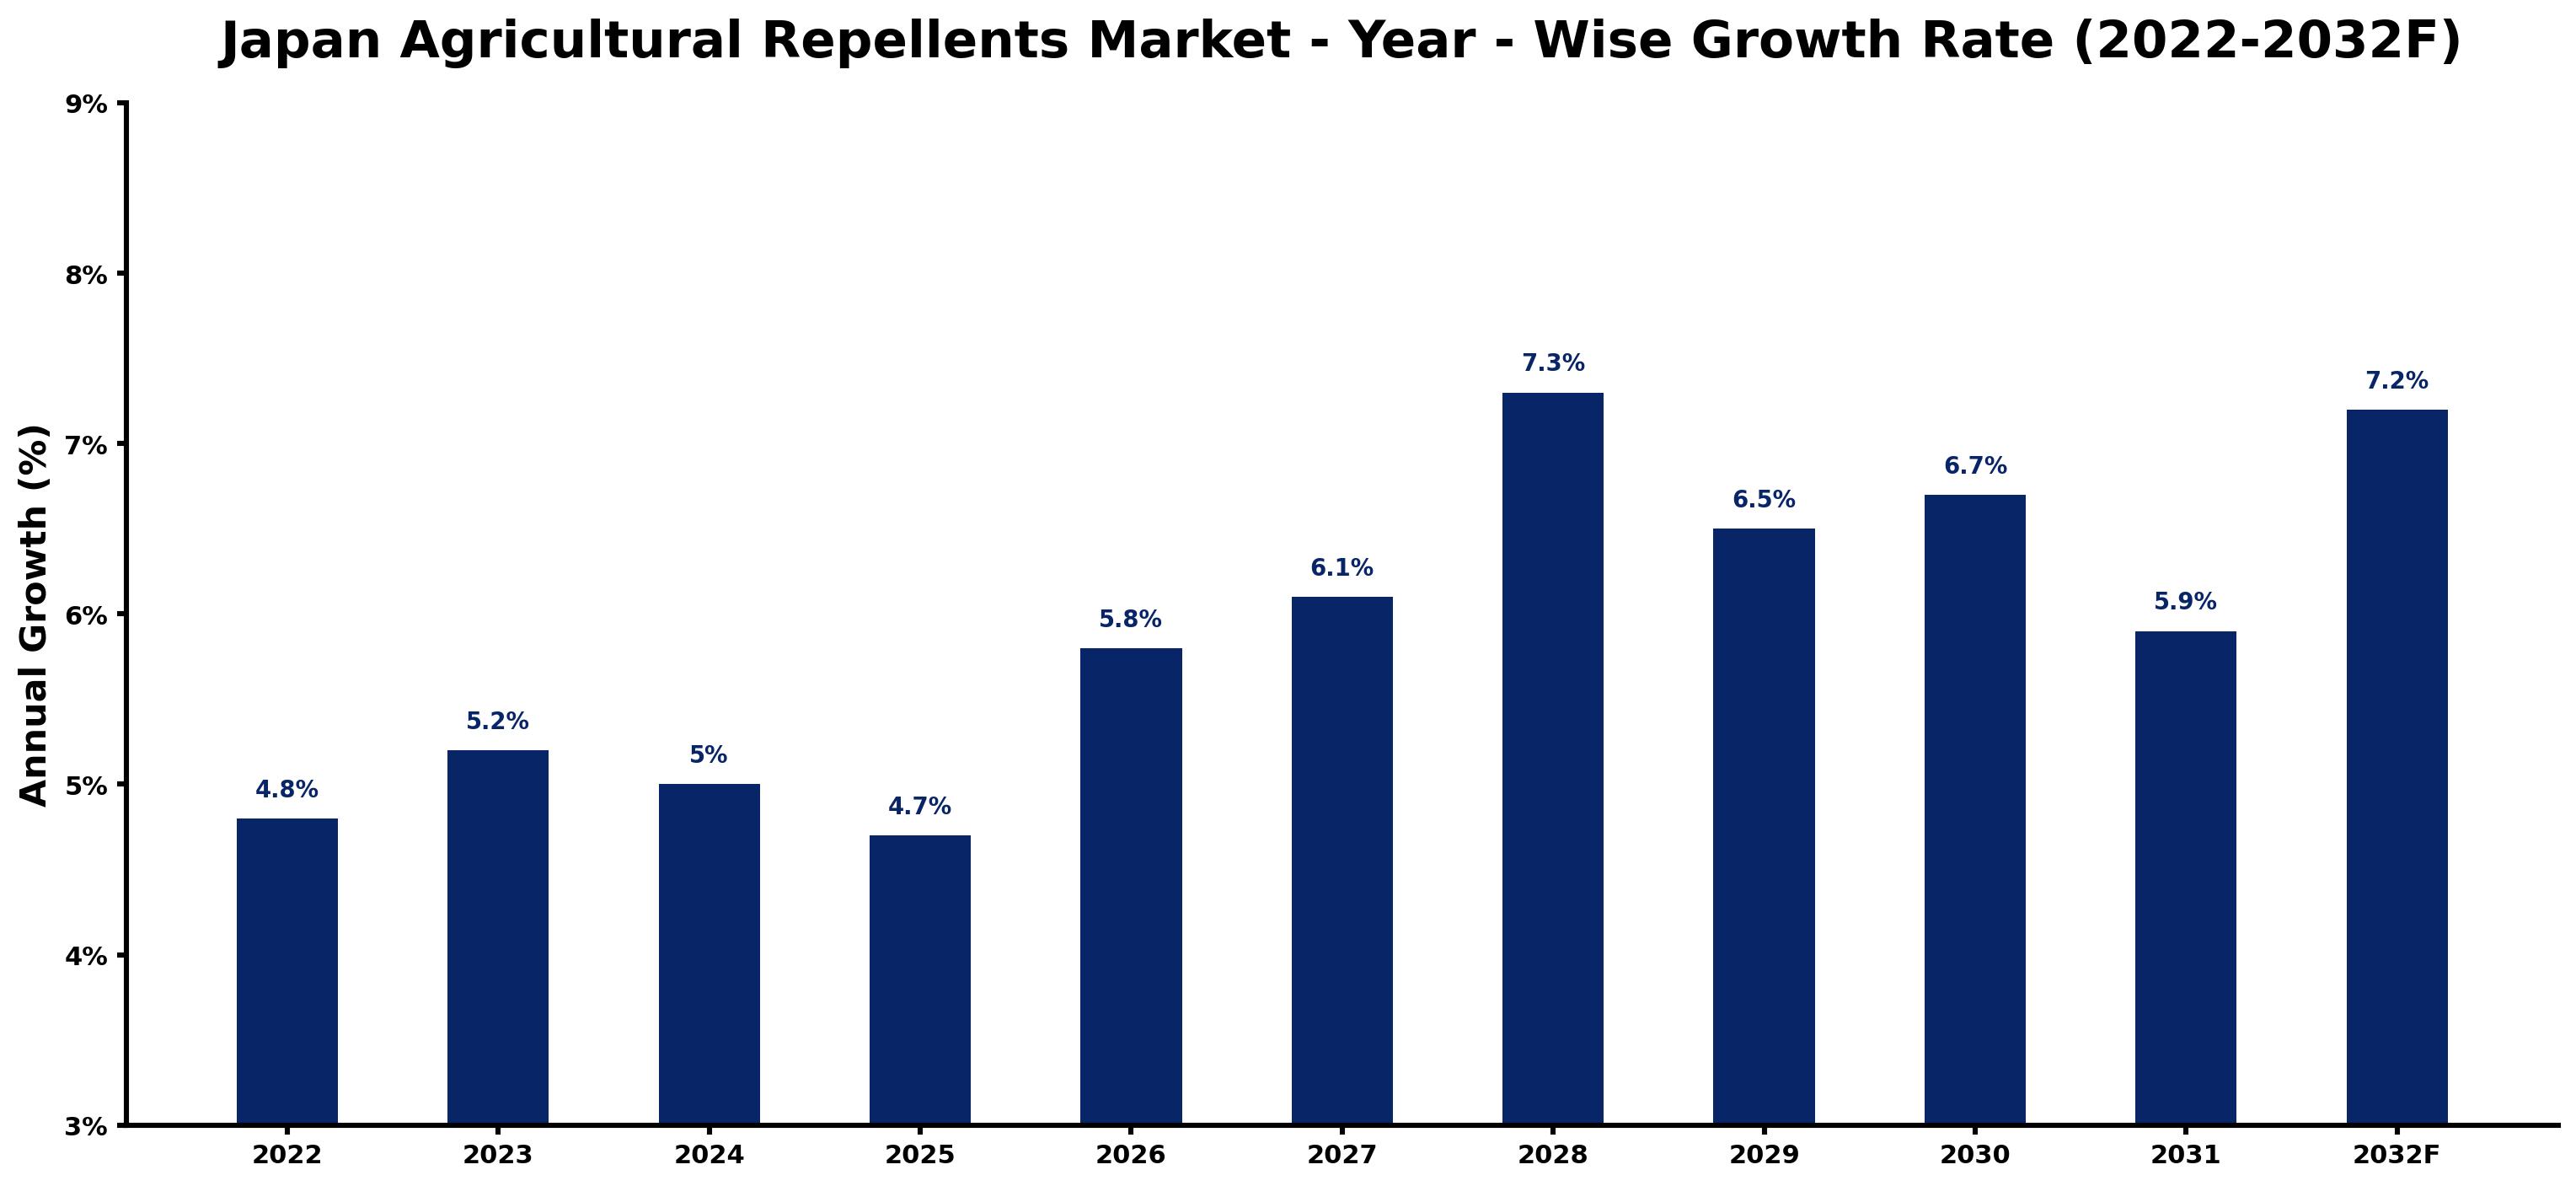
Annual growth estimates for each year appear below with the principal reason behind them, explaining the shifts that set the pace of the market.
| Year | Estimated Annual Growth (%) | Market Rationale |
| 2022 | 4.8 | The agricultural sector faced stable demand for pest control solutions. |
| 2023 | 5.2 | Increased awareness of pest management practices contributed to growth. |
| 2024 | 5.0 | Market growth slowed due to saturation in certain regions. |
| 2025 | 4.7 | Demand remained steady as farmers adapted to new pest challenges. |
| 2026 | 5.8 | Rising interest in eco-friendly products is expected to stimulate market growth. |
| 2027 | 6.1 | Innovation in repellent formulations will drive higher sales. |
| 2028 | 7.3 | The introduction of advanced technologies will lead to peak growth. |
| 2029 | 6.5 | Growth is projected to slow as competition intensifies among suppliers. |
| 2030 | 6.7 | Adoption of new pest management strategies will increase demand. |
| 2031 | 5.9 | Market growth is expected to decelerate as price sensitivity affects purchases. |
| 2032 | 7.2 | Sustained interest in sustainable practices will boost demand. |
Note: Market size estimations and growth projections presented in this report are based on 6Wresearch's proprietary forecasting methodology, utilizing the latest available industry data, government publications, and primary research inputs.
Japan Agricultural Repellents Market Synopsis
Agricultural repellents are substances used to deter pests from crops, primarily made from natural or synthetic chemicals. The Japan Agricultural Repellents Market is expanding, with a valuation of approximately 157 million USD by 2025. This growth is driven by factors such as the increasing number of organic farms, which reached 25,000 in 2022, and a shift towards eco-friendly pest management practices. The adoption of sustainable solutions is becoming a priority among farmers, further propelling market demand.
Market Dynamics Impact Analysis (2026–2032)
| Factor | Type | Impact | Primary Segment Affected |
| Growing demand for eco-friendly pest control methods | Driver | High | Natural Repellents |
| Increased use of chemical repellents in rice and vegetable farming | Driver | High | Chemical Repellents |
| Expansion of organic farms seeking natural solutions | Opportunity | High | Natural Repellents |
| Rising online sales channels for agricultural products | Opportunity | Medium | Online Platforms |
| Regulatory scrutiny on chemical substances affecting product availability | Restraint | High | Chemical Repellents |
| Limited effectiveness of ultrasonic repellents in broader applications | Restraint | Medium | Ultrasonic Repellents |
| High competition among suppliers leading to price wars | Challenge | High | Chemical Repellents |
| Technological barriers in developing new formulations | Challenge | Medium | Natural Repellents |
Evaluation of Drivers in Japan Agricultural Repellents Market (2026–2032)
These are the developments adding the most demand over the forecast period.
| Drivers | Primary Segment Affected | Why It Matters (Evidence) |
| Increased focus on sustainable farming practices | Natural Repellents | Natural repellents align with the growing trend of eco-friendly agriculture, with 25% market share. |
| High usage of chemical repellents in key farming areas | Chemical Repellents | This reliance supports continued purchases from farmers in rice and vegetable farming regions. |
| Growth in organic farming initiatives | Natural Repellents | The number of organic farms reached 25,000 in 2022, increasing demand for natural solutions. |
| Rising online sales of agricultural products | Online Platforms | Online sales grew by 30% last year, expanding access for farmers to various products. |
| Adoption of ISO 14001 standard by producers | Chemical Repellents | This standard promotes environmentally responsible practices, boosting demand for compliant products. |
Spending rises because the agricultural sector in Kanto increasingly adopts sustainable practices, leading to a market share of 25% for natural repellents. The number of organic farms has reached 25,000, driving demand for eco-friendly solutions. Recent growth in online sales channels for agricultural products provides farmers with easier access to repellents. Reliance on chemical repellents in rice and vegetable farming regions continues to support market growth. The adoption of eco-friendly practices by producers encourages the development of compliant products, further increasing market interest.
Evaluation of Restraints in Japan Agricultural Repellents Market
The main factors holding the market back are set out below.
| Market Restraint | Primary Segment Affected | Why It Matters (Evidence) |
| Increased regulatory scrutiny on chemical substances | Chemical Repellents | The Chemical Substances Control Law requires strict evaluation, limiting product availability in the market. |
| Limited effectiveness of ultrasonic repellents in broader applications | Ultrasonic Repellents | Their niche market presence restricts wider adoption among farmers. |
| High competition leading to price wars | Chemical Repellents | Intense competition among suppliers pressures pricing, affecting profitability for producers. |
| Consumer preference for natural solutions over chemical options | Chemical Repellents | Growing awareness of health impacts drives buyers towards eco-friendly alternatives. |
| Technological barriers in developing new formulations | Natural Repellents | Challenges in innovation can slow the introduction of effective new products. |
Japan Agricultural Repellents Market Challenges
Strict regulations on chemical use in agriculture limit the options for pest deterrents, causing delays in pest management for farmers and significantly increasing their operational costs. Supply chain disruptions lead to inconsistent availability of natural repellents, forcing producers to rely on less effective alternatives and risking crop damage, which could result in losses of up to 9 trillion yen in the agricultural sector. Buyers are facing rising costs as demand for eco-friendly solutions increases, with natural products now comprising 25% of the market. Many farmers are hindered by outdated pest control technology, resulting in reduced crop yields and lower profitability.
Trends in the Japan Agricultural Repellents Market
The trends below show where the Japan Agricultural Repellents Market is heading.
- Shift towards Natural Repellents: Since 2022, there has been a noticeable shift towards natural repellents in Japan, driven by consumer demand for eco-friendly solutions. The Tokyo Agricultural Association is actively promoting this change and advocating for sustainable practices.
- Surge in Online Sales Channels: In 2023, online platforms emerged as a significant sales channel for agricultural products, experiencing a 30% growth rate. This trend enables farmers to access a wider range of repellents, thereby enhancing market reach.
- Implementation of Environmental Standards: The implementation of the Chemical Substances Control Law among agricultural producers commenced in 2023, promoting environmentally responsible practices. This transition encourages the use of natural repellents, aligning with sustainability objectives.
- Expansion of Organic Farming Initiatives: The increase in organic farms in Japan, reaching 25,000 in 2022, has spurred demand for natural pest control solutions. This trend supports the market's movement towards eco-friendly products.
Investment Opportunities in the Japan Agricultural Repellents Market
Below are the investment opportunities with the strongest case in the Japan Agricultural Repellents Market.
- Natural Repellents: With the growing number of organic farms, there is an opportunity to supply natural repellents. Demand for these products is on the rise, particularly in regions focused on sustainable agriculture.
- Investment in Online Sales Channels: The timing is favourable for investing in online sales channels, which have recently grown by 30%. Targeting agricultural retailers can facilitate entry into this expanding market.
- Partnerships with Agri Retailers: Forming partnerships with agri retailers can leverage their established customer base. This strategy is particularly relevant now as demand for eco-friendly solutions continues to rise.
- Research on Eco-Friendly Solutions: The Japanese government allocated 1 billion yen for agricultural innovation in 2023. This funding presents opportunities for companies focused on developing sustainable pest management products.
Government Initiatives in the Japan Agricultural Repellents Market
The GX Promotion Act, established in 2023, provides a legal framework for promoting eco-friendly agricultural practices. This law complements the Chemical Substances Control Law, which mandates the evaluation of chemical substances, ensuring safer pest control methods are adopted by producers. The act aims to encourage sustainable practices among farmers and improve the overall safety of agricultural products.
The Digital Agency oversees the approval of sustainable pest management practices. This agency supports research initiatives with allocated funding of 1 billion yen, promoting the development of eco-friendly agricultural solutions. Their efforts aim to improve the effectiveness of pest management while ensuring compliance with environmental standards.
Future Insight of the Japan Agricultural Repellents Market
Advancements in eco-friendly pest control technology are expected to reshape demand by 2032, supported by a government allocation of 1 billion yen for agricultural innovation programs. New standards will motivate producers to improve their environmental management practices, enhancing sustainability. Increased online sales of agricultural products will provide buyers with better access to advanced pest deterrents. A notable 15% rise in the use of repellents in horticulture units since 2020 indicates a growing acceptance of effective solutions among farmers.
Market Segmentation Analysis
Japan Agricultural Repellents Market report covers a detailed analysis of the following market segments:
By Agricultural Repellents Market – Natural Repellents Lead, Chemical Repellents Expected to Grow Fastest
According to Saurav Kr Singh, Senior Research Analyst at 6Wresearch, Natural Repellents held 47% of the Japan Agricultural Repellents Market by agricultural repellents market in 2025. Natural repellents are favoured by environmentally conscious farmers, especially in the Kanto region where sustainable practices are prioritised. The endorsement of these products by the Ministry of Agriculture, Forestry and Fisheries has resulted in their widespread adoption among local agricultural producers. Over 2026–2032, Chemical Repellents are expected to post the fastest growth, at a CAGR of 8.8%. Chemical repellents are experiencing rapid growth due to their effectiveness against a variety of pests, particularly in rice and vegetable farming areas. The increasing demand for enhanced crop yields in these regions is a crucial factor behind this growth. Suppliers should focus on developing chemical repellents to meet the rising demand in key agricultural areas.
By Product Type – Herbivores Lead, Insects Expected to Grow Fastest
The largest product type category in 2025 was Herbivores, at 46% of revenue. Herbivores represent the largest segment as they are a primary threat to crop yields, making them a key focus for farmers aiming to protect their investments. The targeted approach to pest control in this area ensures a strong market presence. Insects are set to record the highest CAGR in this split, 9.1% over 2026–2032. Insects are the fastest-growing segment due to their prevalence in various crops, leading to increased investment in repellents specifically designed to combat them. This growth reflects the urgent need for effective pest management solutions in agriculture. Buyers should prioritise products that specifically target insects to ensure effective pest control and maximise crop productivity.
By Target Type – Online Platforms Lead, Agri Retailers Expected to Grow Fastest
With 36% of target type revenue in 2025, Online Platforms was the largest category. Online platforms are the leading sales channel, offering convenience for farmers seeking agricultural products as the sector shifts towards digital engagement. The 30% increase in online sales underscores a significant transition towards e-commerce in agriculture. The quickest growth will come from Agri Retailers, forecast to expand at a CAGR of 9.5% between 2026 and 2032. Agri retailers are rapidly expanding as they serve as vital distribution points for farmers, particularly in rural areas where access to products is essential. Their growth is critical for ensuring farmers can acquire necessary repellents promptly. Suppliers must strengthen partnerships with agri retailers to ensure product availability and effectively address farmer needs.
By Distribution Channel – Organic Farms Lead, Crop Growers Expected to Grow Fastest
Organic Farms took 42% of distribution channel revenue in 2025, more than any other category. Organic farms lead the distribution channel, reflecting a strong demand for natural solutions in line with sustainable agriculture trends. The increase in the number of organic farms in Japan indicates this growing preference. Crop Growers are projected to grow fastest, at a CAGR of 8.3% during 2026–2032. Crop growers are the fastest-growing channel, as they are the primary consumers of repellents driven by the need for effective pest control. Their heightened reliance on repellents presents a significant market opportunity. Suppliers should concentrate on building strong relationships with crop growers to capitalise on this expanding market segment.
Key Attractiveness of the Report
- 10 Years of Market Numbers
- Historical Data Starting from 2022 to 2025
- Base Year 2025
- Forecast Data until 2032
- Key Performance Indicators Impacting the Market
- Major Upcoming Developments and Projects
Key Highlights of the Report:
- Japan Agricultural Repellents Market Outlook
- Market Size of Japan Agricultural Repellents Market, 2025
- Forecast of Japan Agricultural Repellents Market, 2032
- Historical Data and Forecast of Japan Agricultural Repellents Revenues & Volume for the Period 2022-2032F
- Japan Agricultural Repellents Market Trend Evolution
- Japan Agricultural Repellents Market Drivers and Challenges
- Japan Agricultural Repellents Price Trends
- Japan Agricultural Repellents Porter's Five Forces
- Japan Agricultural Repellents Industry Life Cycle
- Historical Data and Forecast of Japan Agricultural Repellents Market Revenues & Volume By Agricultural Repellents Market for the Period 2022-2032F
- Historical Data and Forecast of Japan Agricultural Repellents Market Revenues & Volume By Natural Repellents for the Period 2022-2032F
- Historical Data and Forecast of Japan Agricultural Repellents Market Revenues & Volume By Chemical Repellents for the Period 2022-2032F
- Historical Data and Forecast of Japan Agricultural Repellents Market Revenues & Volume By Ultrasonic Repellents for the Period 2022-2032F
- Historical Data and Forecast of Japan Agricultural Repellents Market Revenues & Volume By Scent-Based Repellents for the Period 2022-2032F
- Historical Data and Forecast of Japan Agricultural Repellents Market Revenues & Volume By Product Type for the Period 2022-2032F
- Historical Data and Forecast of Japan Agricultural Repellents Market Revenues & Volume By Herbivores for the Period 2022-2032F
- Historical Data and Forecast of Japan Agricultural Repellents Market Revenues & Volume By Insects for the Period 2022-2032F
- Historical Data and Forecast of Japan Agricultural Repellents Market Revenues & Volume By Birds for the Period 2022-2032F
- Historical Data and Forecast of Japan Agricultural Repellents Market Revenues & Volume By Rodents for the Period 2022-2032F
- Historical Data and Forecast of Japan Agricultural Repellents Market Revenues & Volume By Target Type for the Period 2022-2032F
- Historical Data and Forecast of Japan Agricultural Repellents Market Revenues & Volume By Online Platforms for the Period 2022-2032F
- Historical Data and Forecast of Japan Agricultural Repellents Market Revenues & Volume By Agri Retailers for the Period 2022-2032F
- Historical Data and Forecast of Japan Agricultural Repellents Market Revenues & Volume By Direct Sales for the Period 2022-2032F
- Historical Data and Forecast of Japan Agricultural Repellents Market Revenues & Volume By Specialty Stores for the Period 2022-2032F
- Historical Data and Forecast of Japan Agricultural Repellents Market Revenues & Volume By Distribution Channel for the Period 2022-2032F
- Historical Data and Forecast of Japan Agricultural Repellents Market Revenues & Volume By Organic Farms for the Period 2022-2032F
- Historical Data and Forecast of Japan Agricultural Repellents Market Revenues & Volume By Crop Growers for the Period 2022-2032F
- Historical Data and Forecast of Japan Agricultural Repellents Market Revenues & Volume By Horticulture Units for the Period 2022-2032F
- Historical Data and Forecast of Japan Agricultural Repellents Market Revenues & Volume By Grain Storage Sites for the Period 2022-2032F
- Japan Agricultural Repellents Import Export Trade Statistics
- Market Opportunity Assessment By Agricultural Repellents Market
- Market Opportunity Assessment By Product Type
- Market Opportunity Assessment By Target Type
- Market Opportunity Assessment By Distribution Channel
- Japan Agricultural Repellents Top Companies Market Share
- Japan Agricultural Repellents Competitive Benchmarking By Technical and Operational Parameters
- Japan Agricultural Repellents Company Profiles
- Japan Agricultural Repellents Key Strategic Recommendations
Market Covered
The study includes the following segmentation.
By Agricultural Repellents Market
- Natural Repellents
- Chemical Repellents
- Ultrasonic Repellents
- Scent-Based Repellents
By Product Type
- Herbivores
- Insects
- Birds
- Rodents
By Target Type
- Online Platforms
- Agri Retailers
- Direct Sales
- Specialty Stores
By Distribution Channel
- Organic Farms
- Crop Growers
- Horticulture Units
- Grain Storage Sites































