Japan Amusement Machine Market Size & Growth Rate
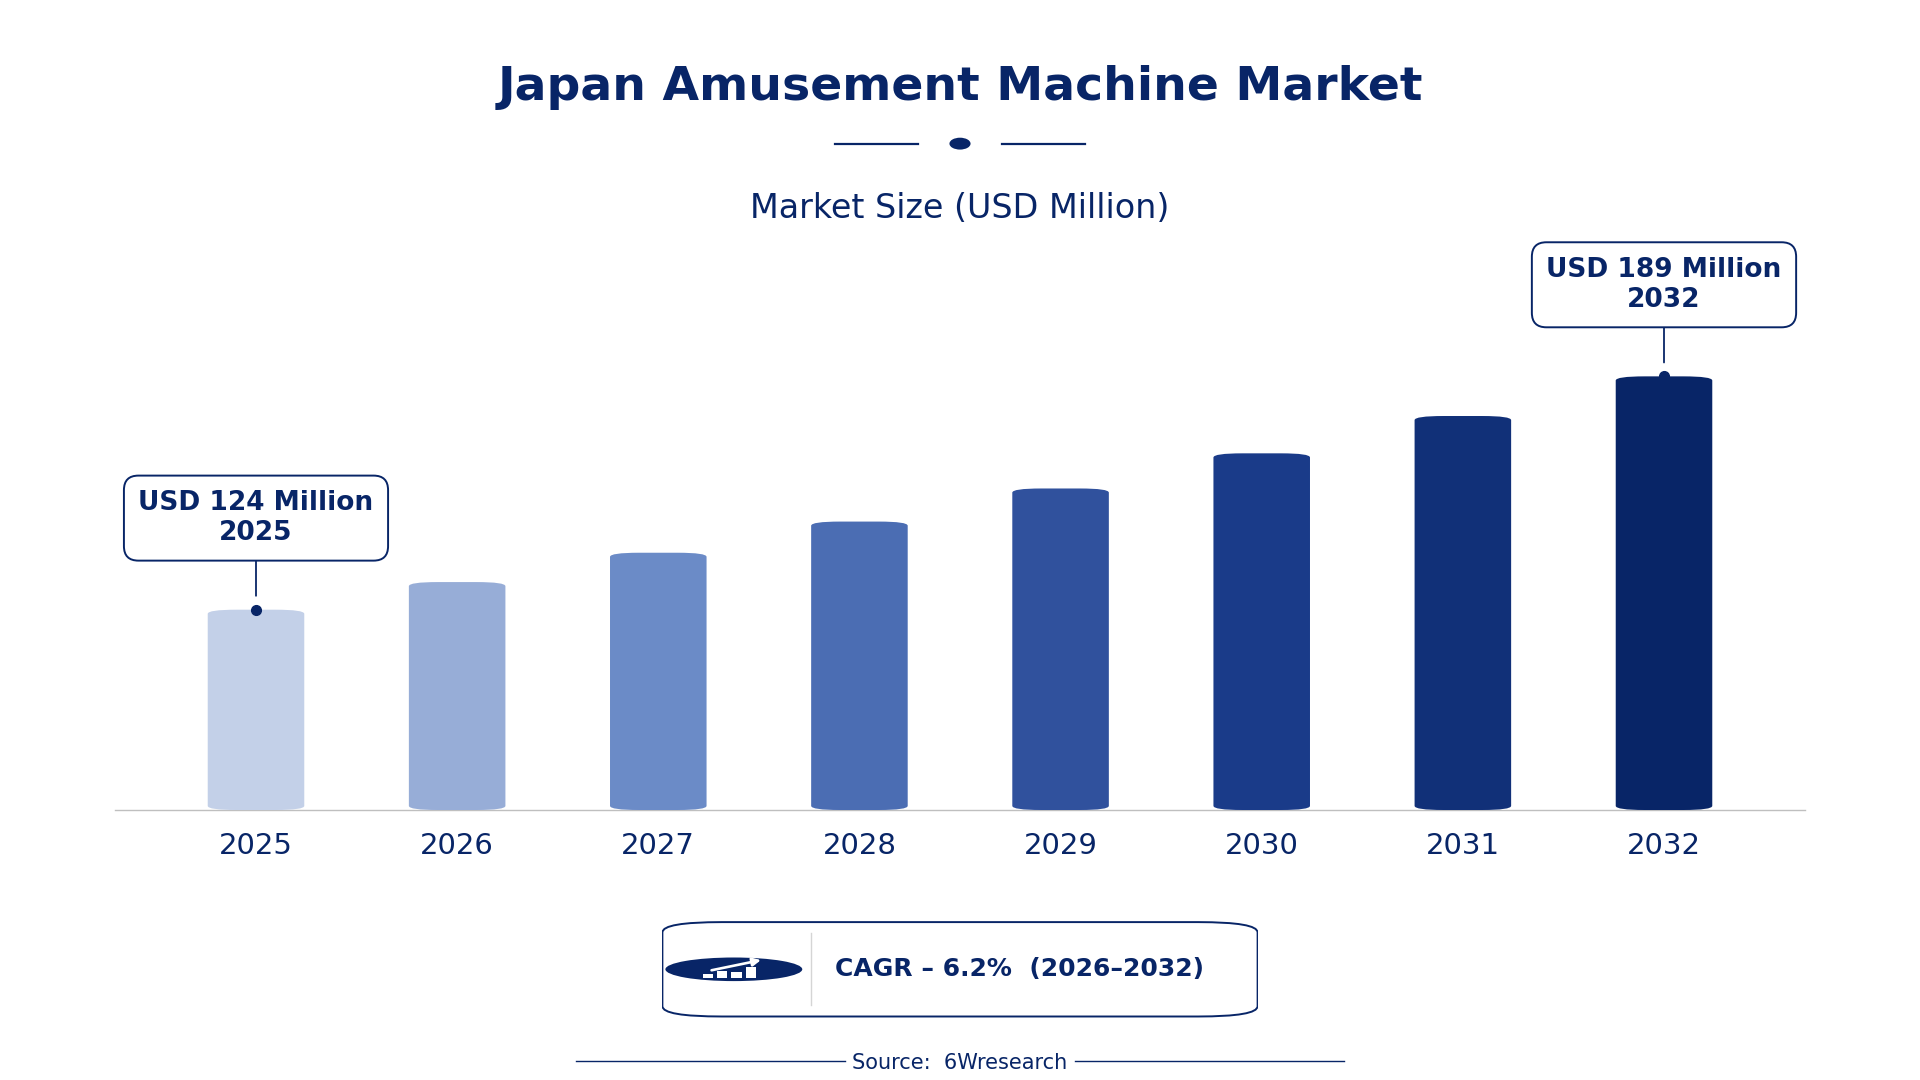
According to 6Wresearch internal database and industry insights, the Japan Amusement Machine Market was valued at USD 124 Million in 2025 and is projected to reach USD 189 Million by 2032, growing at a CAGR of approximately 6.2% during 2026–2032.
Japan Amusement Machine Market Highlights
| Report Metric | Details |
| Report Name | Japan Amusement Machine Market (2026-2032) |
| Market Size 2025 | USD 124 Million |
| Market Size 2032 | USD 189 Million |
| Absolute Growth 2025–2032 | USD 65 Million |
| CAGR 2026–2032 | 6.2% |
| Peak Annual Growth | 7.4% in 2032 |
| Forecast Period | 2026–2032 |
| Historical Data | 2022–2025 |
| Base Year | 2025 |
| Leading Machine Type, 2025 | Arcade Machines (43% share) |
| Leading Functionality, 2025 | Gaming (43% share) |
| Leading Application Area, 2025 | Indoor Entertainment (41% share) |
| Leading Distribution Channel, 2025 | Distributors (43% share) |
| Leading End User, 2025 | Amusement Parks (49% share) |
| Fastest-Growing Machine Type | VR Simulators (8.8% CAGR) |
| Fastest-Growing Functionality | Immersive (8.1% CAGR) |
| Fastest-Growing Application Area | Virtual Experience (7.7% CAGR) |
| Fastest-Growing Distribution Channel | Direct Sales (7.9% CAGR) |
| Fastest-Growing End User | Entertainment Centers (8.2% CAGR) |
| Growing Sector | entertainment centers |
| Key End Users | amusement parks, entertainment centers, visitors |
Japan Amusement Machine Market Year-wise Growth Rate and Key Drivers (2022–2032)
This graph illustrates the annual growth rates of the market from 2022 to 2032, highlighting a steady upward trajectory and projected market expansion over the forecast period.
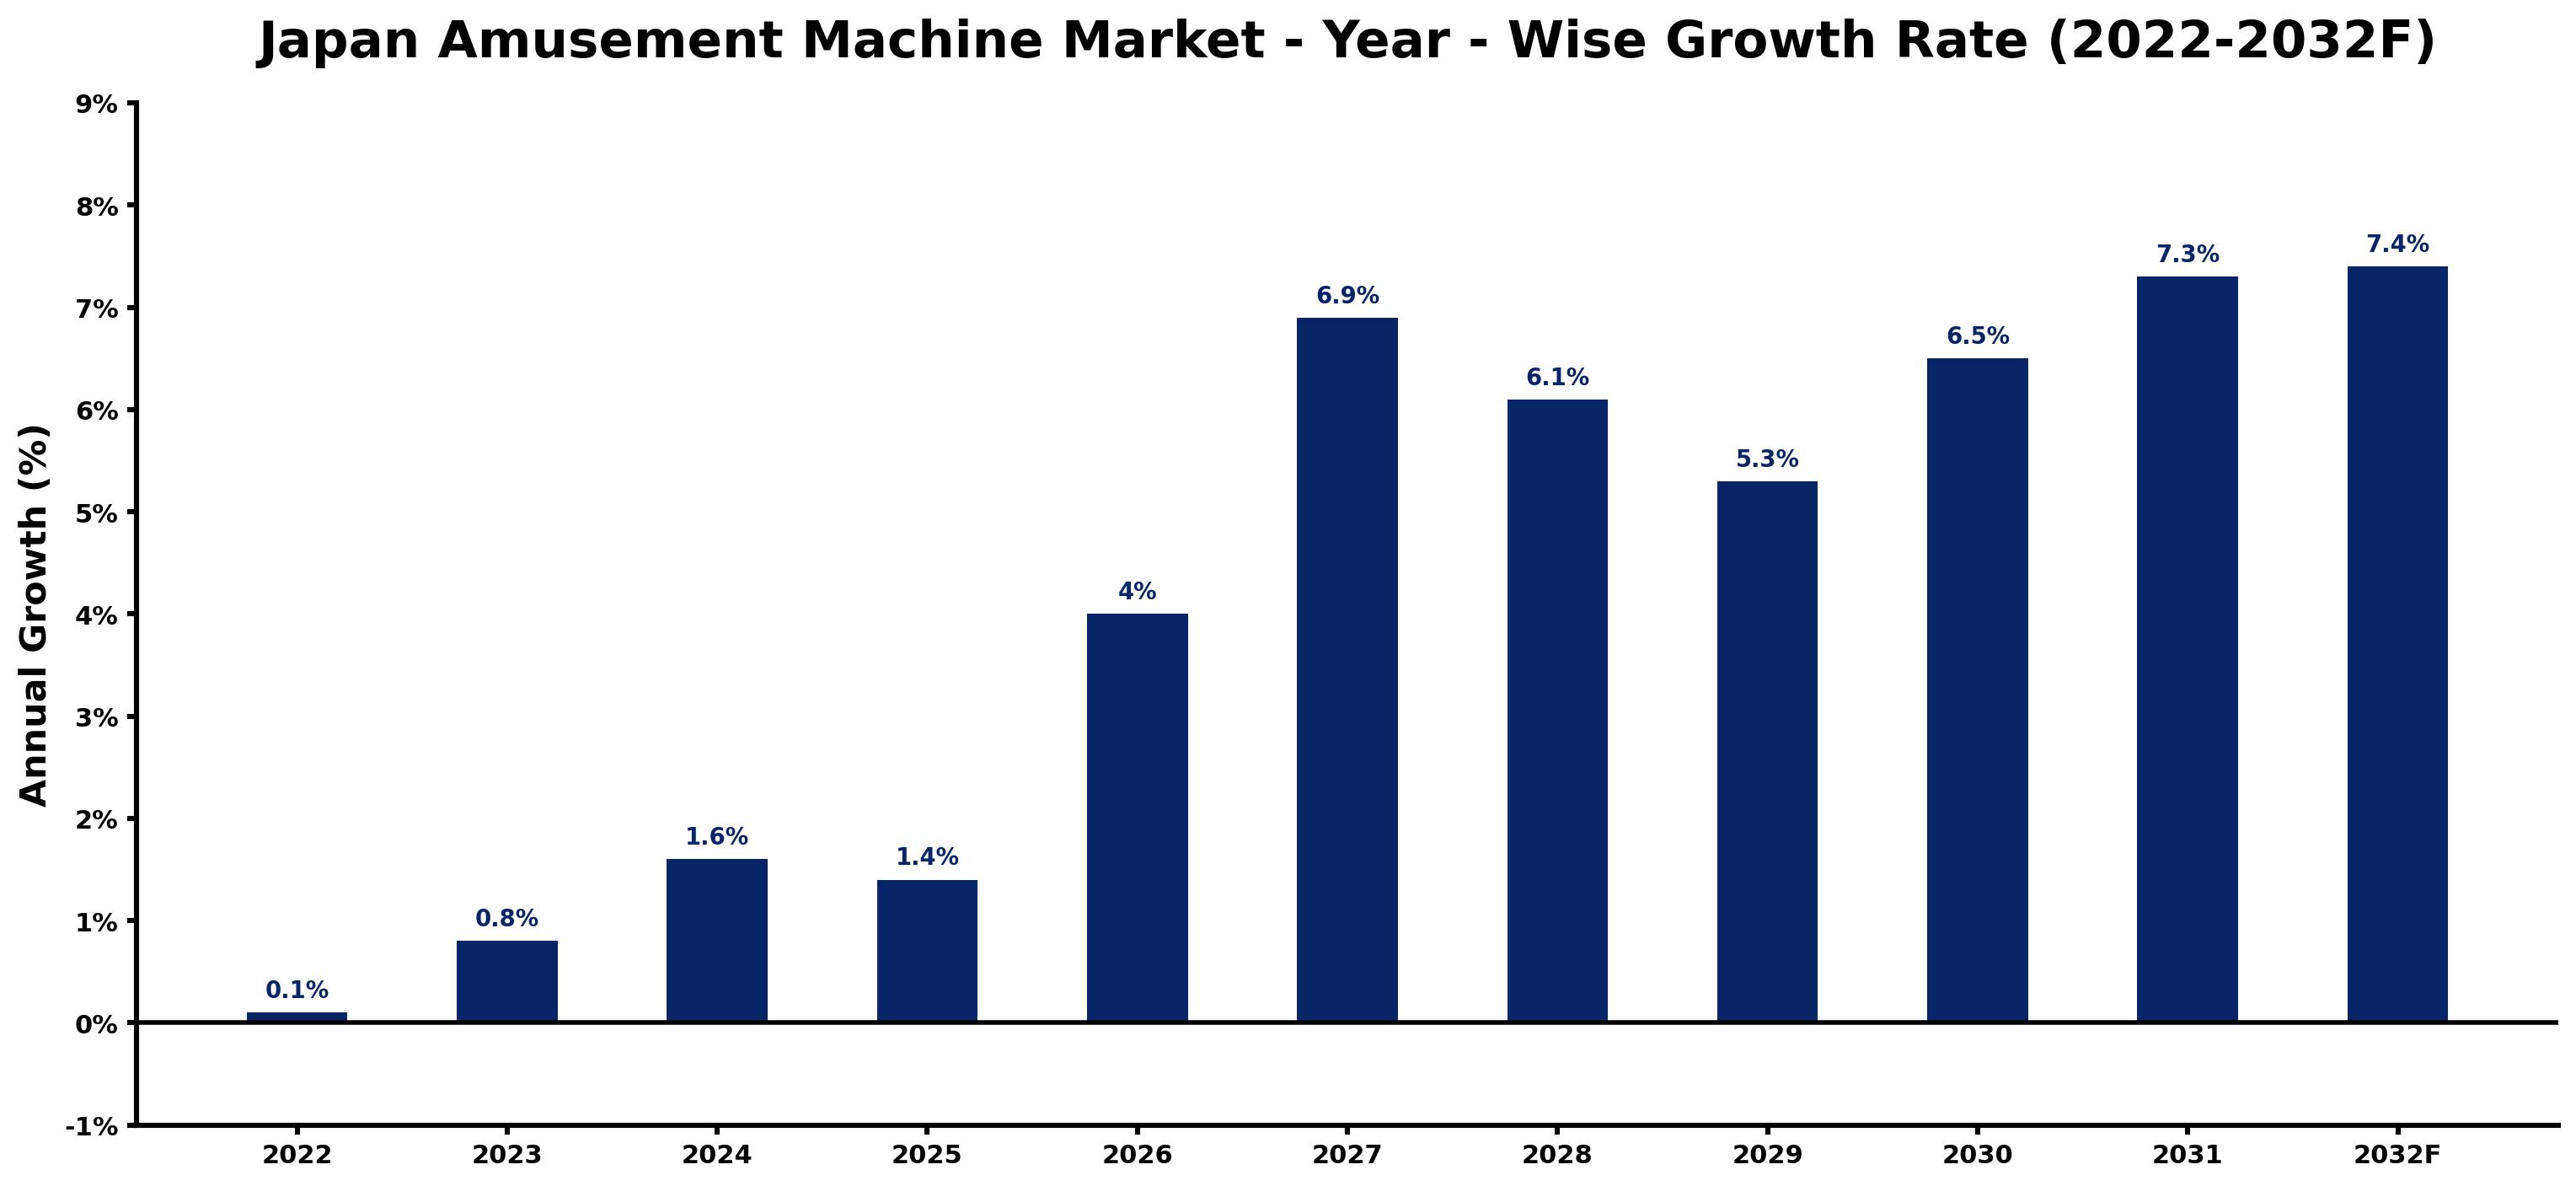
The yearly estimates that follow link every growth rate to its principal driver, so readers can see why the pace changed in each period.
| Year | Estimated Annual Growth (%) | Market Rationale |
| 2022 | 0.1 | The amusement machine market maintained steady activity amid ongoing consumer interest. |
| 2023 | 0.8 | Demand increased as entertainment venues began to recover from restrictions. |
| 2024 | 1.6 | Growth accelerated with the return of tourism and local events boosting foot traffic. |
| 2025 | 1.4 | The growth rate slowed slightly as market saturation began to set in. |
| 2026 | 4.0 | A surge in investments in digital entertainment technologies is expected to drive demand. |
| 2027 | 6.9 | Increased installations of VR simulators in theme parks will improve user experiences. |
| 2028 | 6.1 | Growth is projected to slow as competition intensifies among amusement venues. |
| 2029 | 5.3 | Market expansion is expected to continue as more immersive experiences gain popularity. |
| 2030 | 6.5 | New revenue streams from digital gaming innovations will stimulate further growth. |
| 2031 | 7.3 | The market is set to grow rapidly as consumer spending on entertainment rises. |
| 2032 | 7.4 | Peak growth is anticipated as the market adapts to evolving entertainment trends. |
Note: Market size estimations and growth projections presented in this report are based on 6Wresearch's proprietary forecasting methodology, utilizing the latest available industry data, government publications, and primary research inputs.
Japan Amusement Machine Market Synopsis
Amusement machines are electronic devices designed for entertainment, primarily utilising technology such as software and hardware components. They are widely used in venues like arcades, amusement parks, and entertainment centres. The Japan Amusement Machine Market is growing due to increased domestic spending and a resurgence in tourism. With over 1,000 amusement parks and entertainment centres in Japan, demand is further supported by advancements in digital entertainment technologies, including immersive experiences like VR simulators, which are gaining popularity.
Market Dynamics Impact Analysis (2026–2032)
| Factor | Type | Impact | Primary Segment Affected |
| Increased consumer spending on entertainment activities | Driver | High | Gaming |
| Growing popularity of immersive experiences in entertainment venues | Driver | High | VR Simulators |
| Rising number of visitors to amusement parks and entertainment centers | Opportunity | High | Amusement Parks |
| Expansion of digital entertainment technologies in the market | Opportunity | High | Indoor Entertainment |
| Competition from alternative entertainment options | Restraint | Medium | Arcade Machines |
| High initial investment costs for advanced amusement technologies | Restraint | Medium | VR Simulators |
| Supply chain disruptions affecting machine availability | Challenge | High | Redemption Machines |
| Technological advancements outpacing existing machines | Challenge | Medium | Gaming |
Evaluation of Drivers in Japan Amusement Machine Market (2026–2032)
The main growth drivers and the segments they affect most are set out below.
| Drivers | Primary Segment Affected | Why It Matters (Evidence) |
| Increased domestic consumer spending | Amusement Parks | The average visitor spends about 5,000 JPY on games, driving demand for machines. |
| Technological advancements in gaming experiences | VR Simulators | With installations in over 200 locations, demand for immersive experiences is rising, increasing sales. |
| Growing tourism sector | Entertainment Centers | The return of tourists boosts foot traffic and increases machine usage, leading to higher revenues. |
| Expansion of family entertainment centers | Redemption Machines | These machines account for approximately 30% of total amusement machine sales, indicating strong demand. |
| Rising interest in digital entertainment technologies | Indoor Entertainment | The government launched a program to promote these technologies in 2023, encouraging new investments. |
Much of the new demand traces back to increased domestic consumer spending, with the average visitor to amusement parks spending around 5,000 JPY on games. Installations of VR simulators are rising, with over 200 locations now featuring these machines, increasing user engagement. The recovery of the tourism sector has boosted foot traffic in entertainment venues, resulting in higher machine usage. Family entertainment centers are expanding, and redemption machines are essential, accounting for a significant portion of total sales.
Evaluation of Restraints in Japan Amusement Machine Market
Several factors work against faster growth; the main ones are summarised below.
| Market Restraint | Primary Segment Affected | Why It Matters (Evidence) |
| Competition from alternative entertainment options | Arcade Machines | The rise of streaming services and online gaming diverts attention from traditional arcade machines, impacting sales. |
| High initial investment costs for advanced amusement technologies | VR Simulators | The cost of implementing immersive technologies can deter smaller operators from upgrading, limiting market participation. |
| Supply chain disruptions affecting machine availability | Redemption Machines | Global supply chain issues have delayed the delivery of essential components for machines, impacting sales and availability. |
| Technological advancements outpacing existing machines | Gaming | Rapid innovation leads to shorter lifecycles for machines, necessitating frequent upgrades to maintain competitiveness. |
| Stringent safety regulations impacting production timelines | Indoor Entertainment | Compliance with safety standards can extend the time needed to bring new machines to market, delaying sales. |
Japan Amusement Machine Market Challenges
Rapid advancements in technology create a gap in integrating modern features into amusement machines, limiting choices for buyers in entertainment venues. Supply chain disruptions, worsened by recent global events, result in delays in acquiring critical components, extending production timelines for manufacturers. Rising material costs, driven by inflationary pressures, compel suppliers to raise prices, squeezing profit margins for operators. Increased competition among amusement venues leads to price wars, making it challenging for smaller players to maintain profitability in a saturated market.
Trends in the Japan Amusement Machine Market
The following changes are redrawing the Japan Amusement Machine Market.
- Shift from Traditional to Immersive Gaming: The amusement machine market is shifting towards immersive gaming experiences, particularly with the rise of VR simulators. In 2023, over 200 locations across Japan installed these machines, increasing visitor engagement.
- Transition from Physical to Digital Entertainment: The year 2023 marked a notable transition as digital entertainment technologies gained prominence in amusement venues. This change is reflected in the growing number of installations of self-service ticketing machines in major theme parks, improving operational efficiency.
- Emergence of Family Entertainment Centers: Family entertainment centres are increasingly popular venues for amusement machines. In 2022, these centres accounted for a significant portion of machine sales, particularly redemption machines, which represent about 30% of total sales.
- Prioritisation of Safety in Amusement Machine Production: Safety standards have become a priority in amusement machine production, with the JIS Z 8401 standard widely adopted. Compliance ensures that machines meet strict safety regulations, impacting manufacturers' operational processes.
Investment Opportunities in the Japan Amusement Machine Market
Where to invest in the Japan Amusement Machine Market: the main openings are set out below.
- Growing Demand for Immersive Experiences: With the Japanese gaming market valued at over 1 trillion JPY, there is a notable gap in immersive gaming experiences. Suppliers can focus on VR simulators, partnering with entertainment centres to meet this demand.
- Expansion of Self-Service Ticketing Solutions: The market for self-service ticketing machines is expanding, particularly in major theme parks. Suppliers can enter this segment by establishing joint ventures with local operators to provide effective solutions.
- Investment in Digital Entertainment Technologies: The government's 2023 programme to promote digital entertainment technologies presents a promising opportunity. Companies can invest in developing new amusement machines that align with this initiative, targeting amusement parks and entertainment centres.
- Increased Foot Traffic in Amusement Parks: As the number of visitors to amusement parks rises, there is a growing need for new machines. Suppliers should focus on providing high-demand gaming and redemption machines to capitalise on this trend.
Government Initiatives in the Japan Amusement Machine Market
The Industrial Safety and Health Act (1972) mandates strict safety regulations for amusement machines, ensuring that producers meet essential safety standards before market entry. Compliance with these regulations is crucial for manufacturers, as it affects their ability to operate legally and maintain consumer trust. Additionally, the New Robot Strategy (2015) encourages the integration of robotics in manufacturing processes, which can improve production efficiency and innovation within the amusement machine sector.
In 2023, the Ministry of Economy, Trade and Industry initiated a subsidy programme allocating JPY 5 billion to support the development of innovative amusement technologies. This funding aims to assist manufacturers in upgrading their product offerings and improving operational capabilities. The Japan Amusement Machine Association oversees compliance with industry standards, ensuring that funded projects align with regulatory requirements and market needs.
Future Insight of the Japan Amusement Machine Market
Investment in digital entertainment technologies will drive demand for advanced amusement machines, particularly in urban centres. The government's subsidy programme for advanced amusement technologies will motivate suppliers to develop cutting-edge products. With over 10 million arcade machines sold annually, the need for enhanced gaming experiences will increase. The adoption of safety standards like ISO 9001 will elevate quality assurance, ensuring buyers receive more dependable and efficient machines.
Market Segmentation Analysis
Japan Amusement Machine Market report covers a detailed analysis of the following market segments:
By Machine Type – Arcade Machines Lead, VR Simulators Expected to Grow Fastest
According to Vasu Joshi, Associate Consultant at 6Wresearch, Arcade Machines accounted for 43% of the market by machine type in 2025. Arcade machines hold the largest market share due to their extensive use in entertainment venues, with over 10 million units sold annually. Their popularity is particularly pronounced in major urban areas such as Tokyo and Osaka, where they attract a diverse audience. VR Simulators are set to record the highest CAGR in this split, 8.8% over 2026–2032. The growth of VR simulators is fuelled by their immersive experiences, with installations exceeding 200 locations across the country. This trend indicates a shift towards engaging entertainment options that resonate with younger demographics. Suppliers need to prioritise the development of VR technologies to align with the increasing consumer preference for immersive gaming.
By Functionality – Gaming Leads, Immersive Expected to Grow Fastest
The largest functionality category in 2025 was Gaming, at 43% of revenue. Gaming functionality is essential to most amusement machines, making it the leading segment in Japan's market. The engagement of around 15 million arcade game players illustrates the strong demand for interactive entertainment experiences. Immersive is projected to grow fastest, at a CAGR of 8.1% during 2026–2032. Immersive functionality is rapidly gaining popularity, particularly in VR and simulation experiences, as consumers increasingly seek engaging forms of entertainment. The government's initiatives to promote digital entertainment technologies are likely to further accelerate this segment's growth. Manufacturers must invest in immersive technologies to stay competitive in this evolving market.
By Application Area – Indoor Entertainment Leads, Virtual Experience Expected to Grow Fastest
With 41% of application area revenue in 2025, Indoor Entertainment was the largest category. Indoor entertainment is the primary application area for amusement machines, with numerous venues dedicated to this purpose across Japan. The presence of over 1,000 amusement parks and entertainment centres highlights the robust demand for indoor entertainment options. The quickest growth will come from Virtual Experience, forecast to expand at a CAGR of 7.7% between 2026 and 2032. The virtual experience segment is expanding quickly, driven by technological advancements and consumer interest in immersive environments. This trend is evident in the increasing installations of VR simulators in various locations nationwide. Investing in virtual experience technologies will be crucial for suppliers aiming to meet changing consumer preferences.
By Distribution Channel – Distributors Lead, Direct Sales Expected to Grow Fastest
Distributors took 43% of distribution channel revenue in 2025, more than any other category. Distributors are vital for supplying amusement machines to various venues, ensuring that products reach a broad audience. Their established networks facilitate the distribution of popular gaming machines across Japan, enhancing market penetration. Over 2026–2032, Direct Sales is expected to post the fastest growth, at a CAGR of 7.9%. Direct sales are becoming more popular among manufacturers as a method to engage customers directly, allowing for tailored offerings and improved customer relationships. This trend indicates a shift towards more personalised sales strategies in the industry. Suppliers should strengthen their direct sales approaches to enhance customer connections and increase sales.
By End User – Amusement Parks Lead, Entertainment Centers Expected to Grow Fastest
Amusement Parks held 49% of the Japan Amusement Machine Market by end user in 2025. Amusement parks are major end-users of amusement machines, utilising them to attract guests and enrich the entertainment experience. Their substantial investment in gaming options underscores their critical role in the amusement machine market. Entertainment Centers are set to record the highest CAGR in this split, 8.2% over 2026–2032. Entertainment centers are quickly adopting a variety of amusement machines, reflecting a trend towards diverse entertainment offerings. This shift aligns with consumer demand for varied experiences in leisure venues, increasing their appeal. Suppliers should focus on entertainment centers to capitalise on the rising demand for diverse amusement options.
Key Attractiveness of the Report
- 10 Years of Market Numbers
- Historical Data Starting from 2022 to 2025
- Base Year 2025
- Forecast Data until 2032
- Key Performance Indicators Impacting the Market
- Major Upcoming Developments and Projects
Key Highlights of the Report:
- Japan Amusement Machine Market Outlook
- Market Size of Japan Amusement Machine Market, 2025
- Forecast of Japan Amusement Machine Market, 2032
- Historical Data and Forecast of Japan Amusement Machine Market Revenues & Volume for the Period 2022-2032F
- Japan Amusement Machine Market Trend Evolution
- Japan Amusement Machine Market Drivers and Challenges
- Japan Amusement Machine Market Price Trends
- Japan Amusement Machine Market Porter's Five Forces
- Japan Amusement Machine Market Industry Life Cycle
- Historical Data and Forecast of Japan Amusement Machine Market Revenues & Volume By Machine Type for the Period 2022-2032F
- Historical Data and Forecast of Japan Amusement Machine Market Revenues & Volume By Arcade Machines for the Period 2022-2032F
- Historical Data and Forecast of Japan Amusement Machine Market Revenues & Volume By VR Simulators for the Period 2022-2032F
- Historical Data and Forecast of Japan Amusement Machine Market Revenues & Volume By Redemption Machines for the Period 2022-2032F
- Historical Data and Forecast of Japan Amusement Machine Market Revenues & Volume By Ticketing Machines for the Period 2022-2032F
- Historical Data and Forecast of Japan Amusement Machine Market Revenues & Volume By Functionality for the Period 2022-2032F
- Historical Data and Forecast of Japan Amusement Machine Market Revenues & Volume By Gaming for the Period 2022-2032F
- Historical Data and Forecast of Japan Amusement Machine Market Revenues & Volume By Immersive for the Period 2022-2032F
- Historical Data and Forecast of Japan Amusement Machine Market Revenues & Volume By Prize-based for the Period 2022-2032F
- Historical Data and Forecast of Japan Amusement Machine Market Revenues & Volume By Self-service for the Period 2022-2032F
- Historical Data and Forecast of Japan Amusement Machine Market Revenues & Volume By Application Area for the Period 2022-2032F
- Historical Data and Forecast of Japan Amusement Machine Market Revenues & Volume By Indoor Entertainment for the Period 2022-2032F
- Historical Data and Forecast of Japan Amusement Machine Market Revenues & Volume By Virtual Experience for the Period 2022-2032F
- Historical Data and Forecast of Japan Amusement Machine Market Revenues & Volume By Casinos & Arcades for the Period 2022-2032F
- Historical Data and Forecast of Japan Amusement Machine Market Revenues & Volume By Theme Parks for the Period 2022-2032F
- Historical Data and Forecast of Japan Amusement Machine Market Revenues & Volume By Distribution Channel for the Period 2022-2032F
- Historical Data and Forecast of Japan Amusement Machine Market Revenues & Volume By Distributors for the Period 2022-2032F
- Historical Data and Forecast of Japan Amusement Machine Market Revenues & Volume By Dealers for the Period 2022-2032F
- Historical Data and Forecast of Japan Amusement Machine Market Revenues & Volume By Direct Sales for the Period 2022-2032F
- Historical Data and Forecast of Japan Amusement Machine Market Revenues & Volume By OEMs for the Period 2022-2032F
- Historical Data and Forecast of Japan Amusement Machine Market Revenues & Volume By End User for the Period 2022-2032F
- Historical Data and Forecast of Japan Amusement Machine Market Revenues & Volume By Amusement Parks for the Period 2022-2032F
- Historical Data and Forecast of Japan Amusement Machine Market Revenues & Volume By Theme Parks for the Period 2022-2032F
- Historical Data and Forecast of Japan Amusement Machine Market Revenues & Volume By Entertainment Centers for the Period 2022-2032F
- Historical Data and Forecast of Japan Amusement Machine Market Revenues & Volume By Visitors for the Period 2022-2032F
- Japan Amusement Machine Market Import Export Trade Statistics
- Market Opportunity Assessment By Machine Type
- Market Opportunity Assessment By Functionality
- Market Opportunity Assessment By Application Area
- Market Opportunity Assessment By Distribution Channel
- Market Opportunity Assessment By End User
- Japan Amusement Machine Market Top Companies Market Share
- Japan Amusement Machine Market Competitive Benchmarking By Technical and Operational Parameters
- Japan Amusement Machine Market Company Profiles
- Japan Amusement Machine Market Key Strategic Recommendations
Market Covered
The following segment groups are covered in the report.
By Machine Type
- Arcade Machines
- VR Simulators
- Redemption Machines
- Ticketing Machines
By Functionality
- Gaming
- Immersive
- Prize-based
- Self-service
By Application Area
- Indoor Entertainment
- Virtual Experience
- Casinos & Arcades
- Theme Parks
By Distribution Channel
- Distributors
- Dealers
- Direct Sales
- OEMs
By End User
- Amusement Parks
- Theme Parks
- Entertainment Centers
- Visitors































