Japan Indoor Amusement Center Market Size & Growth Rate
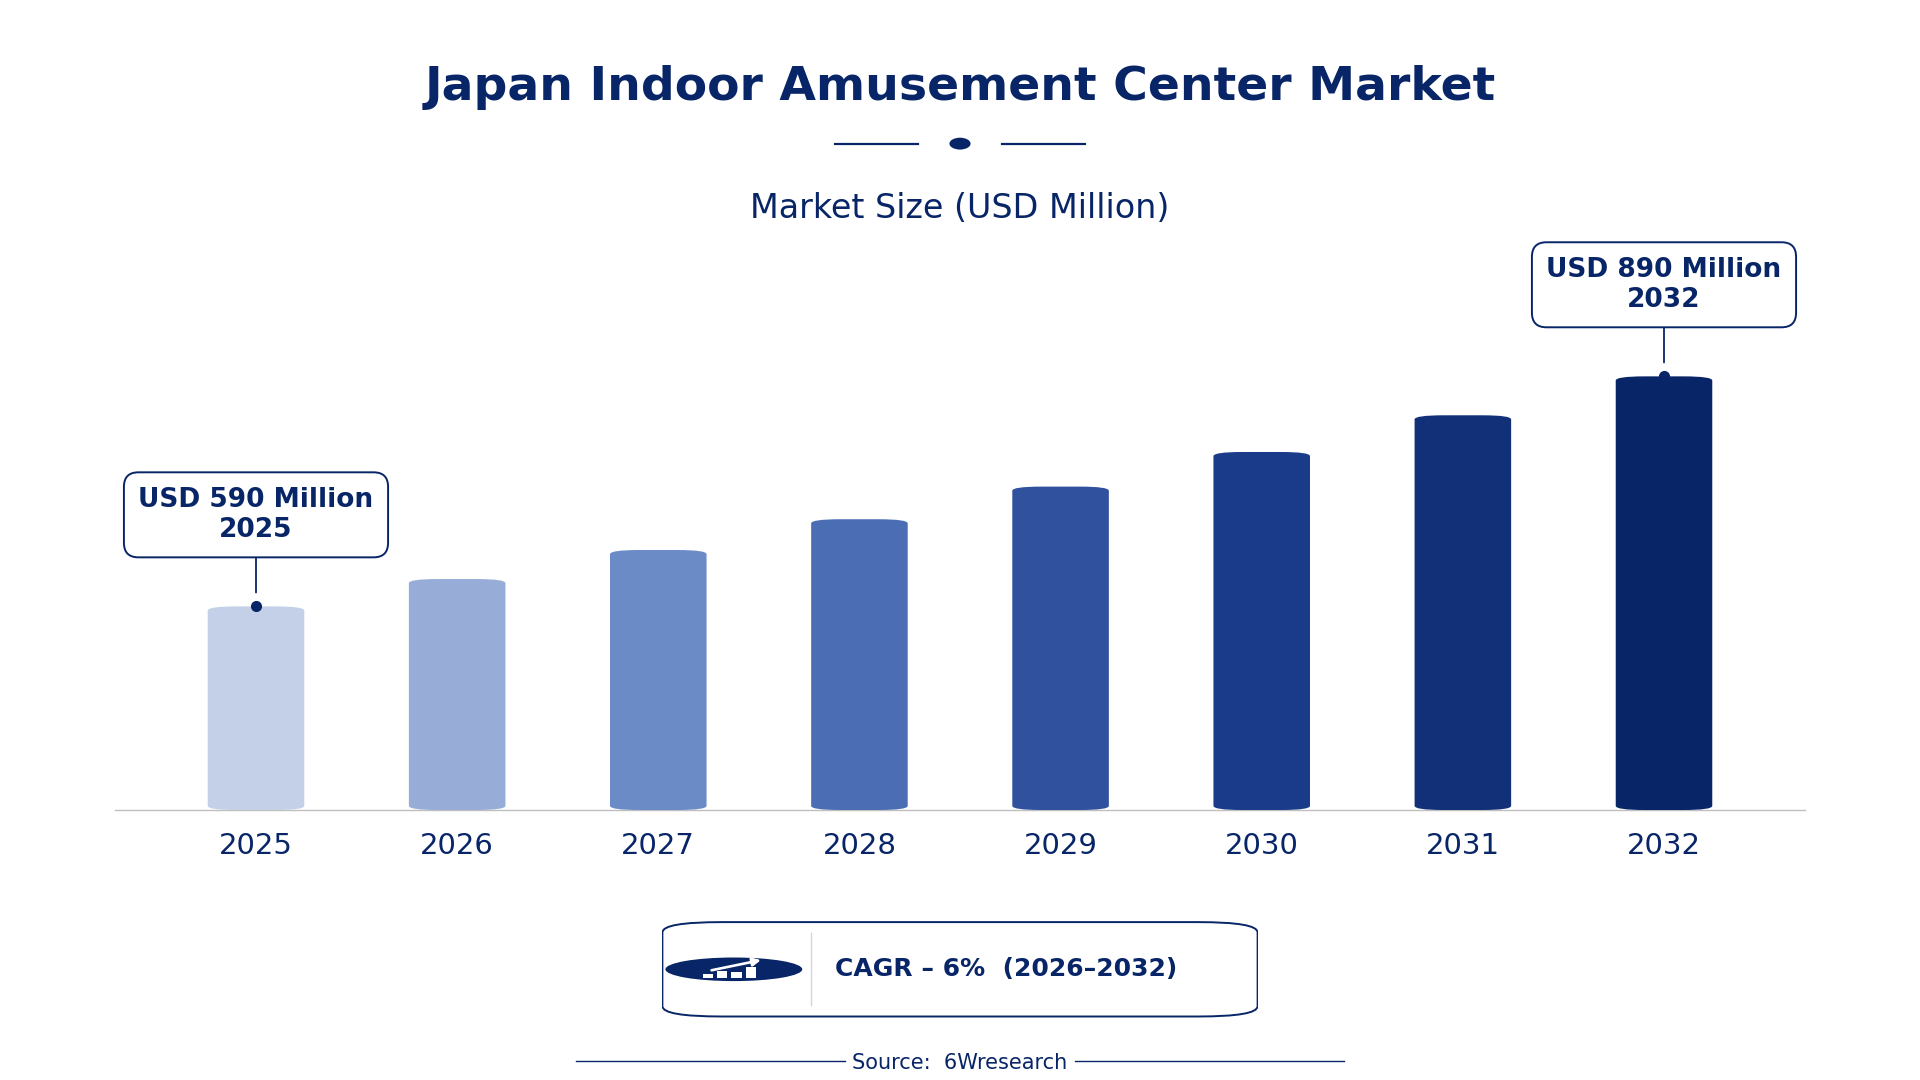
According to 6Wresearch internal database and industry insights, the Japan Indoor Amusement Center Market was valued at USD 590 Million in 2025 and is projected to reach USD 890 Million by 2032, growing at a CAGR of approximately 6% during 2026–2032.
Japan Indoor Amusement Center Market Highlights
| Report Metric | Details |
| Report Name | Japan Indoor Amusement Center Market (2026-2032) |
| Market Size 2025 | USD 590 Million |
| Market Size 2032 | USD 890 Million |
| Absolute Growth 2025–2032 | USD 300 Million |
| CAGR 2026–2032 | 6% |
| Peak Annual Growth | 8.9% in 2032 |
| Forecast Period | 2026–2032 |
| Historical Data | 2022–2025 |
| Base Year | 2025 |
| Leading Attraction Type, 2025 | Trampoline Parks (38% share) |
| Leading Age Group, 2025 | Children (32% share) |
| Leading Facility Type, 2025 | Standalone Centers (42% share) |
| Leading Revenue Model, 2025 | Ticket Sales (47% share) |
| Leading End User, 2025 | Families (53% share) |
| Fastest-Growing Attraction Type | VR Gaming (8.5% CAGR) |
| Fastest-Growing Age Group | Youth (7.9% CAGR) |
| Fastest-Growing Facility Type | Mall-based (7.8% CAGR) |
| Fastest-Growing Revenue Model | Subscription (8.1% CAGR) |
| Fastest-Growing End User | Teenagers (8.0% CAGR) |
| Growing Sector | Family entertainment |
| Key End Users | Families, Youth, General Public, Parents |
Japan Indoor Amusement Center Market Year-wise Growth Rate and Key Drivers (2022–2032)
This graph illustrates the annual growth rates of the market from 2022 to 2032, highlighting a steady upward trajectory and projected market expansion over the forecast period.
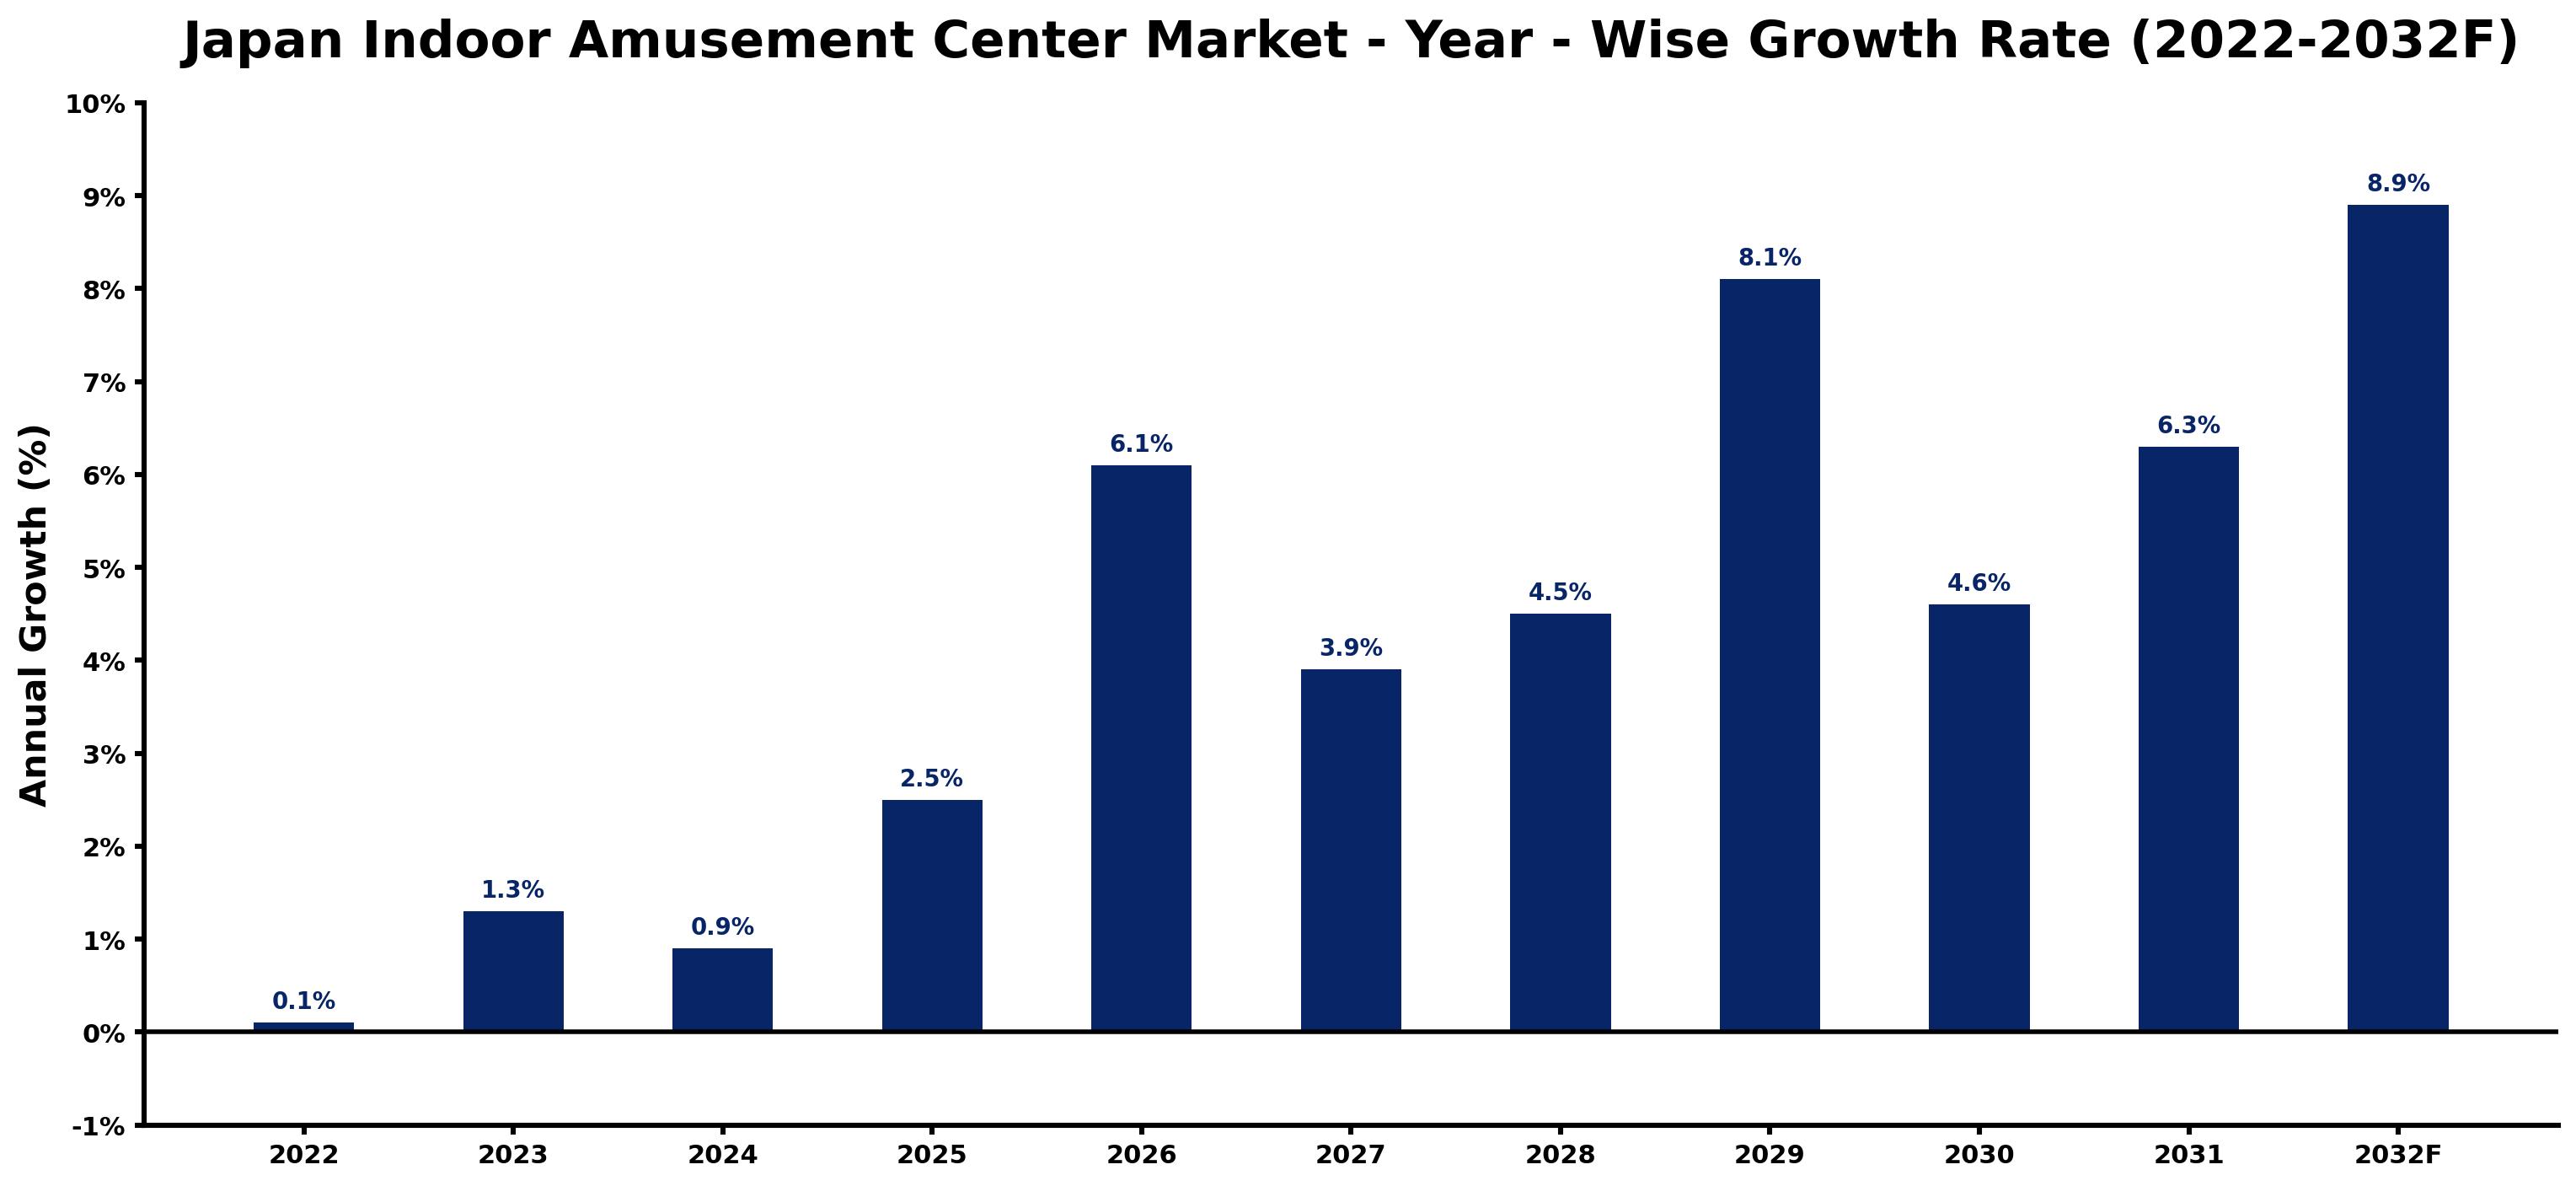
Annual growth estimates for each year appear below with the principal reason behind them, explaining the shifts that set the pace of the market.
| Year | Estimated Annual Growth (%) | Market Rationale |
| 2022 | 0.1 | The market showed minimal growth due to limited consumer spending. |
| 2023 | 1.3 | Growth accelerated as families sought more recreational options. |
| 2024 | 0.9 | The market experienced slower growth as competition intensified among facilities. |
| 2025 | 2.5 | Demand increased with the rise of trampoline parks attracting families. |
| 2026 | 6.1 | Growth surged as VR gaming gained popularity among youth demographics. |
| 2027 | 3.9 | The market slowed slightly as saturation in popular attractions occurred. |
| 2028 | 4.5 | Demand picked up again with new indoor parks opening in urban areas. |
| 2029 | 8.1 | Growth accelerated as trampoline parks hosted competitive events, attracting local youth. |
| 2030 | 4.6 | The market experienced a slowdown as operational costs rose for centers. |
| 2031 | 6.3 | Demand rose again as families returned to indoor entertainment options. |
| 2032 | 8.9 | The market peaked as new attractions and experiences were introduced. |
Note: Market size estimations and growth projections presented in this report are based on 6Wresearch's proprietary forecasting methodology, utilizing the latest available industry data, government publications, and primary research inputs.
Japan Indoor Amusement Center Market Synopsis
Indoor amusement centers in Japan provide a variety of recreational activities, including rides and games, primarily aimed at families. The Japan Indoor Amusement Center Market is growing due to increasing demand from domestic users, especially children and youth seeking engaging experiences. The launch of new attractions, such as VR gaming and trampoline parks, is propelling growth, with over 300 centers nationwide focusing on family-friendly entertainment options.
Market Dynamics Impact Analysis (2026–2032)
| Factor | Type | Impact | Primary Segment Affected |
| Rising popularity of trampoline parks among children | Driver | High | Trampoline Parks |
| Increased interest in immersive experiences from youth | Driver | High | VR Gaming |
| Growing demand for family-friendly entertainment options | Opportunity | High | Families |
| Expansion of indoor parks in urban areas | Opportunity | Medium | Indoor Parks |
| High operational costs affecting profitability | Restraint | High | Standalone Centers |
| Intense competition among entertainment facilities | Restraint | Medium | Mall-based |
| Rising costs of materials for construction and maintenance | Challenge | High | All Ages |
| Difficulty in attracting repeat visitors | Challenge | Medium | General Public |
Evaluation of Drivers in Japan Indoor Amusement Center Market (2026–2032)
Key forces behind demand, with the segment each one moves most, are listed below.
| Drivers | Primary Segment Affected | Why It Matters (Evidence) |
| Increased family outings to recreational facilities | Families | The average family spends about 5,000 JPY per visit, driving demand for diverse attractions. |
| Popularity of competitive events in trampoline parks | Trampoline Parks | Trampoline parks host events that boost participation, attracting local youth, increasing attendance by 25%. |
| Growth in immersive VR gaming experiences | VR Gaming | The immersive nature of VR appeals to younger audiences, increasing their attendance by 20%. |
| Expansion of entertainment zones in urban areas | Entertainment Zones | Urban planning initiatives support development, improving visitor experiences and increasing foot traffic. |
| Adoption of subscription models for memberships | Subscription | Some centers report 20% of revenue from memberships, encouraging repeat visits. |
The strongest pull on demand comes from the average family spending about 5,000 JPY on visits, which drives increased foot traffic to indoor amusement centers. The popularity of competitive events in trampoline parks attracts local youth, leading to higher participation rates, with attendance increasing by 25%. The immersive experiences offered by VR gaming appeal to younger audiences, resulting in a surge in attendance, with engagement rising by 20%. Urban planning efforts promoting entertainment zones improve visitor experiences, while the adoption of subscription models allows centers to secure 20% of their revenue from memberships, encouraging repeat patronage.
Evaluation of Restraints in Japan Indoor Amusement Center Market
These are the pressures that could keep growth below its potential.
| Market Restraint | Primary Segment Affected | Why It Matters (Evidence) |
| High operational costs affecting profitability | Standalone Centers | Rising costs of maintenance and staffing are squeezing profit margins for operators. |
| Intense competition among entertainment facilities | Mall-based | Increased competition has resulted in price wars, impacting revenue for operators. |
| Challenges in attracting repeat visitors | All Ages | Facilities struggle to maintain visitor interest, resulting in fluctuating attendance. |
| Rising costs of materials for construction and maintenance | Indoor Parks | Increased material costs limit expansion and renovation budgets for centers. |
| Limited space in urban areas for new developments | Entertainment Zones | Urban planning restrictions hinder the establishment of new facilities. |
Japan Indoor Amusement Center Market Challenges
High ticket prices, averaging 1,500 JPY, deter families from visiting indoor amusement centers frequently, reducing overall attendance. Competition among over 300 centers in Japan results in aggressive pricing, which can lead to compromised quality in attractions, affecting visitor satisfaction. Producers face rising material costs that threaten their ability to maintain safety standards, increasing liability risks for operators. Regulatory requirements from the Japan Amusement Association can delay new facility openings, causing lost revenue opportunities for investors during lengthy approval processes.
Trends in the Japan Indoor Amusement Center Market
The shifts below are changing how Japan Indoor Amusement Center Market products are bought and supplied.
- Shift towards immersive experiences in entertainment: Tokyo is experiencing a shift towards immersive experiences, particularly in VR gaming, with centers reporting a 15% increase in visitors since 2022.
- Transition from traditional arcade games to VR gaming: Since 2023, many centers have begun replacing traditional arcade games with VR gaming options, resulting in a 20% rise in engagement among youth.
- Emergence of competitive events in trampoline parks: In 2023, trampoline parks started hosting competitive events, attracting local youth and increasing participation by 25%.
- Growth of subscription models in indoor amusement centers: The trend towards subscription models has gained traction, with some centers reporting a 20% revenue share from memberships in 2023.
Investment Opportunities in the Japan Indoor Amusement Center Market
Investors looking at the Japan Indoor Amusement Center Market should consider the following areas.
- Timing for family-friendly entertainment: With approximately 12 million individuals under 15 years old in Japan, there is a chance to invest in family-oriented attractions in urban areas, targeting this demographic.
- Growing interest from families: Investing in facilities that focus on family entertainment can yield substantial returns, as families seek engaging recreational options, particularly in major cities.
- Expansion of indoor parks in urban areas: Urban areas are experiencing a surge in demand for indoor parks, creating opportunities for new developments that integrate various attractions, improving visitor experiences.
- Increased demand for subscription services: With some centers reporting 20% of revenue from memberships, investing in subscription models can draw repeat visitors and ensure consistent income.
Government Initiatives in the Japan Indoor Amusement Center Market
The Industrial Standardization Act governs product and test standards, ensuring safety and quality in indoor amusement centers. Compliance with ISO 20121 is essential for sustainable event management, which is increasingly required by consumers seeking responsible entertainment options. The Japan Amusement Association oversees regulations and standards for the industry, ensuring compliance with safety measures. The Ministry of Economy, Trade and Industry supports initiatives for entertainment industry growth, funding projects that promote family-friendly entertainment options, with a target of JPY 150 trillion in public-private investment over 10 years.
The Japan Amusement Association oversees regulations and standards for the industry, ensuring compliance with safety measures. The Ministry of Economy, Trade and Industry supports initiatives for entertainment industry growth, funding projects that promote family-friendly entertainment options, benefiting local amusement centers and enhancing their offerings.
Future Insight of the Japan Indoor Amusement Center Market
New family-friendly entertainment centres are anticipated by 2032, driven by government initiatives that promote the development of recreational spaces. Advanced attractions will emerge to cater to changing consumer preferences, particularly among younger audiences. The population under 15 years old is projected to remain around 12 million, sustaining demand for family-oriented activities. Subscription models are expected to expand, providing operators with a stable revenue stream as they adapt to evolving market conditions.
Market Segmentation Analysis
Japan Indoor Amusement Center Market report covers a detailed analysis of the following market segments:
By Attraction Type – Trampoline Parks Lead, VR Gaming Expected to Grow Fastest
According to Prakhar Dixit, Senior Research Analyst at 6Wresearch, Trampoline Parks took 38% of attraction type revenue in 2025, more than any other category. Trampoline parks hold the largest share due to their appeal to families seeking physical activities. They are popular for hosting events and competitions, particularly among children aged 6-12, which drives consistent attendance. The quickest growth will come from VR Gaming, forecast to expand at a CAGR of 8.5% between 2026 and 2032. VR gaming is experiencing rapid growth as it offers immersive experiences that resonate with younger audiences. The increasing integration of virtual reality in attractions is attracting more visitors, particularly in urban areas. Suppliers should focus on developing diverse VR offerings to capture the growing youth market.
By Age Group – Children Leads, Youth Expected to Grow Fastest
With 32% of age group revenue in 2025, Children was the largest category. Children hold the largest share as they are the primary target audience for many attractions. With approximately 12 million individuals under 15 years old in Japan, this demographic plays a crucial role in driving footfall to indoor amusement centers. Youth is projected to grow fastest, at a CAGR of 7.9% during 2026–2032. Youth are experiencing rapid growth as they increasingly seek thrilling experiences and gaming options. Their strong interest in social activities and interactive technologies is significantly accelerating the expansion of this segment. Suppliers should focus on creating engaging experiences tailored to youth interests to drive attendance.
By Facility Type – Standalone Centers Lead, Mall-based Expected to Grow Fastest
The largest facility type category in 2025 was Standalone Centers, at 42% of revenue. Standalone centers dominate the market as they are specifically designed for entertainment, offering a diverse range of attractions. Their dedicated nature appeals to families and groups looking for comprehensive recreational options, ensuring a steady flow of visitors. Mall-based is set to record the highest CAGR in this split, 7.8% over 2026–2032. Mall-based facilities are witnessing rapid growth due to their advantageous locations within shopping complexes, which naturally attract foot traffic. The combination of shopping and entertainment enhances their appeal, making them a preferred choice for visitors. Operators should explore collaborations with malls to capitalise on increased foot traffic and visibility.
By Revenue Model – Ticket Sales Leads, Subscription Expected to Grow Fastest
In 2025, Ticket Sales led the revenue model split with a 47% share. Ticket sales are the primary revenue source, accounting for a substantial portion of income for indoor amusement centers. This model is straightforward and widely accepted by visitors, ensuring steady cash flow. Over 2026–2032, Subscription is expected to post the fastest growth, at a CAGR of 8.1%. Subscription models are gaining traction as they offer loyalty benefits and encourage repeat visits. Some centers report that up to 20% of their revenue now comes from memberships, indicating a shift in consumer behaviour. Providers should explore subscription options to increase customer retention and revenue stability.
By End User – Families Lead, Teenagers Expected to Grow Fastest
Families held 53% of the Japan Indoor Amusement Center Market by end user in 2025. Families represent the largest user group as indoor amusement centers cater to all ages, making them ideal for family outings. Their preference for shared experiences drives high attendance rates across these facilities, solidifying their market position. The quickest growth will come from Teenagers, forecast to expand at a CAGR of 8.0% between 2026 and 2032. Teenagers are the fastest-growing segment, actively engaging in gaming and social activities within these centers. Their desire for group outings and participation in competitive events is significantly boosting overall attendance and engagement. Targeted marketing strategies aimed at teenagers can effectively increase visitor numbers and enhance overall engagement.
Key Attractiveness of the Report
- 10 Years of Market Numbers
- Historical Data Starting from 2022 to 2025
- Base Year 2025
- Forecast Data until 2032
- Key Performance Indicators Impacting the Market
- Major Upcoming Developments and Projects
Key Highlights of the Report:
- Japan Indoor Amusement Center Market Outlook
- Market Size of Japan Indoor Amusement Center Market, 2025
- Forecast of Japan Indoor Amusement Center Market, 2032
- Historical Data and Forecast of Japan Indoor Amusement Center Market Revenues & Volume for the Period 2022-2032F
- Japan Indoor Amusement Center Market Trend Evolution
- Japan Indoor Amusement Center Market Drivers and Challenges
- Japan Indoor Amusement Center Market Price Trends
- Japan Indoor Amusement Center Market Porter's Five Forces
- Japan Indoor Amusement Center Market Industry Life Cycle
- Historical Data and Forecast of Japan Indoor Amusement Center Market Revenues & Volume By Attraction Type for the Period 2022-2032F
- Historical Data and Forecast of Japan Indoor Amusement Center Market Revenues & Volume By Trampoline Parks for the Period 2022-2032F
- Historical Data and Forecast of Japan Indoor Amusement Center Market Revenues & Volume By VR Gaming for the Period 2022-2032F
- Historical Data and Forecast of Japan Indoor Amusement Center Market Revenues & Volume By Arcade Games for the Period 2022-2032F
- Historical Data and Forecast of Japan Indoor Amusement Center Market Revenues & Volume By Soft Play Areas for the Period 2022-2032F
- Historical Data and Forecast of Japan Indoor Amusement Center Market Revenues & Volume By Age Group for the Period 2022-2032F
- Historical Data and Forecast of Japan Indoor Amusement Center Market Revenues & Volume By Children for the Period 2022-2032F
- Historical Data and Forecast of Japan Indoor Amusement Center Market Revenues & Volume By Youth for the Period 2022-2032F
- Historical Data and Forecast of Japan Indoor Amusement Center Market Revenues & Volume By All Ages for the Period 2022-2032F
- Historical Data and Forecast of Japan Indoor Amusement Center Market Revenues & Volume By Kids for the Period 2022-2032F
- Historical Data and Forecast of Japan Indoor Amusement Center Market Revenues & Volume By Facility Type for the Period 2022-2032F
- Historical Data and Forecast of Japan Indoor Amusement Center Market Revenues & Volume By Standalone Centers for the Period 2022-2032F
- Historical Data and Forecast of Japan Indoor Amusement Center Market Revenues & Volume By Mall-based for the Period 2022-2032F
- Historical Data and Forecast of Japan Indoor Amusement Center Market Revenues & Volume By Entertainment Zones for the Period 2022-2032F
- Historical Data and Forecast of Japan Indoor Amusement Center Market Revenues & Volume By Indoor Parks for the Period 2022-2032F
- Historical Data and Forecast of Japan Indoor Amusement Center Market Revenues & Volume By Revenue Model for the Period 2022-2032F
- Historical Data and Forecast of Japan Indoor Amusement Center Market Revenues & Volume By Ticket Sales for the Period 2022-2032F
- Historical Data and Forecast of Japan Indoor Amusement Center Market Revenues & Volume By Subscription for the Period 2022-2032F
- Historical Data and Forecast of Japan Indoor Amusement Center Market Revenues & Volume By Pay-per-play for the Period 2022-2032F
- Historical Data and Forecast of Japan Indoor Amusement Center Market Revenues & Volume By Membership for the Period 2022-2032F
- Historical Data and Forecast of Japan Indoor Amusement Center Market Revenues & Volume By End User for the Period 2022-2032F
- Historical Data and Forecast of Japan Indoor Amusement Center Market Revenues & Volume By Families for the Period 2022-2032F
- Historical Data and Forecast of Japan Indoor Amusement Center Market Revenues & Volume By Teenagers for the Period 2022-2032F
- Historical Data and Forecast of Japan Indoor Amusement Center Market Revenues & Volume By General Public for the Period 2022-2032F
- Historical Data and Forecast of Japan Indoor Amusement Center Market Revenues & Volume By Parents for the Period 2022-2032F
- Japan Indoor Amusement Center Market Import Export Trade Statistics
- Market Opportunity Assessment By Attraction Type
- Market Opportunity Assessment By Age Group
- Market Opportunity Assessment By Facility Type
- Market Opportunity Assessment By Revenue Model
- Market Opportunity Assessment By End User
- Japan Indoor Amusement Center Market Top Companies Market Share
- Japan Indoor Amusement Center Market Competitive Benchmarking By Technical and Operational Parameters
- Japan Indoor Amusement Center Market Company Profiles
- Japan Indoor Amusement Center Market Key Strategic Recommendations
Market Covered
The report covers the following segments.
By Attraction Type
- Trampoline Parks
- VR Gaming
- Arcade Games
- Soft Play Areas
By Age Group
- Children
- Youth
- All Ages
- Kids
By Facility Type
- Standalone Centers
- Mall-based
- Entertainment Zones
- Indoor Parks
By Revenue Model
- Ticket Sales
- Subscription
- Pay-per-play
- Membership
By End User
- Families
- Teenagers
- General Public
- Parents































