Japan Inorganic Compounds Market Size & Growth Rate
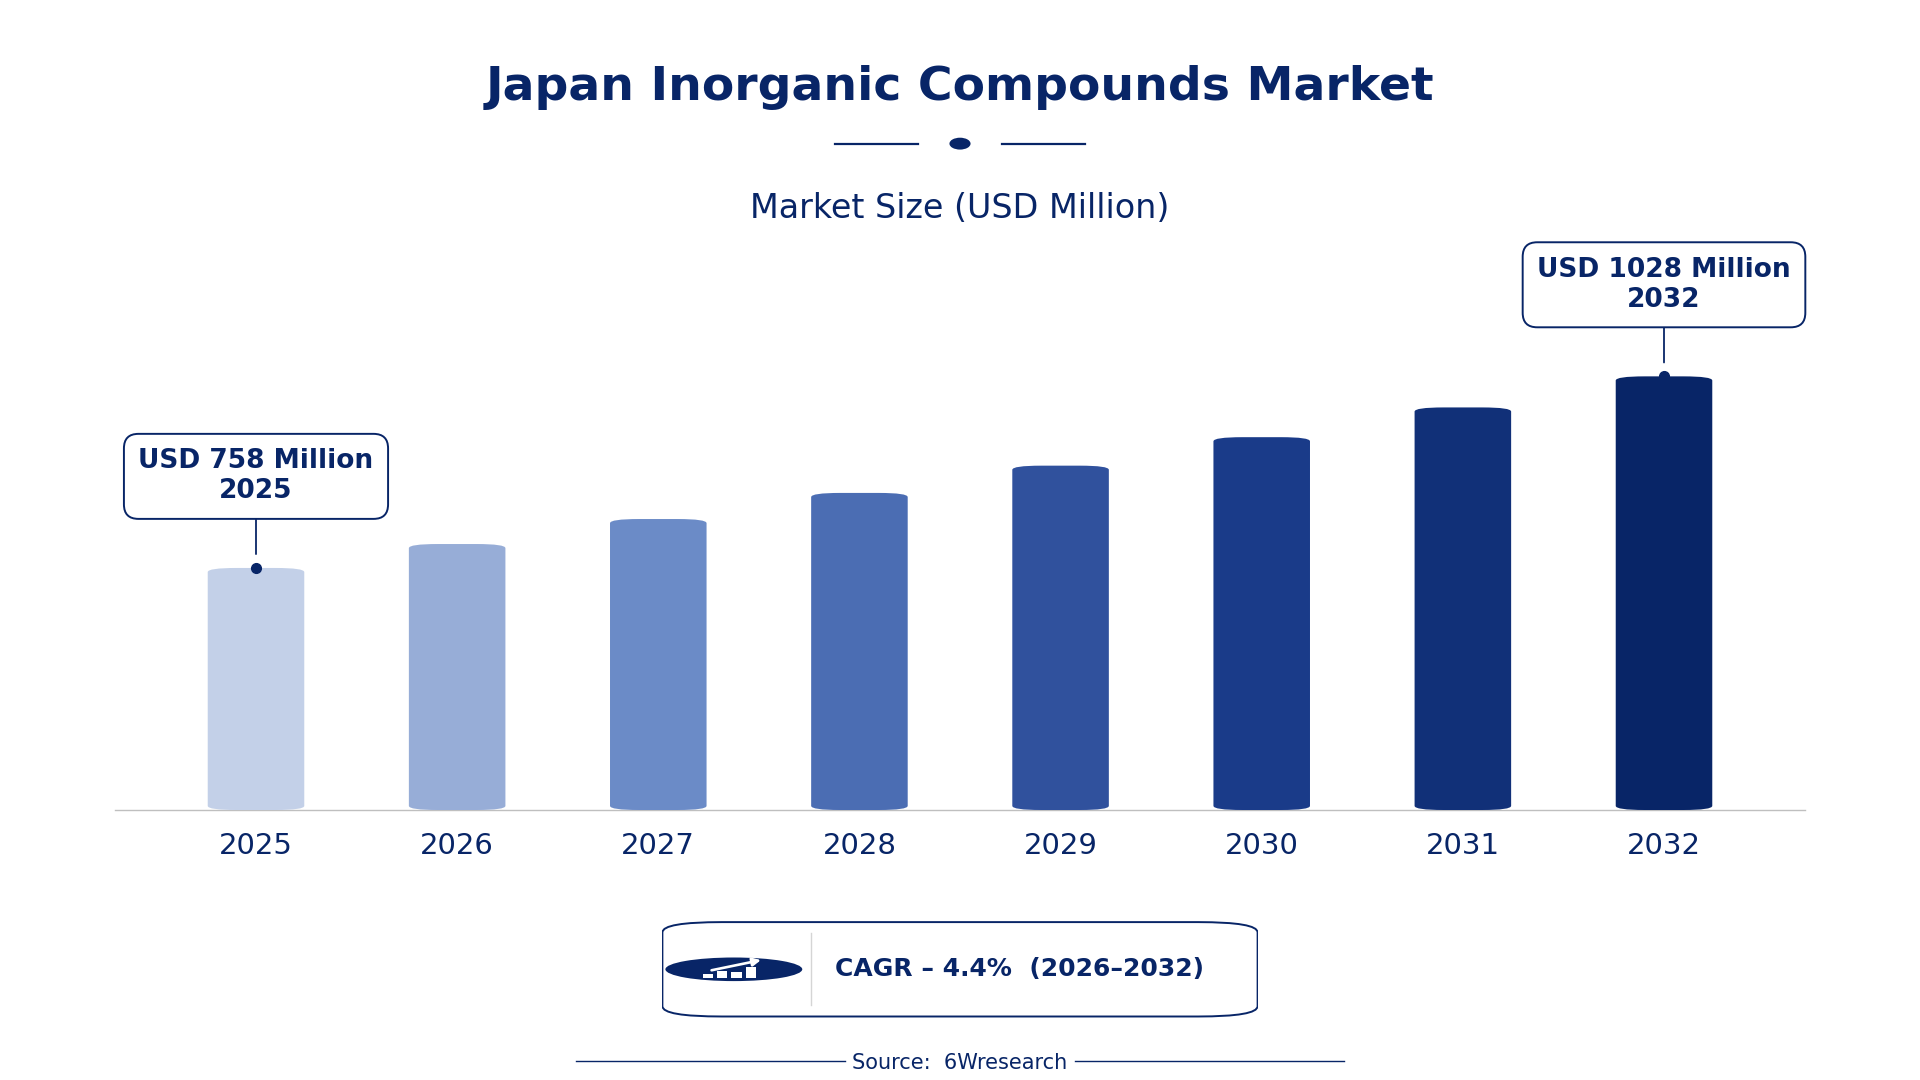
According to 6Wresearch internal database and industry insights, the Japan Inorganic Compounds Market was valued at USD 758 Million in 2025 and is projected to reach USD 1,028 Million by 2032, growing at a CAGR of approximately 4.4% during 2026–2032.
Japan Inorganic Compounds Market Highlights
| Report Metric | Details |
| Report Name | Japan Inorganic Compounds Market (2026-2032) |
| Market Size 2025 | USD 758 Million |
| Market Size 2032 | USD 1,028 Million |
| Absolute Growth 2025–2032 | USD 270 Million |
| CAGR 2026–2032 | 4.4% |
| Peak Annual Growth | 5.5% in 2030 |
| Forecast Period | 2026–2032 |
| Historical Data | 2022–2025 |
| Base Year | 2025 |
| Leading Compound Type, 2025 | Inorganic Acids (42% share) |
| Leading Element Class, 2025 | Fe (15% share) |
| Leading Industrial Use, 2025 | Fertilizer (41% share) |
| Leading Form Factor, 2025 | Granular (38% share) |
| Leading Sector, 2025 | Agriculture (51% share) |
| Fastest-Growing Compound Type | Nonmetal Compounds (6.4% CAGR) |
| Fastest-Growing Element Class | Zn (6.1% CAGR) |
| Fastest-Growing Industrial Use | Cleaning Agents (5.9% CAGR) |
| Fastest-Growing Form Factor | Liquid/Powder (6.2% CAGR) |
| Fastest-Growing Sector | Industrial Cleaning (5.8% CAGR) |
| Growing Sector | Agriculture |
| Key End Users | Agricultural producers, industrial manufacturers, cleaning service providers, pharmaceutical companies |
Japan Inorganic Compounds Market Year-wise Growth Rate and Key Drivers (2022–2032)
This graph illustrates the annual growth rates of the market from 2022 to 2032, highlighting a steady upward trajectory and projected market expansion over the forecast period.
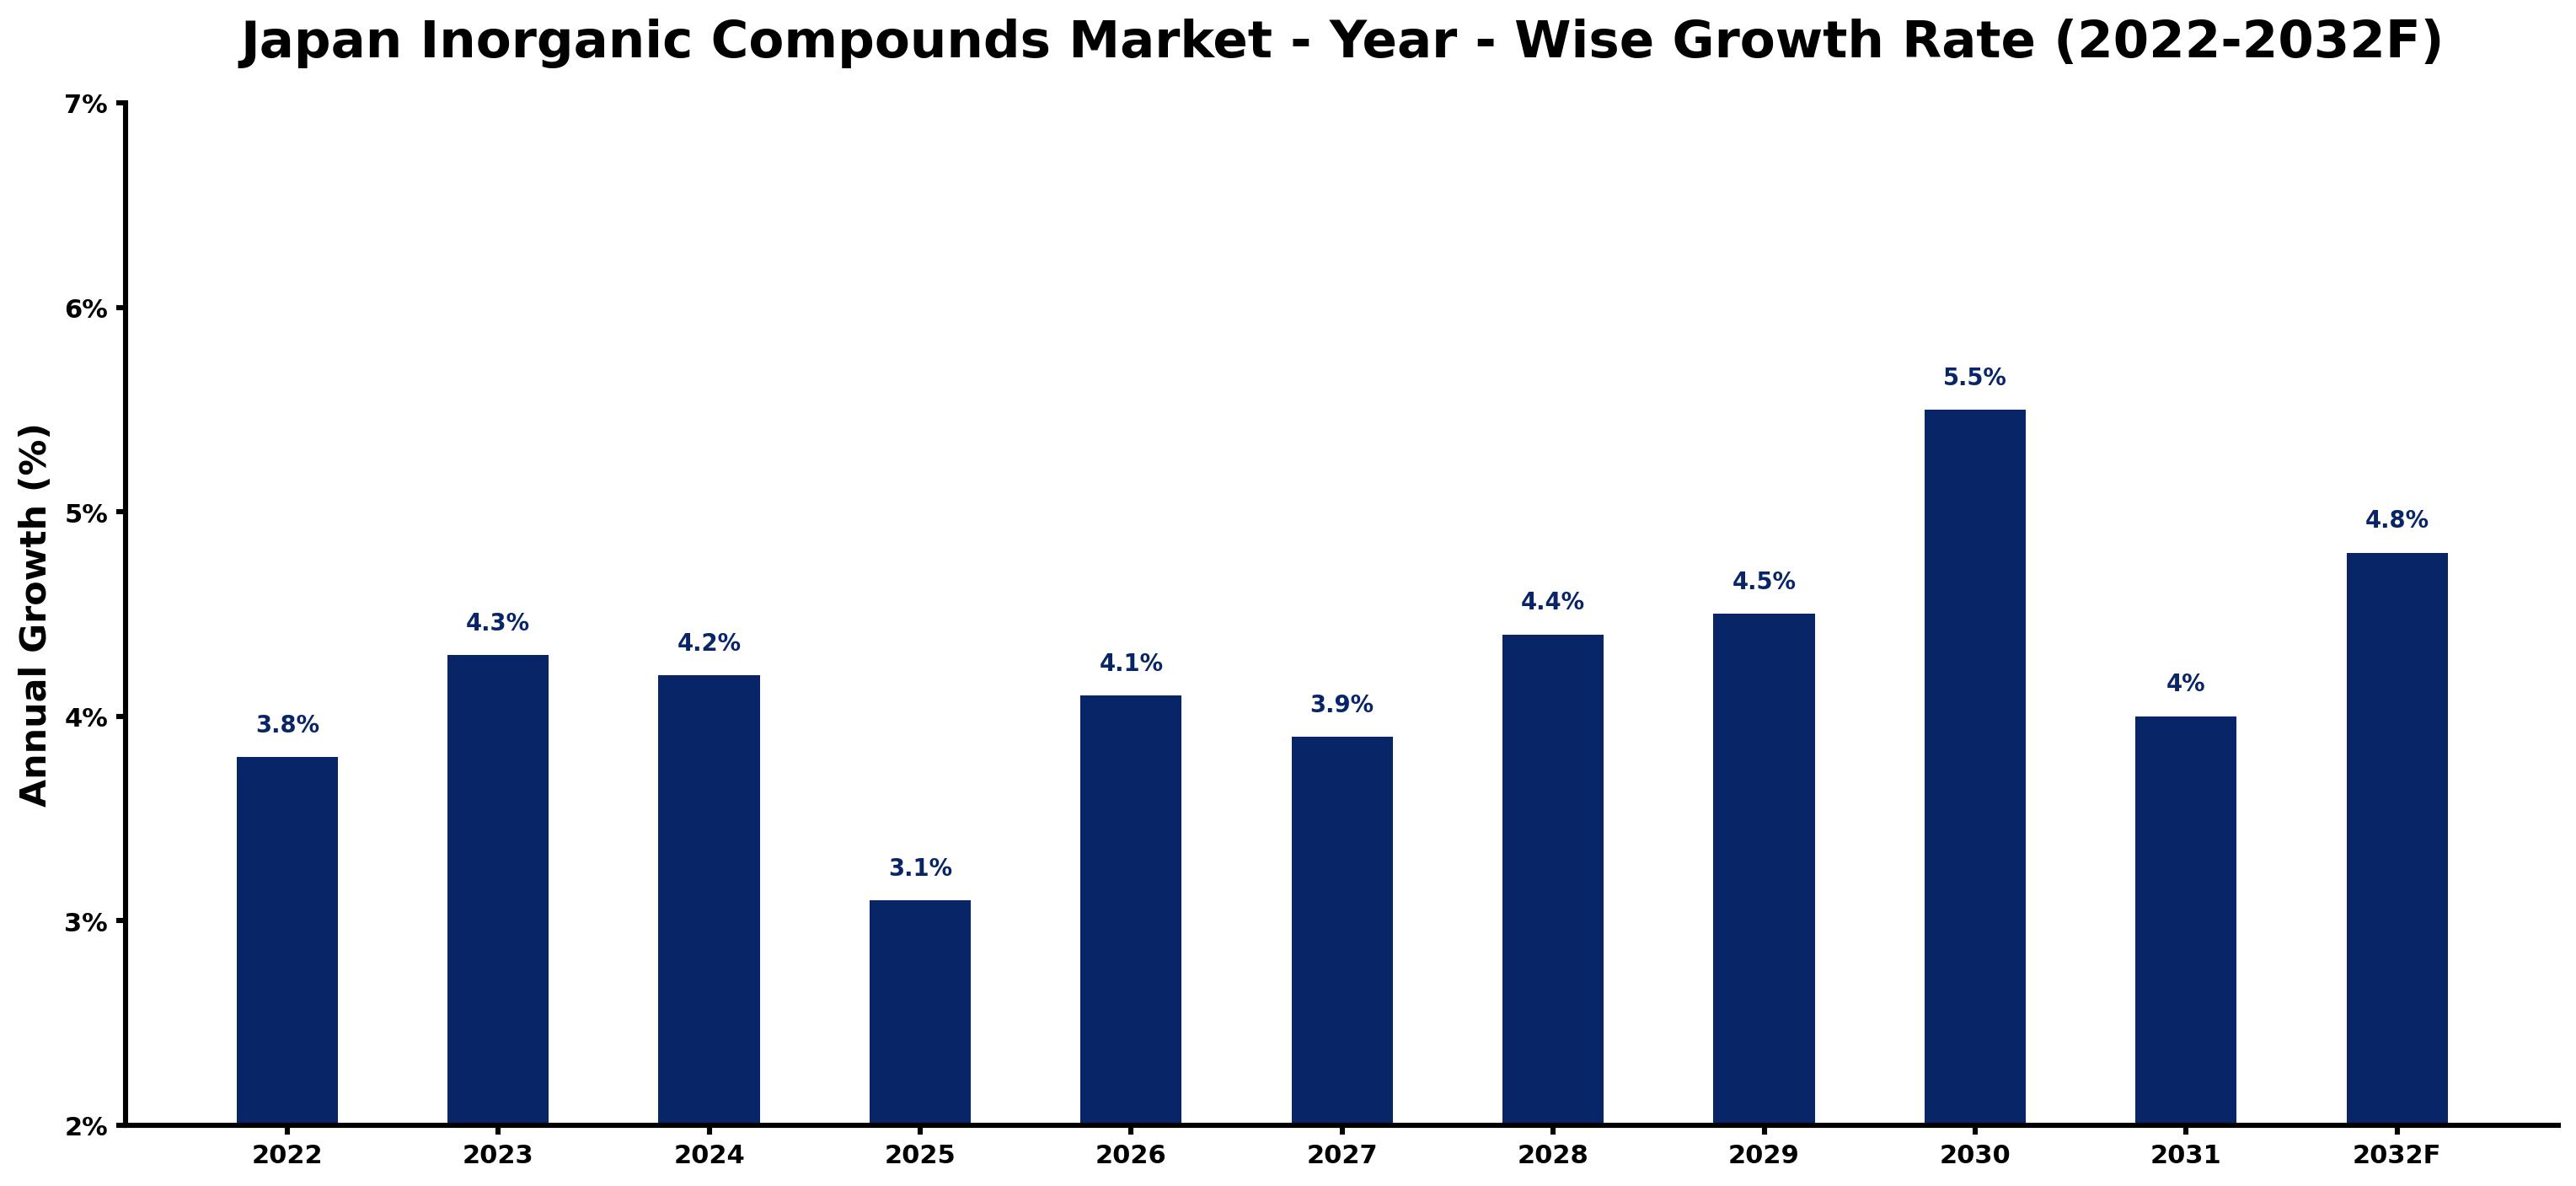
Each row of the following table gives one year's estimated growth and the event or demand shift that explains it.
| Year | Estimated Annual Growth (%) | Market Rationale |
| 2022 | 3.8 | Demand remained stable, supported by consistent agricultural output and industrial applications. |
| 2023 | 4.3 | Growth accelerated due to increased fertilizer production and heightened hygiene awareness. |
| 2024 | 4.2 | Demand growth slowed as market adjustments occurred following the previous year's surge. |
| 2025 | 3.1 | Market growth decelerated as companies adapted to evolving consumer preferences and regulations. |
| 2026 | 4.1 | Demand is expected to increase as investments in sustainable practices take effect. |
| 2027 | 3.9 | Growth is projected to slow as the market stabilises after a period of rapid expansion. |
| 2028 | 4.4 | Demand is expected to rise again, driven by the ongoing need for eco-friendly cleaning solutions. |
| 2029 | 4.5 | Growth will continue as industries expand their use of inorganic compounds in various applications. |
| 2030 | 5.5 | Peak growth is projected, driven by heightened agricultural production and industrial cleaning needs. |
| 2031 | 4.0 | Growth is expected to slow as the market begins to normalise after peak demand. |
| 2032 | 4.8 | Demand is expected to rise due to ongoing investments in agricultural innovation. |
Note: Market size estimations and growth projections presented in this report are based on 6Wresearch's proprietary forecasting methodology, utilizing the latest available industry data, government publications, and primary research inputs.
Japan Inorganic Compounds Market Synopsis
Inorganic compounds are key chemical substances used in agriculture, manufacturing, and pharmaceuticals, produced through processes like precipitation and crystallization. The Japan Inorganic Compounds Market is growing due to rising demand from the agricultural sector, which accounted for 1.2% of the GDP, alongside increased investments in sustainable practices. With the government allocating ¥10 billion for fertilizer subsidies in 2023, buyers are increasingly seeking eco-friendly solutions, driving further market growth.
Market Dynamics Impact Analysis (2026–2032)
| Factor | Type | Impact | Primary Segment Affected |
| Rising agricultural demand for fertilizers | Driver | High | Fertilizer |
| Growing industrial cleaning sector | Driver | High | Cleaning Agents |
| Sustainable agricultural practices gaining traction | Opportunity | Medium | Fertilizer |
| Increased need for eco-friendly cleaning agents | Opportunity | Medium | Cleaning Agents |
| Regulatory compliance costs for chemical substances | Restraint | High | Inorganic Acids |
| Market saturation in certain segments | Restraint | Medium | Fertilizer |
| High production costs affecting profitability | Challenge | High | Metal Oxides |
| Limited capacity for rapid scale-up in production | Challenge | Medium | Nonmetal Compounds |
Evaluation of Drivers in Japan Inorganic Compounds Market (2026–2032)
Demand rests on the following drivers, each shown with the segment it touches most.
| Drivers | Primary Segment Affected | Why It Matters (Evidence) |
| Increased fertilizer production | Fertilizer | Japan produced 1.5 million tons of inorganic fertilizers in 2022, boosting agricultural supply. |
| Expansion in industrial cleaning applications | Cleaning Agents | The installed base of cleaning agents in industrial sectors is valued at ¥200 billion, driving demand. |
| Growing population necessitating food production | Fertilizer | Japan's population of approximately 125 million increases the need for effective agricultural solutions. |
| Rising awareness of hygiene and sanitation | Disinfectants | The demand for disinfectants surged in 2023 due to increased hygiene awareness during health crises. |
| Technological advancements in chemical processes | Inorganic Acids | Innovations in chemical synthesis enhance the efficiency of inorganic acids like HNO3. |
Much of the new demand traces back to the agricultural sector, which accounted for 1.2% of Japan's GDP, driving fertilizer production to 1.5 million tons in 2022. The need for effective cleaning agents in industrial applications is also rising, with the market for cleaning agents valued at ¥200 billion. Japan's population of approximately 125 million necessitates increased food production, further boosting fertilizer demand. The surge in hygiene awareness in 2023 has led to a spike in disinfectant usage, while advancements in chemical processes improve the efficiency of inorganic acids, creating new opportunities for buyers.
Evaluation of Restraints in Japan Inorganic Compounds Market
Below are the constraints most often cited by buyers and suppliers, with the segment each affects.
| Market Restraint | Primary Segment Affected | Why It Matters (Evidence) |
| High compliance costs due to stringent regulations | Inorganic Acids | The PRTR Law requires businesses to report chemical releases, increasing operational costs. |
| Market saturation limiting growth potential | Fertilizer | The fertilizer market faces saturation as production levels stabilise, affecting new investments. |
| Rising production costs impacting profitability | Metal Oxides | Increased raw material prices have raised production costs, squeezing margins for producers. |
| Limited capacity for rapid production scale-up | Nonmetal Compounds | Manufacturers face challenges in quickly scaling up production to meet sudden demand spikes. |
| Regulatory hurdles for new chemical substances | Cleaning Agents | The Chemical Substances Control Law requires extensive evaluations, delaying product launches. |
Japan Inorganic Compounds Market Challenges
A major challenge in the inorganic compounds market is the intense competition among domestic producers, which drives down prices and squeezes profit margins for suppliers. This competitive landscape arises from the high number of local manufacturers, leading to revenue declines for those unable to differentiate their products. Rising raw material costs further burden manufacturers, causing delays in product availability for buyers in agriculture and industrial sectors. In 2022, the production of 500,000 tons of metal oxides illustrates the pressure on suppliers. Disruptions in logistics can delay deliveries, impacting the agricultural sector's timely access to essential fertilizers. Limited skills in chemical processing restrict producers' capacity to meet increasing demand, resulting in potential revenue losses for suppliers.
Trends in the Japan Inorganic Compounds Market
These developments are changing demand patterns in the Japan Inorganic Compounds Market.
- Shift towards Eco-Friendly Cleaning Agents: In 2023, there was a notable shift towards eco-friendly cleaning agents, driven by increased hygiene awareness. The Ministry of the Environment promotes these products, with the market projected to grow steadily through 2025.
- Transition from Traditional to Sustainable Fertilizers: The agricultural sector is transitioning to sustainable fertilizers, supported by a ¥10 billion government subsidy in 2023. This shift is vital for meeting the demands of an aging population and environmental concerns.
- Emerging Demand for Advanced Inorganic Acids: The demand for advanced inorganic acids, such as HNO3, is rising due to their role in chemical synthesis. The Japanese chemical industry is adapting to this trend to improve production efficiency.
- Growth in Industrial Cleaning Sector: The industrial cleaning sector is experiencing growth, particularly in the Tokyo region, which is a significant hub for chemical manufacturing. The market for cleaning agents is projected to expand significantly.
Investment Opportunities in the Japan Inorganic Compounds Market
The opportunities below stand out in the Japan Inorganic Compounds Market for new entrants and existing suppliers.
- Supply of Sustainable Fertilizers: With the government allocating ¥10 billion for fertilizer subsidies in 2023, there is a strong opportunity to supply sustainable fertilizers. Agriculture is a key buyer group needing eco-friendly solutions.
- Investment in Eco-Friendly Cleaning Solutions: The increasing demand for eco-friendly cleaning agents presents an opportunity for suppliers to invest in new products. Industrial cleaning sectors are actively seeking these solutions to comply with regulations.
- Development of Advanced Inorganic Acids: The rising need for advanced inorganic acids creates an opportunity for investment in R&D. Chemical manufacturers can partner with research institutions to innovate and meet market demands.
- Expansion into the Disinfectants Market: The surge in disinfectant demand due to hygiene awareness offers an opportunity for suppliers to expand their product lines. Cleaning agents in industrial sectors are looking for effective disinfectant solutions.
Government Initiatives in the Japan Inorganic Compounds Market
The Economic Security Promotion Act, established in 2022, supports supply-chain resilience for critical products, including inorganic compounds. This law mandates businesses to improve their operational capabilities to ensure a steady supply of essential materials. Additionally, the Chemical Substances Control Law, enacted in 1973, requires evaluation and control of chemical substances, ensuring safety and compliance in production and import activities.
In 2023, the Ministry of Agriculture allocated ¥10 billion for fertilizer subsidies, aimed at promoting sustainable agricultural practices. The Japan Chemical Industry Association oversees various initiatives to support the growth of the chemical sector, ensuring compliance with safety standards and promoting innovation in product development.
Future Insight of the Japan Inorganic Compounds Market
Investment in new chemical processing facilities will create demand opportunities by 2032, benefiting both buyers and suppliers. The government's initiative to promote sustainable agricultural practices will drive the development of eco-friendly products. Adoption of standards like ISO 9001 will improve product quality, fostering confidence among users. The industrial cleaning market, valued at ¥200 billion, will continue to expand, allowing suppliers to introduce innovative cleaning agents and technologies.
Market Segmentation Analysis
Japan Inorganic Compounds Market report covers a detailed analysis of the following market segments:
By Compound Type – Inorganic Acids Lead, Nonmetal Compounds Expected to Grow Fastest
According to Saurav Kr Singh, Senior Research Analyst at 6Wresearch, in 2025, Inorganic Acids led the compound type split with a 42% share. Inorganic acids hold the largest share as they are vital for chemical manufacturing, particularly in producing fertilizers and catalysts. The production of HNO3 is particularly significant, underpinning numerous industrial applications throughout Japan. The quickest growth will come from Nonmetal Compounds, forecast to expand at a CAGR of 6.4% between 2026 and 2032. Nonmetal compounds are witnessing rapid growth due to their increasing use in fertilizers and cleaning agents, reflecting a shift towards sustainable agricultural practices. The government's recent programme promoting eco-friendly methods has significantly boosted their demand. Suppliers should focus on enhancing their portfolios of nonmetal compounds to meet the rising market demand.
By Element Class – Fe Leads, Zn Expected to Grow Fastest
Fe held 15% of the Japan Inorganic Compounds Market by element class in 2025. Iron leads the element class segment due to its critical role in metal production and as a key catalyst in numerous industrial processes. Its extensive application across various manufacturing sectors reinforces its dominant market position. Zn is set to record the highest CAGR in this split, 6.1% over 2026–2032. Zinc is growing at the fastest rate, driven by its rising use in fertilizers and galvanizing, which are essential for improving crop yields and protecting metal surfaces. The increasing emphasis on agricultural productivity is propelling this trend. Buyers should consider sourcing more zinc-based products to fulfil the escalating agricultural requirements.
By Industrial Use – Fertilizer Leads, Cleaning Agents Expected to Grow Fastest
With 41% of industrial use revenue in 2025, Fertilizer was the largest category. Fertilizer is the leading industrial use as it directly supports Japan's agricultural sector, which is vital to the economy. The production of 2 million tons of potassium fertilizers in 2022 underscores its importance in the market. Over 2026–2032, Cleaning Agents are expected to post the fastest growth, at a CAGR of 5.9%. Cleaning agents are the fastest-growing industrial use, spurred by heightened hygiene awareness and rising demand in both industrial and household sectors. The increasing preference for eco-friendly cleaning solutions is also driving this growth. Suppliers should invest in the development of advanced cleaning agents to meet evolving market trends.
By Form Factor – Granular Leads, Liquid/Powder Expected to Grow Fastest
Granular accounted for 38% of the market by form factor in 2025. Granular forms are the leading choice in the market as they are highly effective in fertilizers and industrial applications, making them indispensable for users. Their established role in agriculture reinforces their dominant market position. Liquid/Powder is projected to grow fastest, at a CAGR of 6.2% during 2026–2032. Liquid and powder forms are quickly gaining popularity due to their flexibility in various chemical formulations and their ability to meet contemporary application requirements. This shift towards more adaptable product forms is driving their rapid growth. Buyers should consider incorporating liquid and powder forms to enhance their operational versatility.
By Sector – Agriculture Leads, Industrial Cleaning Expected to Grow Fastest
The largest sector category in 2025 was Agriculture, at 51% of revenue. The agriculture sector leads the market as it is a primary consumer of inorganic compounds, particularly fertilizers, which are essential for crop production. With agriculture accounting for 1.2% of Japan's GDP, its influence is substantial. The quickest growth will come from Industrial Cleaning, forecast to expand at a CAGR of 5.8% between 2026 and 2032. Industrial cleaning is the fastest-growing sector due to increased hygiene standards and the rising demand for effective cleaning solutions in various industries. The recent surge in demand for disinfectants illustrates this trend. Suppliers should focus on catering to the industrial cleaning sector to capitalise on its growth potential.
Key Attractiveness of the Report
- 10 Years of Market Numbers
- Historical Data Starting from 2022 to 2025
- Base Year 2025
- Forecast Data until 2032
- Key Performance Indicators Impacting the Market
- Major Upcoming Developments and Projects
Key Highlights of the Report:
- Japan Inorganic Compounds Market Outlook
- Market Size of Japan Inorganic Compounds Market, 2025
- Forecast of Japan Inorganic Compounds Market, 2032
- Historical Data and Forecast of Japan Inorganic Compounds Revenues & Volume for the Period 2022-2032F
- Japan Inorganic Compounds Market Trend Evolution
- Japan Inorganic Compounds Market Drivers and Challenges
- Japan Inorganic Compounds Price Trends
- Japan Inorganic Compounds Porter's Five Forces
- Japan Inorganic Compounds Industry Life Cycle
- Historical Data and Forecast of Japan Inorganic Compounds Market Revenues & Volume By Compound Type for the Period 2022-2032F
- Historical Data and Forecast of Japan Inorganic Compounds Market Revenues & Volume By Metal Oxides for the Period 2022-2032F
- Historical Data and Forecast of Japan Inorganic Compounds Market Revenues & Volume By Nonmetal Compounds for the Period 2022-2032F
- Historical Data and Forecast of Japan Inorganic Compounds Market Revenues & Volume By Salts for the Period 2022-2032F
- Historical Data and Forecast of Japan Inorganic Compounds Market Revenues & Volume By Inorganic Acids for the Period 2022-2032F
- Historical Data and Forecast of Japan Inorganic Compounds Market Revenues & Volume By Element Class for the Period 2022-2032F
- Historical Data and Forecast of Japan Inorganic Compounds Market Revenues & Volume By Fe, Zn, Cu for the Period 2022-2032F
- Historical Data and Forecast of Japan Inorganic Compounds Market Revenues & Volume By P, S, Cl for the Period 2022-2032F
- Historical Data and Forecast of Japan Inorganic Compounds Market Revenues & Volume By Na, K, Mg for the Period 2022-2032F
- Historical Data and Forecast of Japan Inorganic Compounds Market Revenues & Volume By HNO3, H3PO4 for the Period 2022-2032F
- Historical Data and Forecast of Japan Inorganic Compounds Market Revenues & Volume By Industrial Use for the Period 2022-2032F
- Historical Data and Forecast of Japan Inorganic Compounds Market Revenues & Volume By Ceramics, Catalysts for the Period 2022-2032F
- Historical Data and Forecast of Japan Inorganic Compounds Market Revenues & Volume By Disinfectants, Fertilizer for the Period 2022-2032F
- Historical Data and Forecast of Japan Inorganic Compounds Market Revenues & Volume By Reactants for the Period 2022-2032F
- Historical Data and Forecast of Japan Inorganic Compounds Market Revenues & Volume By Cleaning Agents for the Period 2022-2032F
- Historical Data and Forecast of Japan Inorganic Compounds Market Revenues & Volume By Form Factor for the Period 2022-2032F
- Historical Data and Forecast of Japan Inorganic Compounds Market Revenues & Volume By Granular for the Period 2022-2032F
- Historical Data and Forecast of Japan Inorganic Compounds Market Revenues & Volume By Liquid/Powder for the Period 2022-2032F
- Historical Data and Forecast of Japan Inorganic Compounds Market Revenues & Volume By Crystal for the Period 2022-2032F
- Historical Data and Forecast of Japan Inorganic Compounds Market Revenues & Volume By Liquid for the Period 2022-2032F
- Historical Data and Forecast of Japan Inorganic Compounds Market Revenues & Volume By Sector for the Period 2022-2032F
- Historical Data and Forecast of Japan Inorganic Compounds Market Revenues & Volume By Automotive & Electronics for the Period 2022-2032F
- Historical Data and Forecast of Japan Inorganic Compounds Market Revenues & Volume By Agriculture for the Period 2022-2032F
- Historical Data and Forecast of Japan Inorganic Compounds Market Revenues & Volume By Food, Pharma for the Period 2022-2032F
- Historical Data and Forecast of Japan Inorganic Compounds Market Revenues & Volume By Industrial Cleaning for the Period 2022-2032F
- Japan Inorganic Compounds Import Export Trade Statistics
- Market Opportunity Assessment By Compound Type
- Market Opportunity Assessment By Element Class
- Market Opportunity Assessment By Industrial Use
- Market Opportunity Assessment By Form Factor
- Market Opportunity Assessment By Sector
- Japan Inorganic Compounds Top Companies Market Share
- Japan Inorganic Compounds Competitive Benchmarking By Technical and Operational Parameters
- Japan Inorganic Compounds Company Profiles
- Japan Inorganic Compounds Key Strategic Recommendations
Market Covered
This report examines the market across the segments below.
By Compound Type
- Metal Oxides
- Nonmetal Compounds
- Salts
- Inorganic Acids
By Element Class
- Fe
- Zn
- Cu
- P
- S
- Cl
- Na
- K
- Mg
- HNO3
- H3PO4
By Industrial Use
- Ceramics
- Catalysts
- Disinfectants
- Fertilizer
- Reactants
- Cleaning Agents
By Form Factor
- Granular
- Liquid/Powder
- Crystal
- Liquid
By Sector
- Automotive & Electronics
- Agriculture
- Food
- Pharma
- Industrial Cleaning































