Japan Proximitying Market Size & Growth Rate
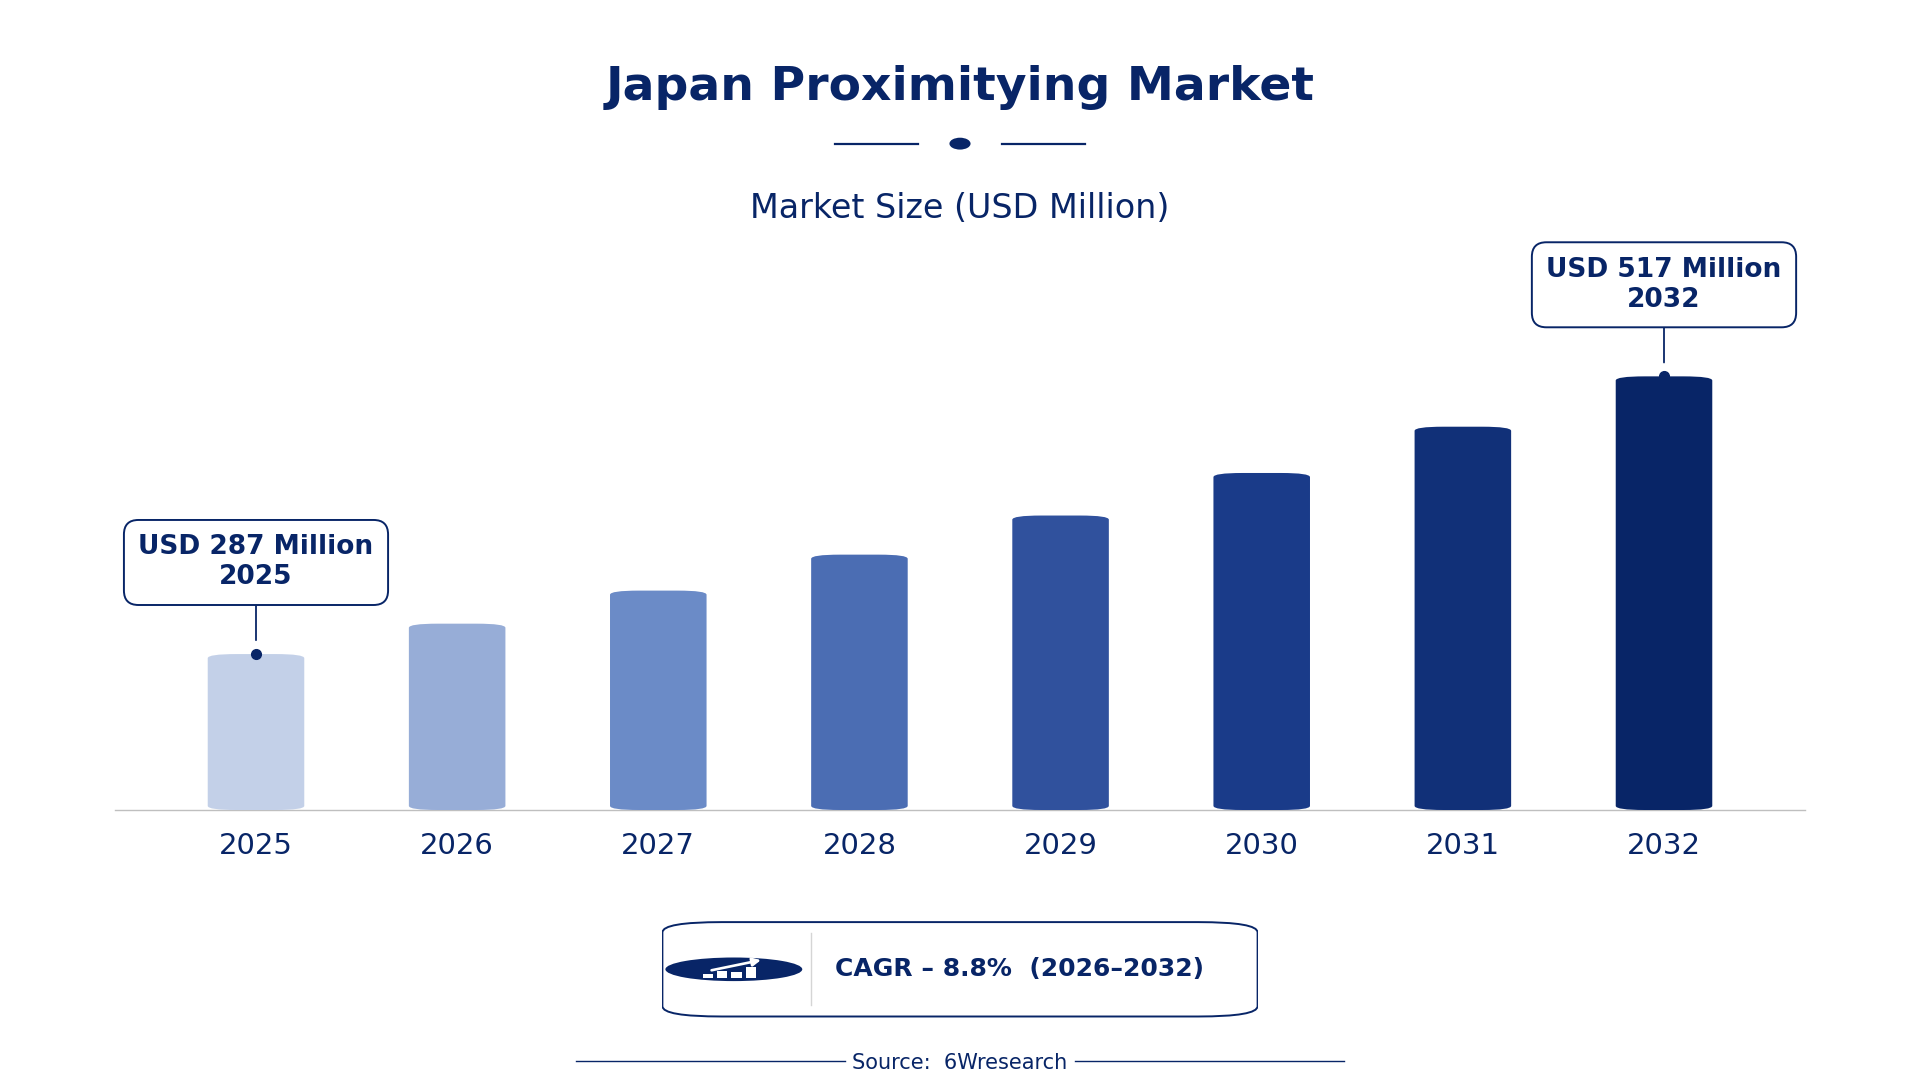
According to 6Wresearch internal database and industry insights, the Japan Proximitying Market was valued at USD 287 Million in 2025 and is projected to reach USD 517 Million by 2032, growing at a CAGR of approximately 8.8% during 2026–2032.
Japan Proximitying Market Highlights
| Report Metric | Details |
| Report Name | Japan Proximitying Market (2026-2032) |
| Market Size 2025 | USD 287 Million |
| Market Size 2032 | USD 517 Million |
| Absolute Growth 2025–2032 | USD 230 Million |
| CAGR 2026–2032 | 8.8% |
| Peak Annual Growth | 9.5% in 2026 |
| Forecast Period | 2026–2032 |
| Historical Data | 2022–2025 |
| Base Year | 2025 |
| Leading Marketing Type, 2025 | Bluetooth Beacons (52% share) |
| Leading Technology Used, 2025 | BLE (39% share) |
| Leading Distribution Channel, 2025 | Online Platforms (46% share) |
| Leading End User, 2025 | Retail Chains (39% share) |
| Fastest-Growing Marketing Type | NFC Campaigns (12.0% CAGR) |
| Fastest-Growing Technology Used | Mobile Interaction (12.4% CAGR) |
| Fastest-Growing Distribution Channel | Digital Agencies (11.4% CAGR) |
| Fastest-Growing End User | Event Management Firms (11.1% CAGR) |
| Growing Sector | Event Management Firms |
| Key End Users | Retail Chains, Event Management Firms, Entertainment Venues, Consumer Product Companies |
Japan Proximitying Market Year-wise Growth Rate and Key Drivers (2022–2032)
This graph illustrates the annual growth rates of the market from 2022 to 2032, highlighting a steady upward trajectory and projected market expansion over the forecast period.
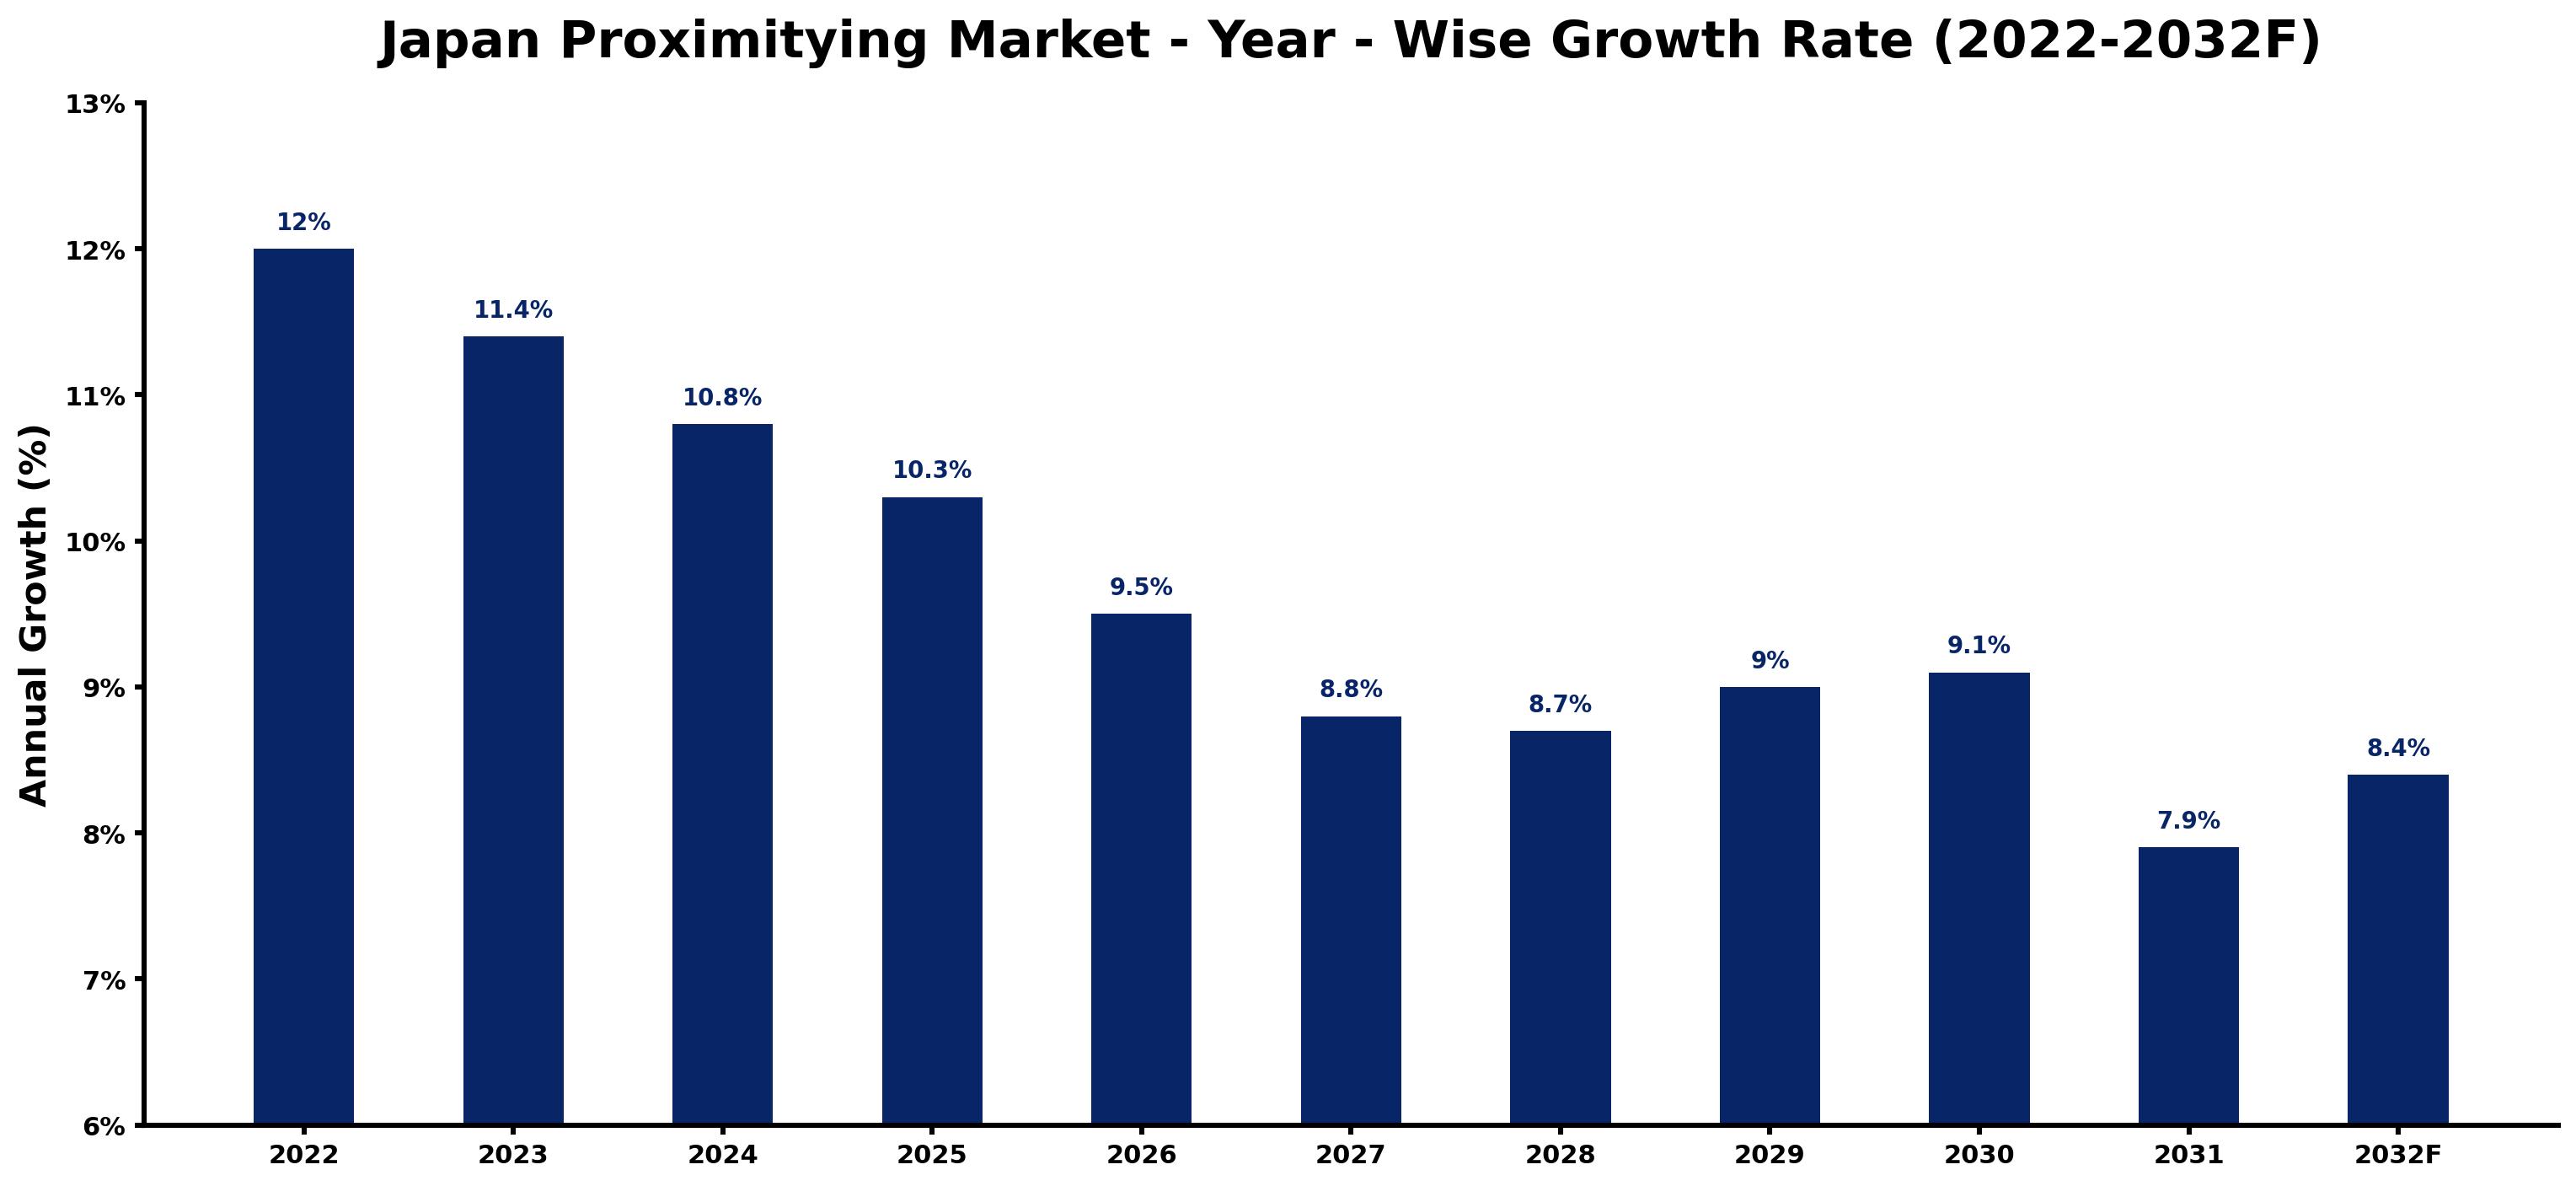
The table below sets out the estimated growth rate for each year and the main factor behind it.
| Year | Estimated Annual Growth (%) | Market Rationale |
| 2022 | 12.0 | The market experienced strong engagement rates due to effective marketing strategies. |
| 2023 | 11.4 | Growth slowed as market saturation began to affect new campaign launches. |
| 2024 | 10.8 | Consumer preferences shifted towards more personalized marketing experiences, impacting growth. |
| 2025 | 10.3 | The introduction of new technologies led to a slight slowdown in growth rates. |
| 2026 | 9.5 | Market expansion slowed as competition intensified among service providers. |
| 2027 | 8.8 | Adoption of mobile interaction technologies is expected to stabilise growth rates. |
| 2028 | 8.7 | The market will continue to grow, driven by consistent consumer engagement. |
| 2029 | 9.0 | A resurgence in event marketing campaigns will accelerate growth rates again. |
| 2030 | 9.1 | Increased consumer spending on personalized experiences is projected to boost demand. |
| 2031 | 7.9 | Growth will slow as market maturity sets in, leading to a more competitive environment. |
| 2032 | 8.4 | The introduction of new digital marketing standards is expected to improve engagement. |
Note: Market size estimations and growth projections presented in this report are based on 6Wresearch's proprietary forecasting methodology, utilizing the latest available industry data, government publications, and primary research inputs.
Japan Proximitying Market Synopsis
Proximitying utilises technologies such as Bluetooth beacons and NFC to improve customer engagement through location-based services. Key buyer groups include retail chains and event management firms, both of which use these technologies for targeted advertising and customer interaction. The Japan Proximitying Market is expanding as consumer preference shifts towards personalised marketing experiences, with 80 million NFC-enabled devices in 2023 driving demand for effective marketing solutions and the government's digital transformation initiative promoting tech adoption.
Market Dynamics Impact Analysis (2026–2032)
| Factor | Type | Impact | Primary Segment Affected |
| Increasing consumer preference for personalized marketing experiences | Driver | High | Bluetooth Beacons |
| Widespread adoption of NFC-enabled devices | Driver | High | NFC Campaigns |
| Growing number of retail establishments adopting proximity marketing | Opportunity | High | Retail Chains |
| Expansion of event management firms adopting proximity marketing solutions | Opportunity | Medium | Event Management Firms |
| Market saturation leading to slower growth rates | Restraint | High | Bluetooth Beacons |
| Intense competition among proximity marketing service providers | Restraint | Medium | Bluetooth Beacons |
| High costs associated with implementing advanced proximity technologies | Challenge | High | Bluetooth Beacons |
| Compliance with evolving digital marketing regulations | Challenge | Medium | Bluetooth Beacons |
Evaluation of Drivers in Japan Proximitying Market (2026–2032)
These are the developments adding the most demand over the forecast period.
| Drivers | Primary Segment Affected | Why It Matters (Evidence) |
| Consumer demand for personalized marketing experiences | Bluetooth Beacons | Over 60% of consumers in Japan prefer personalized marketing experiences, leading retailers to adopt Bluetooth beacons for targeted advertising. |
| Adoption of NFC technology for efficient transactions | NFC Campaigns | In 2023, the number of NFC-enabled devices in Japan reached 80 million, facilitating the implementation of NFC campaigns in retail. |
| Integration of proximity marketing in major events | Event Management Firms | Proximity marketing is integrated into over 500 major events annually in Japan, driving demand for effective marketing solutions. |
| Growth in retail establishments adopting proximity marketing | Retail Chains | Japan's retail sector includes over 1 million retail establishments, creating a large market for proximity marketing technologies. |
| Increased consumer spending due to engagement strategies | Bluetooth Beacons | The average consumer spends 30% more when engaged through proximity marketing, incentivising retailers to invest in these technologies. |
Several shifts outside the market lift sales. The number of NFC-enabled devices in Japan reached 80 million in 2023, facilitating transactions for retailers. Over 60% of consumers prefer personalised marketing experiences, prompting retail chains to adopt various proximity technologies. Proximity marketing is integrated into over 500 major events annually, driving demand for effective solutions in event management. The retail sector, with over 1 million establishments, is increasingly investing in proximity marketing technologies, as the average consumer spends 30% more when engaged through these strategies.
Evaluation of Restraints in Japan Proximitying Market
These are the pressures that could keep growth below its potential.
| Market Restraint | Primary Segment Affected | Why It Matters (Evidence) |
| Market saturation leading to slower growth rates | Bluetooth Beacons | As the market matures, growth rates are slowing, impacting the adoption of new technologies. |
| High costs associated with implementing advanced proximity technologies | NFC Campaigns | The costs of integrating NFC technology can deter smaller retailers from adopting the technology. |
| Intense competition among proximity marketing service providers | NFC Campaigns | A crowded market leads to price wars, reducing profitability for service providers. |
| Compliance with evolving digital marketing regulations | Bluetooth Beacons | Regulatory changes require constant adaptation, increasing operational costs for marketers. |
| Limited awareness of proximity marketing benefits among smaller retailers | Retail Chains | Many smaller retailers lack knowledge about the advantages of proximity marketing, hindering adoption. |
Japan Proximitying Market Challenges
Retail buyers experience delays due to strict regulations from the Consumer Affairs Agency, which can prolong campaign launches by three months. Producers face intense competition among over 1 million retail establishments, leading to reduced profit margins and limiting their ability to invest in new technologies. Suppliers encounter challenges from rapid technological changes, resulting in outdated marketing solutions that do not meet the specific demands of buyers. A shortage of skilled professionals in digital marketing restricts firms' capacity to implement effective proximity marketing, leading to a 15% drop in engagement rates for poorly executed campaigns.
Trends in the Japan Proximitying Market
Several trends are reshaping the Japan Proximitying Market; the most important are set out below.
- Shift from Traditional to Digital Marketing: Tokyo is experiencing a shift from traditional marketing methods to digital strategies. In 2023, proximity marketing campaigns saw a 15% increase in engagement rates, indicating a growing preference for digital solutions among consumers.
- Transition from Static to Dynamic Engagement: The change towards dynamic engagement methods is evident in retail chains adopting proximity marketing. QR codes accounted for 40% of mobile interactions in Japan in 2023, demonstrating the effectiveness of interactive marketing.
- Event Management Firms Prioritising Proximity Solutions: Event management firms are increasingly prioritising proximity marketing solutions to enhance visitor experiences. In 2023, over 500 major events integrated proximity marketing technologies, showcasing their growing importance.
- Retail Chains Embracing Personalised Marketing: Retail chains are embracing personalised marketing strategies through proximity technologies. The average consumer spends 30% more when engaged through proximity marketing, highlighting its effectiveness in driving sales.
Investment Opportunities in the Japan Proximitying Market
Investors looking at the Japan Proximitying Market should consider the following areas.
- Proximity Marketing Solutions for Retail Chains: With over 1 million retail establishments in Japan, there is an opportunity to supply proximity marketing solutions. Retail chains are increasingly investing in these technologies, creating a gap for suppliers to enter the market through partnerships.
- Digital Marketing Technologies for Event Management: Event management firms are adopting proximity marketing solutions to enhance visitor experiences. The integration of these technologies in over 500 major events annually presents a lucrative opportunity for suppliers to provide tailored solutions.
- NFC Technology Implementation: The growing number of NFC-enabled devices, reaching 80 million in Japan, indicates a strong demand for NFC technology solutions. Suppliers can enter the market by partnering with retail chains to implement these technologies.
- Personalised Marketing Strategies for Retailers: The average consumer's increased spending of 30% when engaged through proximity marketing highlights the demand for personalised marketing strategies. Suppliers can target retail chains to provide innovative solutions that enhance customer engagement.
Government Initiatives in the Japan Proximitying Market
The Digital Agency, established in September 2021, spearheads government digital transformation and sets common system standards. This initiative supports the adoption of proximity marketing technologies by providing guidelines and resources for businesses looking to improve their marketing strategies. The AI Promotion Act (2025) encourages the integration of AI technologies into marketing solutions, benefiting proximity marketing by fostering innovation and efficiency.
Retail chains leverage the support of the Japan Marketing Association, which provides resources for best practices in proximity marketing. This association assists retailers in navigating the complexities of implementing proximity marketing strategies, ensuring compliance with regulations and maximising engagement with consumers.
Future Insight of the Japan Proximitying Market
The adoption of NFC technology will drive demand for proximity marketing solutions, with over 1,000 retail locations expected to implement these systems by 2032. The government's digital transformation initiative will encourage the integration of innovative marketing strategies, fostering competition among suppliers. As event management firms increasingly adopt proximity marketing, suppliers will find new opportunities to deliver tailored solutions. With 40% of mobile interactions involving QR codes, businesses must adapt their marketing approaches to leverage these technologies effectively.
Market Segmentation Analysis
Japan Proximitying Market report covers a detailed analysis of the following market segments:
By Marketing Type – Bluetooth Beacons Lead, NFC Campaigns Expected to Grow Fastest
According to Uttkarsh, Research Associate at 6Wresearch, with 52% of marketing type revenue in 2025, Bluetooth Beacons was the largest category. Bluetooth beacons hold the largest share as they are essential for location-based marketing, with over 30% of retail chains in Japan employing them. Their effectiveness in regions like Tokyo and Osaka underscores their role in enhancing customer engagement and driving sales. Over 2026–2032, NFC Campaigns are expected to post the fastest growth, at a CAGR of 12.0%. NFC campaigns are experiencing rapid growth due to their ability to facilitate seamless transactions and share information effectively, appealing to over 60% of consumers who prefer personalised marketing. The implementation of NFC in more than 1,000 retail locations reflects its increasing adoption. Suppliers should focus on advancing NFC technologies to meet the rising demand for personalised marketing experiences.
By Technology Used – BLE Leads, Mobile Interaction Expected to Grow Fastest
BLE took 39% of technology used revenue in 2025, more than any other category. BLE technology leads the market as it enables low-energy communication, which is vital for effective proximity marketing. Its efficiency is particularly beneficial for retail chains aiming to enhance customer engagement without incurring high operational costs. The quickest growth will come from Mobile Interaction, forecast to expand at a CAGR of 12.4% between 2026 and 2032. Mobile interaction is the fastest-growing technology, significantly improving customer engagement through mobile devices, aligning with the increasing smartphone penetration in Japan. This trend is evident as more consumers engage with proximity marketing via their smartphones. Buyers should invest in mobile interaction technologies to capitalise on the growing trend of consumer engagement through mobile devices.
By Distribution Channel – Online Platforms Lead, Digital Agencies Expected to Grow Fastest
Online Platforms accounted for 46% of the market by distribution channel in 2025. Online platforms are the dominant distribution channel, facilitating various marketing strategies and providing extensive reach for proximity marketing initiatives. Their effectiveness is reinforced by the rising number of digital marketing campaigns being executed in Japan. Digital Agencies are set to record the highest CAGR in this split, 11.4% over 2026–2032. Digital agencies are the fastest-growing channel, offering specialised services that effectively implement proximity marketing strategies. Their expertise is crucial for adapting marketing approaches to meet the evolving preferences of consumers. Suppliers must collaborate with digital agencies to refine their marketing strategies and broaden their audience reach.
By End User – Retail Chains Lead, Event Management Firms Expected to Grow Fastest
The largest end user category in 2025 was Retail Chains, at 39% of revenue. Retail chains represent the largest end user group, leveraging proximity marketing to enhance customer engagement and drive sales. With over 1 million retail establishments in Japan, their adoption of these technologies is vital for maintaining competitiveness in the market. Event Management Firms are projected to grow fastest, at a CAGR of 11.1% during 2026–2032. Event management firms are the fastest-growing end user segment, increasingly adopting proximity marketing solutions to boost event promotions and engage attendees. This trend is highlighted by the integration of proximity marketing into over 500 major events annually in Japan. Suppliers should tailor their offerings to meet the specific needs of event management firms to capture this expanding market.
Key Attractiveness of the Report
- 10 Years of Market Numbers
- Historical Data Starting from 2022 to 2025
- Base Year 2025
- Forecast Data until 2032
- Key Performance Indicators Impacting the Market
- Major Upcoming Developments and Projects
Key Highlights of the Report:
- Japan Proximitying Market Outlook
- Market Size of Japan Proximitying Market, 2025
- Forecast of Japan Proximitying Market, 2032
- Historical Data and Forecast of Japan Proximitying Revenues & Volume for the Period 2022-2032F
- Japan Proximitying Market Trend Evolution
- Japan Proximitying Market Drivers and Challenges
- Japan Proximitying Price Trends
- Japan Proximitying Porter's Five Forces
- Japan Proximitying Industry Life Cycle
- Historical Data and Forecast of Japan Proximitying Market Revenues & Volume By Marketing Type for the Period 2022-2032F
- Historical Data and Forecast of Japan Proximitying Market Revenues & Volume By Bluetooth Beacons for the Period 2022-2032F
- Historical Data and Forecast of Japan Proximitying Market Revenues & Volume By NFC Campaigns for the Period 2022-2032F
- Historical Data and Forecast of Japan Proximitying Market Revenues & Volume By Wi-Fi-Based Marketing for the Period 2022-2032F
- Historical Data and Forecast of Japan Proximitying Market Revenues & Volume By QR Code Engagement for the Period 2022-2032F
- Historical Data and Forecast of Japan Proximitying Market Revenues & Volume By Technology Used for the Period 2022-2032F
- Historical Data and Forecast of Japan Proximitying Market Revenues & Volume By BLE for the Period 2022-2032F
- Historical Data and Forecast of Japan Proximitying Market Revenues & Volume By Mobile Interaction for the Period 2022-2032F
- Historical Data and Forecast of Japan Proximitying Market Revenues & Volume By Geo-Fencing for the Period 2022-2032F
- Historical Data and Forecast of Japan Proximitying Market Revenues & Volume By Contextual Trigger for the Period 2022-2032F
- Historical Data and Forecast of Japan Proximitying Market Revenues & Volume By Distribution Channel for the Period 2022-2032F
- Historical Data and Forecast of Japan Proximitying Market Revenues & Volume By Online Platforms for the Period 2022-2032F
- Historical Data and Forecast of Japan Proximitying Market Revenues & Volume By Digital Agencies for the Period 2022-2032F
- Historical Data and Forecast of Japan Proximitying Market Revenues & Volume By Direct Sales for the Period 2022-2032F
- Historical Data and Forecast of Japan Proximitying Market Revenues & Volume By Marketing Software Firms for the Period 2022-2032F
- Historical Data and Forecast of Japan Proximitying Market Revenues & Volume By End User for the Period 2022-2032F
- Historical Data and Forecast of Japan Proximitying Market Revenues & Volume By Retail Chains for the Period 2022-2032F
- Historical Data and Forecast of Japan Proximitying Market Revenues & Volume By Event Management Firms for the Period 2022-2032F
- Historical Data and Forecast of Japan Proximitying Market Revenues & Volume By Entertainment Venues for the Period 2022-2032F
- Historical Data and Forecast of Japan Proximitying Market Revenues & Volume By Consumer Product Companies for the Period 2022-2032F
- Japan Proximitying Import Export Trade Statistics
- Market Opportunity Assessment By Marketing Type
- Market Opportunity Assessment By Technology Used
- Market Opportunity Assessment By Distribution Channel
- Market Opportunity Assessment By End User
- Japan Proximitying Top Companies Market Share
- Japan Proximitying Competitive Benchmarking By Technical and Operational Parameters
- Japan Proximitying Company Profiles
- Japan Proximitying Key Strategic Recommendations
Market Covered
This report examines the market across the segments below.
By Marketing Type
- Bluetooth Beacons
- NFC Campaigns
- Wi-Fi-Based Marketing
- QR Code Engagement
By Technology Used
- BLE
- Mobile Interaction
- Geo-Fencing
- Contextual Trigger
By Distribution Channel
- Online Platforms
- Digital Agencies
- Direct Sales
- Marketing Software Firms
By End User
- Retail Chains
- Event Management Firms
- Entertainment Venues
- Consumer Product Companies