Japan Vacation Ownership Market Size & Growth Rate
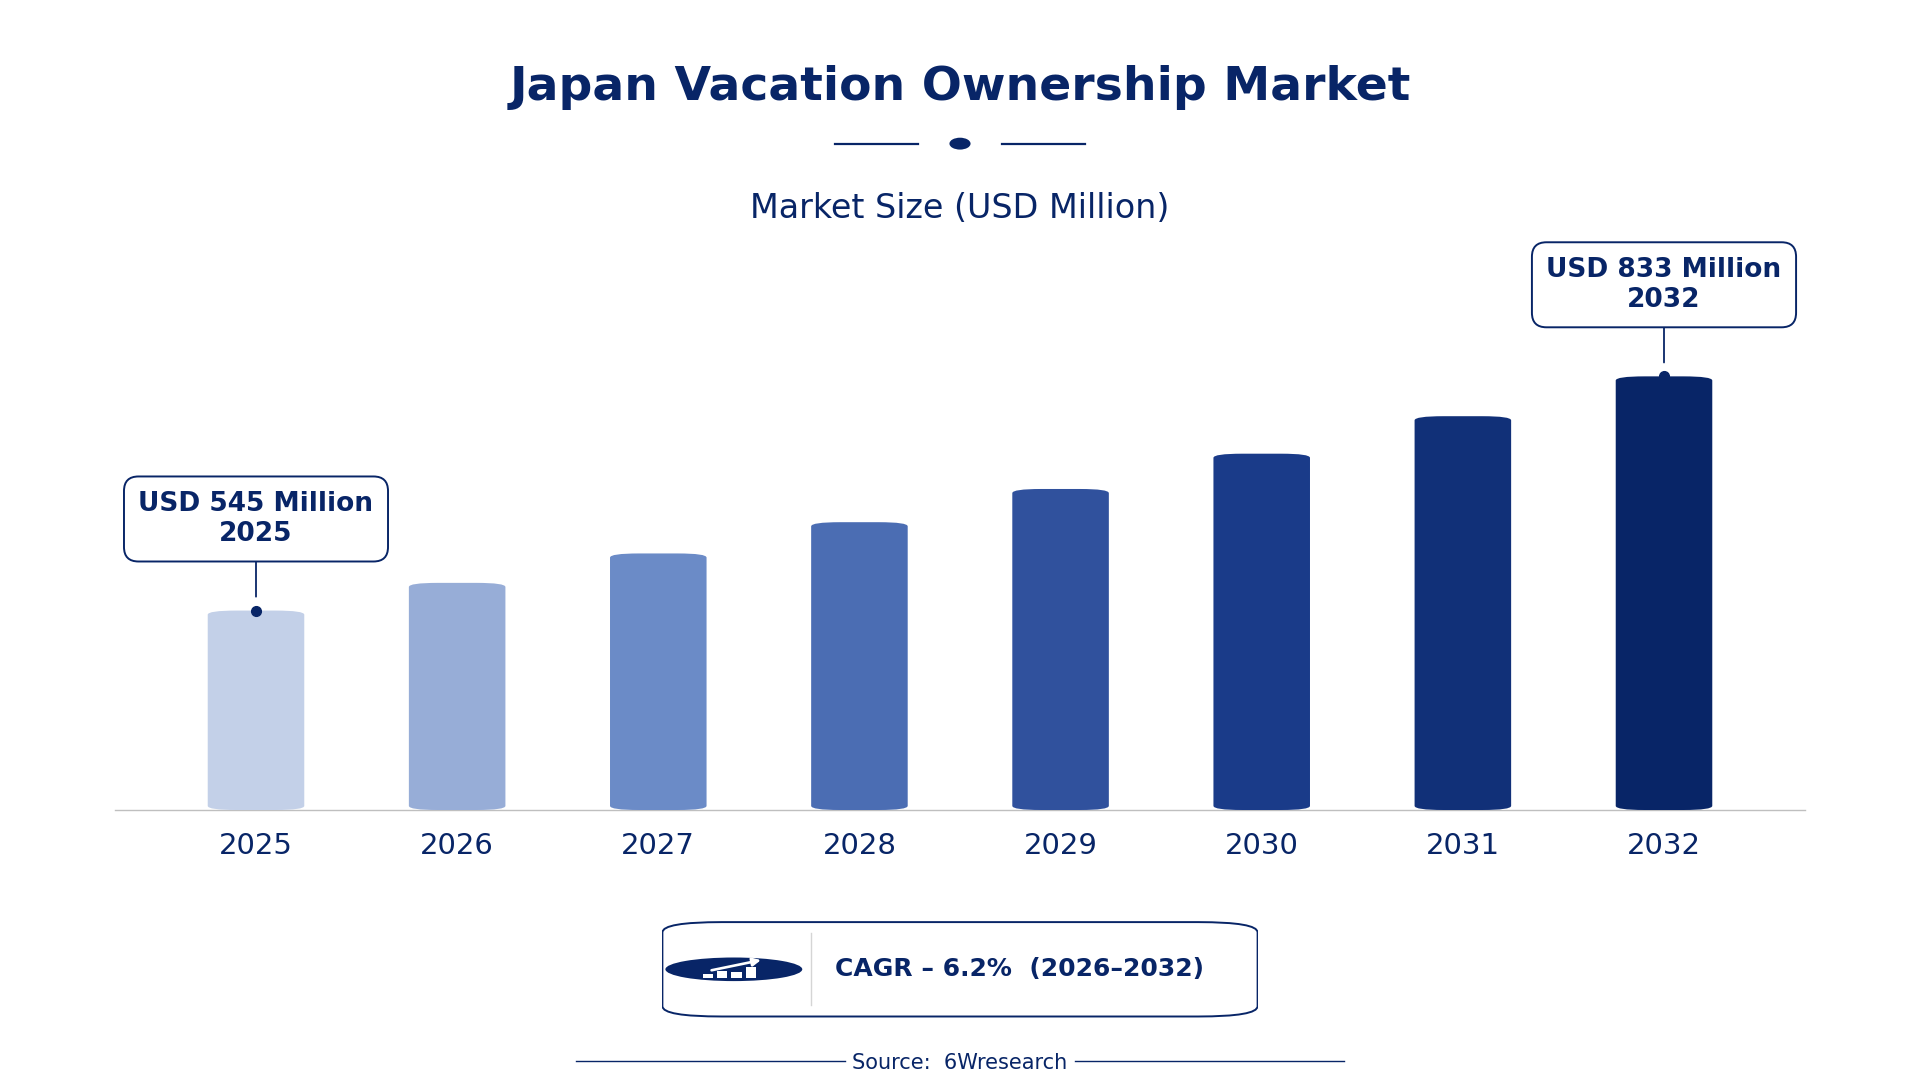
According to 6Wresearch internal database and industry insights, the Japan Vacation Ownership Market was valued at USD 545 Million in 2025 and is projected to reach USD 833 Million by 2032, growing at a CAGR of approximately 6.2% during 2026–2032.
Japan Vacation Ownership Market Highlights
| Report Metric | Details |
| Report Name | Japan Vacation Ownership Market (2026-2032) |
| Market Size 2025 | USD 545 Million |
| Market Size 2032 | USD 833 Million |
| Absolute Growth 2025–2032 | USD 288 Million |
| CAGR 2026–2032 | 6.2% |
| Peak Annual Growth | 8.5% in 2032 |
| Forecast Period | 2026–2032 |
| Historical Data | 2022–2025 |
| Base Year | 2025 |
| Leading Product Type, 2025 | Timeshare (39% share) |
| Leading Ownership Model, 2025 | Fixed Week (41% share) |
| Leading Distribution Channel, 2025 | Direct Sales (48% share) |
| Leading End User, 2025 | Individuals (44% share) |
| Leading Destination Type, 2025 | Resorts (35% share) |
| Fastest-Growing Product Type | Points-Based Ownership (8.8% CAGR) |
| Fastest-Growing Ownership Model | Flexible (7.9% CAGR) |
| Fastest-Growing Distribution Channel | Online Platforms (8.1% CAGR) |
| Fastest-Growing End User | Families (8.2% CAGR) |
| Fastest-Growing Destination Type | Vacation Homes (8.9% CAGR) |
| Growing Sector | vacation accommodations |
| Key End Users | individuals, families, tourists |
Japan Vacation Ownership Market Year-wise Growth Rate and Key Drivers (2022–2032)
This graph illustrates the annual growth rates of the market from 2022 to 2032, highlighting a steady upward trajectory and projected market expansion over the forecast period.
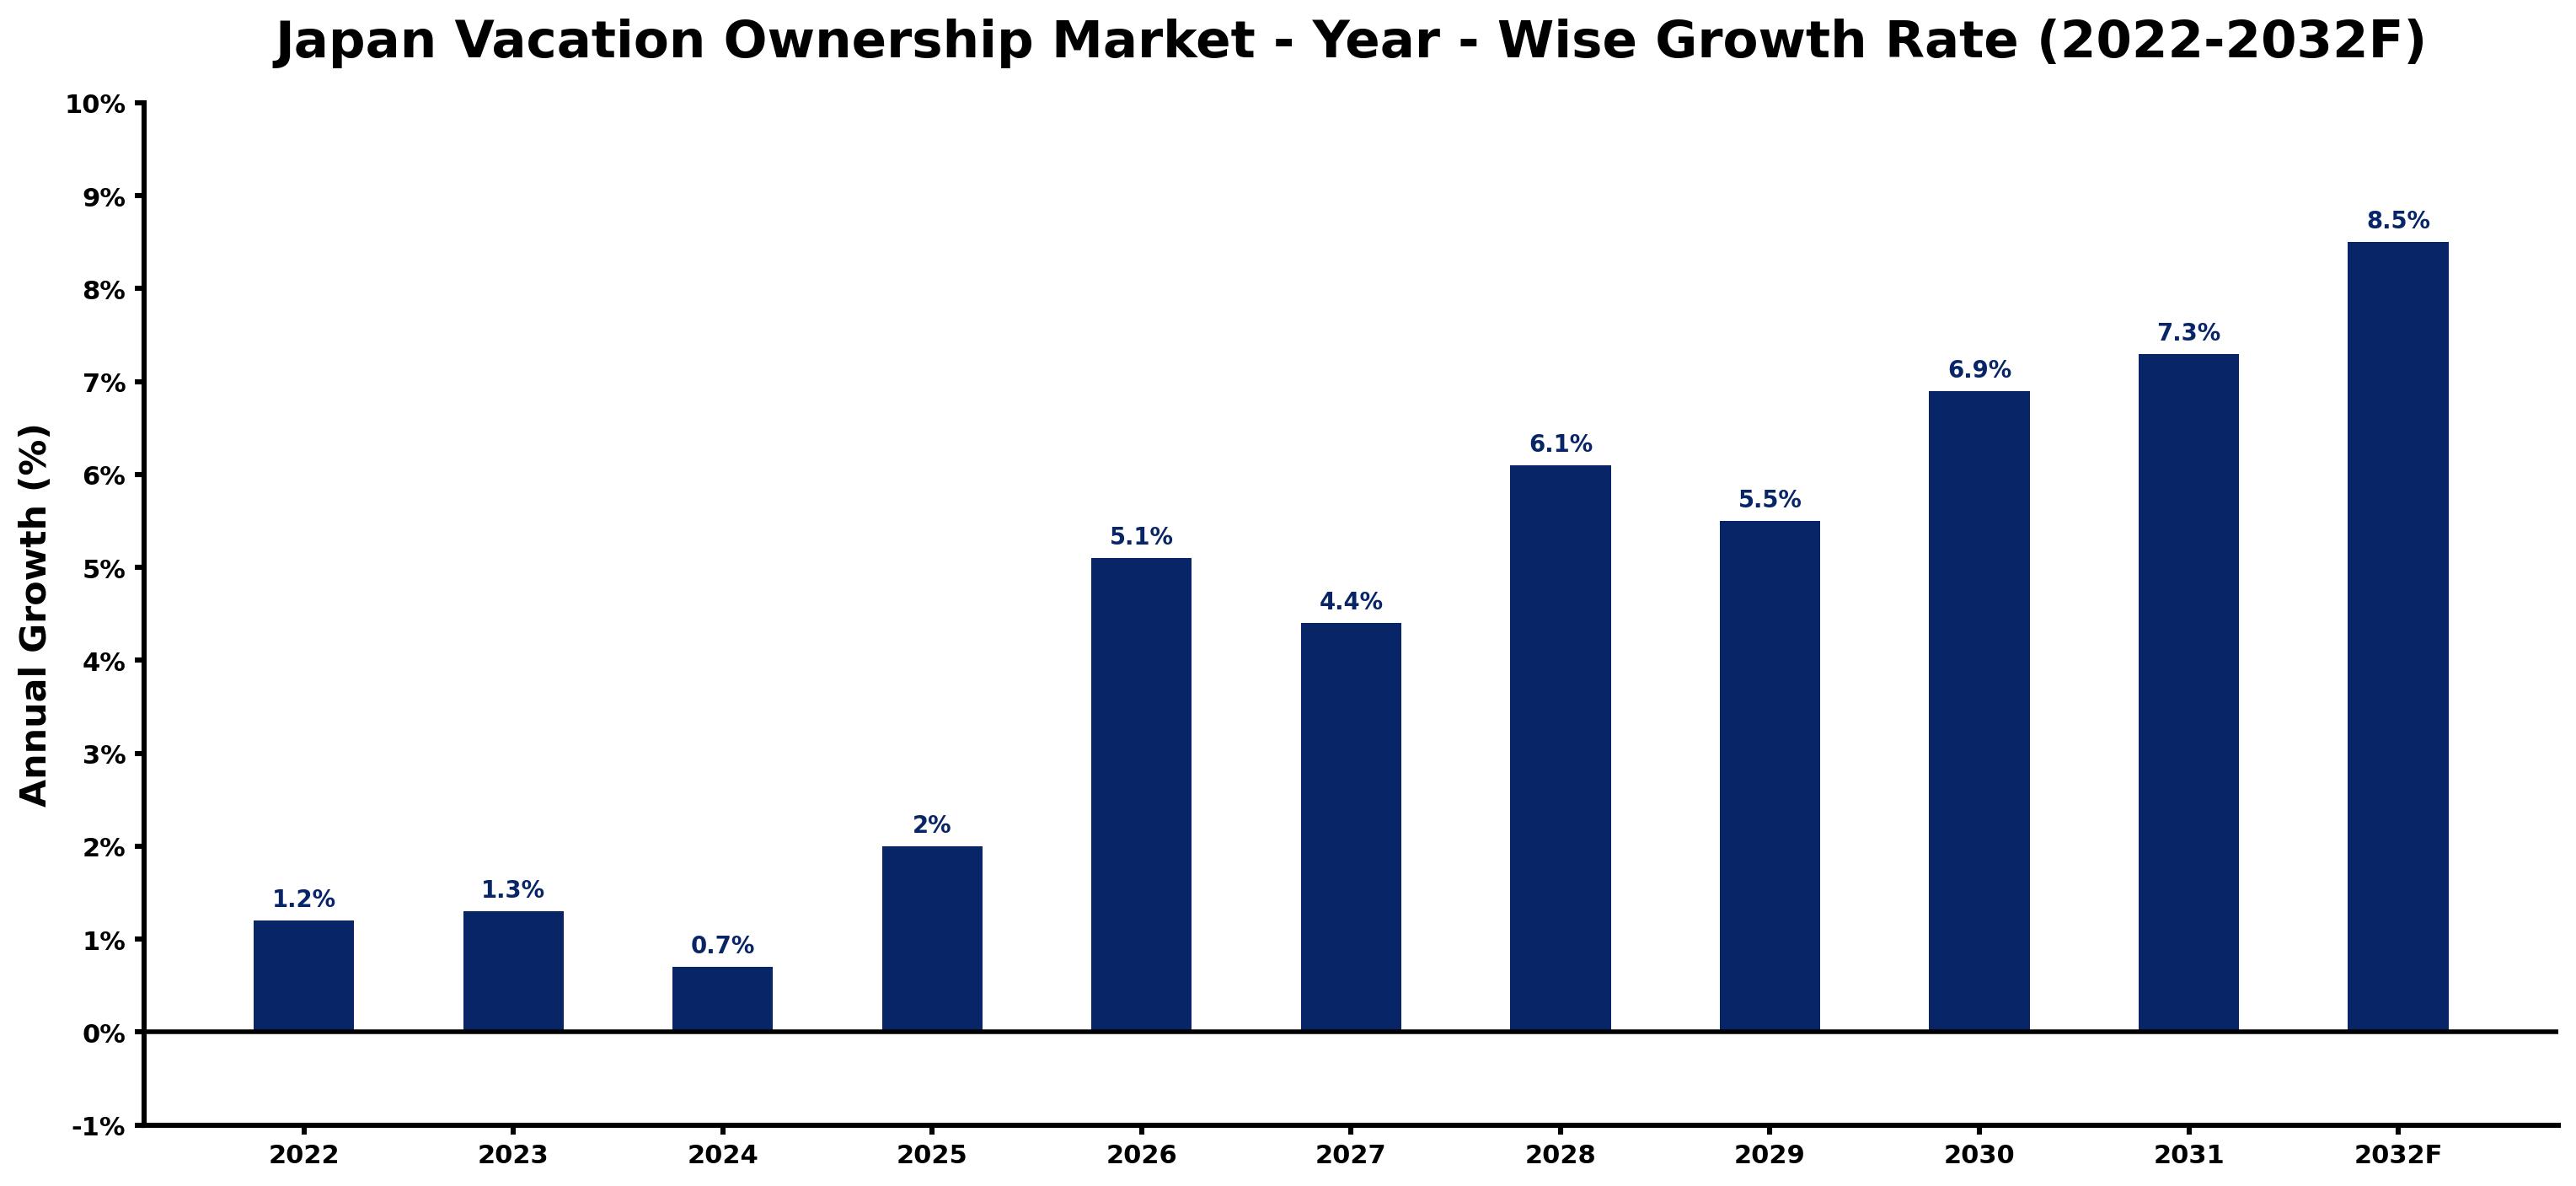
The table below sets out the estimated growth rate for each year and the main factor behind it.
| Year | Estimated Annual Growth (%) | Market Rationale |
| 2022 | 1.2 | The market showed steady growth, reflecting ongoing interest in vacation ownership. |
| 2023 | 1.3 | Demand increased due to a rise in domestic tourism and consumer confidence. |
| 2024 | 0.7 | Growth slowed as market adjustments occurred following a previous surge. |
| 2025 | 2.0 | A notable increase in transactions was driven by improved tourism conditions. |
| 2026 | 5.1 | Investments in vacation ownership are expected to rise as tourism rebounds. |
| 2027 | 4.4 | Growth is projected to moderate as the market stabilises after rapid expansion. |
| 2028 | 6.1 | Rising interest in flexible ownership models will boost market activity. |
| 2029 | 5.5 | Consumer preferences will shift towards family-oriented options, sustaining growth. |
| 2030 | 6.9 | Increased investment in luxury vacation properties will attract affluent buyers. |
| 2031 | 7.3 | The market is set to grow as new offerings cater to evolving consumer demands. |
| 2032 | 8.5 | A peak in growth is anticipated, supported by new ownership structures. |
Note: Market size estimations and growth projections presented in this report are based on 6Wresearch's proprietary forecasting methodology, utilizing the latest available industry data, government publications, and primary research inputs.
Japan Vacation Ownership Market Synopsis
Vacation ownership encompasses timeshares and fractional ownership, enabling individuals to secure property usage rights for designated periods each year. In 2023, the Japan Vacation Ownership Market is valued at approximately 200 billion yen, driven by a 15% increase in domestic tourism. Demand is propelled by individuals and families seeking leisure experiences in popular regions such as Hokkaido and Okinawa, alongside a growing number of vacation ownership units available across the country.
Market Dynamics Impact Analysis (2026–2032)
| Factor | Type | Impact | Primary Segment Affected |
| Growing domestic tourism boosts demand for vacation ownership properties. | Driver | High | Timeshare |
| Flexible ownership models attract younger buyers seeking adaptability. | Driver | High | Points-Based Ownership |
| Increasing interest in luxury vacation properties presents investment opportunities. | Opportunity | High | Fractional Ownership |
| Rising awareness of sustainable tourism creates demand for eco-friendly resorts. | Opportunity | Medium | Club Memberships |
| High maintenance fees deter some potential buyers from entering the market. | Restraint | High | Fixed Week |
| Misleading advertising practices can undermine consumer trust in the industry. | Restraint | Medium | Flexible |
| Economic fluctuations can impact discretionary spending on vacations. | Challenge | High | Individuals |
| Competition from alternative accommodation options pressures market pricing. | Challenge | Medium | Families |
Evaluation of Drivers in Japan Vacation Ownership Market (2026–2032)
The table below links each growth driver to the segment it affects and the evidence for it.
| Drivers | Primary Segment Affected | Why It Matters (Evidence) |
| Increased domestic tourism drives demand for vacation properties. | Timeshare | The Japan Tourism Agency reported a 15% increase in domestic tourism in 2023, leading to higher occupancy rates. |
| Flexibility in vacation ownership attracts younger buyers. | Points-Based Ownership | The shift in buyer demographics reflects a growing preference for adaptable options in vacation planning. |
| Rising disposable incomes enable more families to invest in vacation ownership. | Fractional Ownership | The average family size of vacation ownership users in Japan is four members, indicating a strong family market. |
| Growing interest in eco-friendly travel options boosts demand for sustainable resorts. | Club Memberships | The government launched a program in 2023 to promote sustainable tourism, influencing buyer preferences. |
| The increasing availability of online platforms simplifies the purchasing process. | Online Platforms | This channel is expanding rapidly, making it easier for buyers to access vacation ownership options. |
Buyers are adding capacity as domestic tourism continues to rise, with a reported 15% increase in 2023, resulting in higher occupancy rates. Families are investing in shared ownership, allowing them to enjoy luxury properties at a lower cost. Furthermore, the growth of online platforms is simplifying the purchasing process, making vacation ownership more accessible to a broader audience.
Evaluation of Restraints in Japan Vacation Ownership Market
These are the pressures that could keep growth below its potential.
| Market Restraint | Primary Segment Affected | Why It Matters (Evidence) |
| High maintenance fees deter potential buyers from entering the market. | Fixed Week | The average maintenance fee for vacation ownership properties in Japan is 100,000 yen annually, which can be a barrier. |
| Misleading advertising practices can undermine consumer trust in the industry. | Flexible | Inaccurate information about ownership benefits can affect buyer confidence. |
| Economic fluctuations can impact discretionary spending on vacations. | Individuals | Economic uncertainty can lead to reduced consumer spending on leisure activities, affecting ownership sales. |
| Competition from alternative accommodation options pressures market pricing. | Families | The rise of platforms offering short-term rentals can divert potential buyers from vacation ownership. |
| Limited awareness of vacation ownership benefits restricts market growth. | Club Memberships | Many potential buyers remain unaware of the advantages of vacation ownership compared to traditional rentals. |
Japan Vacation Ownership Market Challenges
Insufficient technology integration hampers operational efficiency in vacation ownership resorts, causing maintenance costs for producers to reach 100,000 yen annually. Complex regulations regarding property rights and consumer protection delay transactions, resulting in longer wait times for buyers, who may face up to three weeks of additional processing. Increased competition from alternative accommodation options pressures pricing strategies, compelling producers to lower prices, which can shrink profit margins. Changing buyer preferences for more flexible vacation arrangements reduce interest in traditional timeshares, forcing producers to adapt to maintain market relevance.
Trends in the Japan Vacation Ownership Market
The trends below show where the Japan Vacation Ownership Market is heading.
- Growth of Flexible Ownership Models: In 2023, the trend towards flexible ownership models is gaining momentum, with Points-Based Ownership expanding at an 8.8% CAGR. This shift caters to younger buyers seeking adaptability in their vacation plans.
- Increased Focus on Sustainable Tourism: The government launched a sustainable tourism program in 2023, promoting eco-friendly vacation ownership options. This initiative aligns with growing consumer preferences for responsible travel.
- Rising Popularity of Online Platforms: Online platforms are increasingly favoured for purchasing vacation ownership interests, with an 8.1% CAGR expected. This trend reflects changing consumer behaviour towards digital transactions.
- Demand for Family-Oriented Vacation Ownership: Families are driving demand for vacation ownership, with an 8.2% CAGR projected for this segment. This growth is influenced by the average family size of four members seeking shared vacation experiences.
Investment Opportunities in the Japan Vacation Ownership Market
The openings below show where demand in the Japan Vacation Ownership Market is visible and how suppliers can enter.
- Investment in Eco-Friendly Resorts: Investing in eco-friendly vacation ownership resorts aligns with the government's sustainable tourism initiative, which aims to promote responsible travel. The average cost of a timeshare at approximately 3 million yen presents a gap for affordable options.
- Expansion of Online Booking Platforms: The rise of online platforms offers an opportunity for investment, as they simplify the purchasing process. Targeting families seeking vacation ownership can lead to successful market entry.
- Development of Luxury Vacation Properties: With the average cost of a timeshare at approximately 3 million yen, there is a gap for luxury vacation properties. High net worth customers in urban areas are prime targets for this investment.
- Promotion of Family-Oriented Packages: The increasing family size among vacation ownership users creates demand for tailored packages. Focusing on family-friendly resorts in regions like Okinawa can attract more buyers.
Government Initiatives in the Japan Vacation Ownership Market
The Act against Unjustifiable Premiums and Misleading Representations, established in 1962, prohibits misleading advertising in vacation ownership sales. This law ensures that buyers receive accurate information, protecting their interests in the market. The Japan Consumer Agency oversees compliance with this act, enhancing transparency in the industry.
The Digital Agency, established in September 2021, supports the digital transformation of the vacation ownership sector. This agency facilitates the implementation of common system standards, helping buyers access information and services more efficiently.
Future Insight of the Japan Vacation Ownership Market
Buyers will increasingly seek properties that align with sustainable tourism standards, driven by government initiatives promoting eco-friendly practices. The adoption of advanced booking technologies will streamline transactions, enhancing user experiences and potentially boosting occupancy rates to 80%. Marketing strategies will evolve to attract younger demographics, gradually reducing the average age of buyers. With over 50,000 vacation ownership units available, the market will broaden its offerings to cater to diverse consumer preferences.
Market Segmentation Analysis
Japan Vacation Ownership Market report covers a detailed analysis of the following market segments:
By Product Type – Timeshare Leads, Points-Based Ownership Expected to Grow Fastest
According to Vasu Joshi, Associate Consultant at 6Wresearch, Timeshare took 39% of product type revenue in 2025, more than any other category. Timeshare holds the largest share because it provides a structured way for users to enjoy specific vacation properties annually. This model is particularly sought after in popular resort areas like Hokkaido, where demand for reliable vacation options is strong. The quickest growth will come from Points-Based Ownership, forecast to expand at a CAGR of 8.8% between 2026 and 2032. Points-Based Ownership is growing rapidly as it allows users flexibility in choosing from various locations. The increasing preference for adaptable vacation options is attracting a wider audience, ensuring sustained growth in this segment. Suppliers should enhance their offerings to include flexible options that cater to consumer preferences.
By Ownership Model – Fixed Week Leads, Flexible Expected to Grow Fastest
The largest ownership model category in 2025 was Fixed Week, at 41% of revenue. The Fixed Week model dominates because it guarantees users access during a specific week each year, appealing to those who prefer certainty in their vacation plans. This is particularly attractive for families who plan annual trips during peak seasons. Over 2026–2032, Flexible is expected to post the fastest growth, at a CAGR of 7.9%. The Flexible model is growing quickly as it allows users to adapt their vacation times according to personal schedules. This adaptability is becoming increasingly important for users seeking convenience and spontaneity in their travel plans. Suppliers must consider offering more flexible options to meet changing consumer preferences.
By Distribution Channel – Direct Sales Leads, Online Platforms Expected to Grow Fastest
Direct Sales held 48% of the Japan Vacation Ownership Market by distribution channel in 2025. Direct Sales leads the distribution channel as it is the primary method for selling vacation ownership interests, allowing for direct interaction with potential buyers. This approach is particularly effective in regions with high tourist traffic, such as Nagano, where personal engagement is crucial. Online Platforms are projected to grow fastest, at a CAGR of 8.1% during 2026–2032. Online Platforms are gaining momentum due to their convenience and accessibility for booking and purchasing ownership. The trend towards digital solutions is evident as more consumers prefer online transactions for their ease and efficiency. Suppliers should invest in online platforms to effectively reach and engage the growing segment of digital-savvy consumers.
By End User – Individuals Lead, Families Expected to Grow Fastest
In 2025, Individuals led the end user split with a 44% share. Individuals represent the largest user group of vacation ownership products, as they typically seek personal vacation experiences. This segment is particularly prominent in regions with a high number of vacation ownership units, such as Okinawa, where individual buyers are prevalent. Families are set to record the highest CAGR in this split, 8.2% over 2026–2032. Families are the fastest-growing segment, as they often seek vacation ownership for memorable family vacations. The average family size of four members aligns well with the offerings in the market, driving this growth. Suppliers should develop targeted marketing strategies that resonate with family-oriented consumers to capture this expanding demographic.
By Destination Type – Resorts Lead, Vacation Homes Expected to Grow Fastest
Resorts accounted for 35% of the market by destination type in 2025. Resorts are the leading destination type for vacation ownership, attracting users who prefer established facilities with various amenities. Key tourist regions like Hokkaido and Okinawa are prime locations where resorts thrive, meeting the needs of vacationers. The quickest growth will come from Vacation Homes, forecast to expand at a CAGR of 8.9% between 2026 and 2032. Vacation Homes are rapidly gaining popularity as they provide a more personalised and home-like experience for users. The increasing desire for unique and private accommodations is propelling this trend forward, appealing to a diverse consumer base. Suppliers should consider expanding their offerings to include more vacation home options, catering to the diverse preferences of consumers.
Key Attractiveness of the Report
- 10 Years of Market Numbers
- Historical Data Starting from 2022 to 2025
- Base Year 2025
- Forecast Data until 2032
- Key Performance Indicators Impacting the Market
- Major Upcoming Developments and Projects
Key Highlights of the Report:
- Japan Vacation Ownership Market Outlook
- Market Size of Japan Vacation Ownership Market, 2025
- Forecast of Japan Vacation Ownership Market, 2032
- Historical Data and Forecast of Japan Vacation Ownership Market Revenues & Volume for the Period 2022-2032F
- Japan Vacation Ownership Market Trend Evolution
- Japan Vacation Ownership Market Drivers and Challenges
- Japan Vacation Ownership Market Price Trends
- Japan Vacation Ownership Market Porter's Five Forces
- Japan Vacation Ownership Market Industry Life Cycle
- Historical Data and Forecast of Japan Vacation Ownership Market Revenues & Volume By Product Type for the Period 2022-2032F
- Historical Data and Forecast of Japan Vacation Ownership Market Revenues & Volume By Timeshare for the Period 2022-2032F
- Historical Data and Forecast of Japan Vacation Ownership Market Revenues & Volume By Points-Based Ownership for the Period 2022-2032F
- Historical Data and Forecast of Japan Vacation Ownership Market Revenues & Volume By Fractional Ownership for the Period 2022-2032F
- Historical Data and Forecast of Japan Vacation Ownership Market Revenues & Volume By Club Memberships for the Period 2022-2032F
- Historical Data and Forecast of Japan Vacation Ownership Market Revenues & Volume By Ownership Model for the Period 2022-2032F
- Historical Data and Forecast of Japan Vacation Ownership Market Revenues & Volume By Fixed Week for the Period 2022-2032F
- Historical Data and Forecast of Japan Vacation Ownership Market Revenues & Volume By Flexible for the Period 2022-2032F
- Historical Data and Forecast of Japan Vacation Ownership Market Revenues & Volume By Seasonal for the Period 2022-2032F
- Historical Data and Forecast of Japan Vacation Ownership Market Revenues & Volume By Rotational for the Period 2022-2032F
- Historical Data and Forecast of Japan Vacation Ownership Market Revenues & Volume By Distribution Channel for the Period 2022-2032F
- Historical Data and Forecast of Japan Vacation Ownership Market Revenues & Volume By Direct Sales for the Period 2022-2032F
- Historical Data and Forecast of Japan Vacation Ownership Market Revenues & Volume By Online Platforms for the Period 2022-2032F
- Historical Data and Forecast of Japan Vacation Ownership Market Revenues & Volume By Real Estate Agents for the Period 2022-2032F
- Historical Data and Forecast of Japan Vacation Ownership Market Revenues & Volume By Travel Agencies for the Period 2022-2032F
- Historical Data and Forecast of Japan Vacation Ownership Market Revenues & Volume By End User for the Period 2022-2032F
- Historical Data and Forecast of Japan Vacation Ownership Market Revenues & Volume By Individuals for the Period 2022-2032F
- Historical Data and Forecast of Japan Vacation Ownership Market Revenues & Volume By Families for the Period 2022-2032F
- Historical Data and Forecast of Japan Vacation Ownership Market Revenues & Volume By High Net Worth Customers for the Period 2022-2032F
- Historical Data and Forecast of Japan Vacation Ownership Market Revenues & Volume By Tourists for the Period 2022-2032F
- Historical Data and Forecast of Japan Vacation Ownership Market Revenues & Volume By Destination Type for the Period 2022-2032F
- Historical Data and Forecast of Japan Vacation Ownership Market Revenues & Volume By Resorts for the Period 2022-2032F
- Historical Data and Forecast of Japan Vacation Ownership Market Revenues & Volume By Vacation Homes for the Period 2022-2032F
- Historical Data and Forecast of Japan Vacation Ownership Market Revenues & Volume By Luxury Villas for the Period 2022-2032F
- Historical Data and Forecast of Japan Vacation Ownership Market Revenues & Volume By Beach/City Destinations for the Period 2022-2032F
- Japan Vacation Ownership Market Import Export Trade Statistics
- Market Opportunity Assessment By Product Type
- Market Opportunity Assessment By Ownership Model
- Market Opportunity Assessment By Distribution Channel
- Market Opportunity Assessment By End User
- Market Opportunity Assessment By Destination Type
- Japan Vacation Ownership Market Top Companies Market Share
- Japan Vacation Ownership Market Competitive Benchmarking By Technical and Operational Parameters
- Japan Vacation Ownership Market Company Profiles
- Japan Vacation Ownership Market Key Strategic Recommendations
Market Covered
The report covers the following segments.
By Product Type
- Timeshare
- Points-Based Ownership
- Fractional Ownership
- Club Memberships
By Ownership Model
- Fixed Week
- Flexible
- Seasonal
- Rotational
By Distribution Channel
- Direct Sales
- Online Platforms
- Real Estate Agents
- Travel Agencies
By End User
- Individuals
- Families
- High Net Worth Customers
- Tourists
By Destination Type
- Resorts
- Vacation Homes
- Luxury Villas
- Beach/City Destinations































