Japan Visual Computing Market Size & Growth Rate
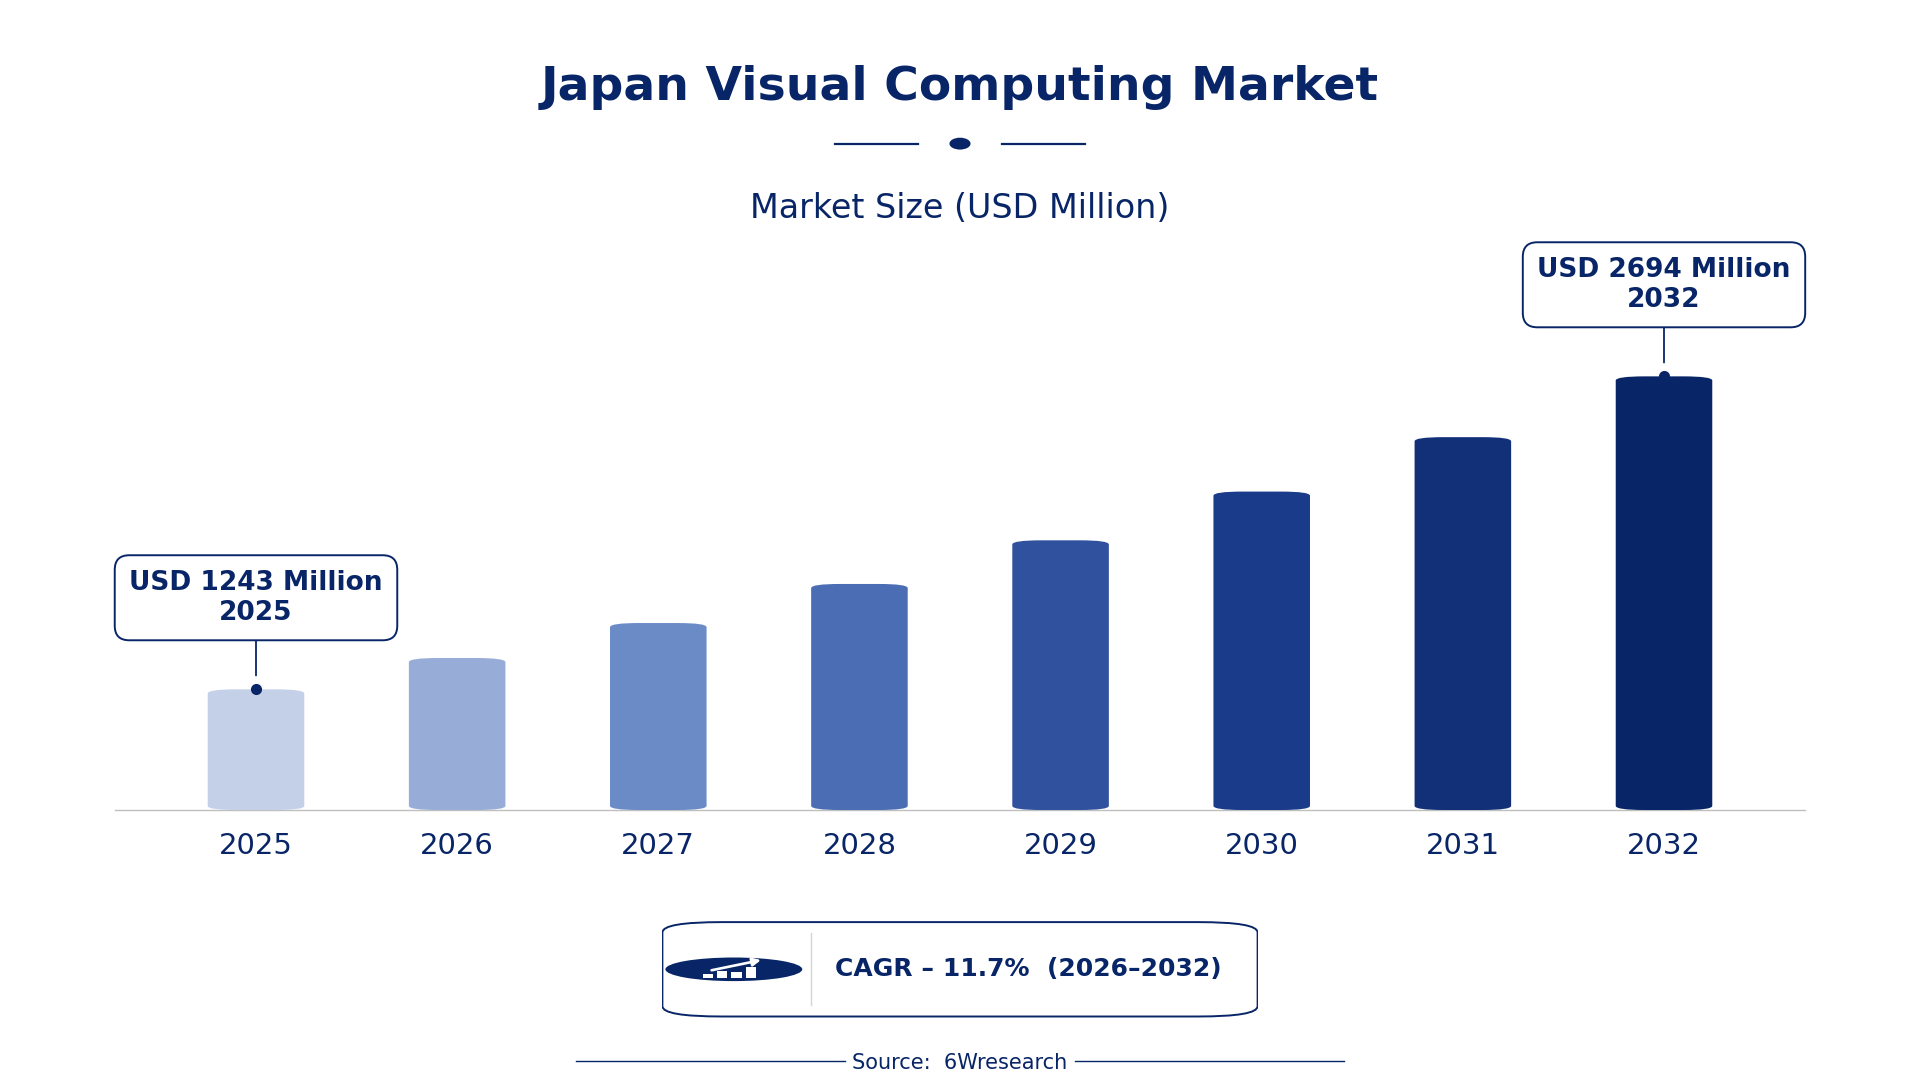
According to 6Wresearch internal database and industry insights, the Japan Visual Computing Market was valued at USD 1,243 Million in 2025 and is projected to reach USD 2,694 Million by 2032, growing at a CAGR of approximately 11.7% during 2026–2032.
Japan Visual Computing Market Highlights
| Report Metric | Details |
| Report Name | Japan Visual Computing Market (2026-2032) |
| Market Size 2025 | USD 1,243 Million |
| Market Size 2032 | USD 2,694 Million |
| Absolute Growth 2025–2032 | USD 1,451 Million |
| CAGR 2026–2032 | 11.7% |
| Peak Annual Growth | 12.6% in 2030 |
| Forecast Period | 2026–2032 |
| Historical Data | 2022–2025 |
| Base Year | 2025 |
| Leading Type, 2025 | Interactive Whiteboard (37% share) |
| Leading Application, 2025 | Gaming (35% share) |
| Fastest-Growing Type | Interactive Kiosk (16.3% CAGR) |
| Fastest-Growing Application | Healthcare (16.1% CAGR) |
| Growing Sector | Education and Entertainment |
| Key End Users | Educational institutions, healthcare providers, gaming companies, corporate offices |
Japan Visual Computing Market Year-wise Growth Rate and Key Drivers (2022–2032)
This graph illustrates the annual growth rates of the market from 2022 to 2032, highlighting a steady upward trajectory and projected market expansion over the forecast period.
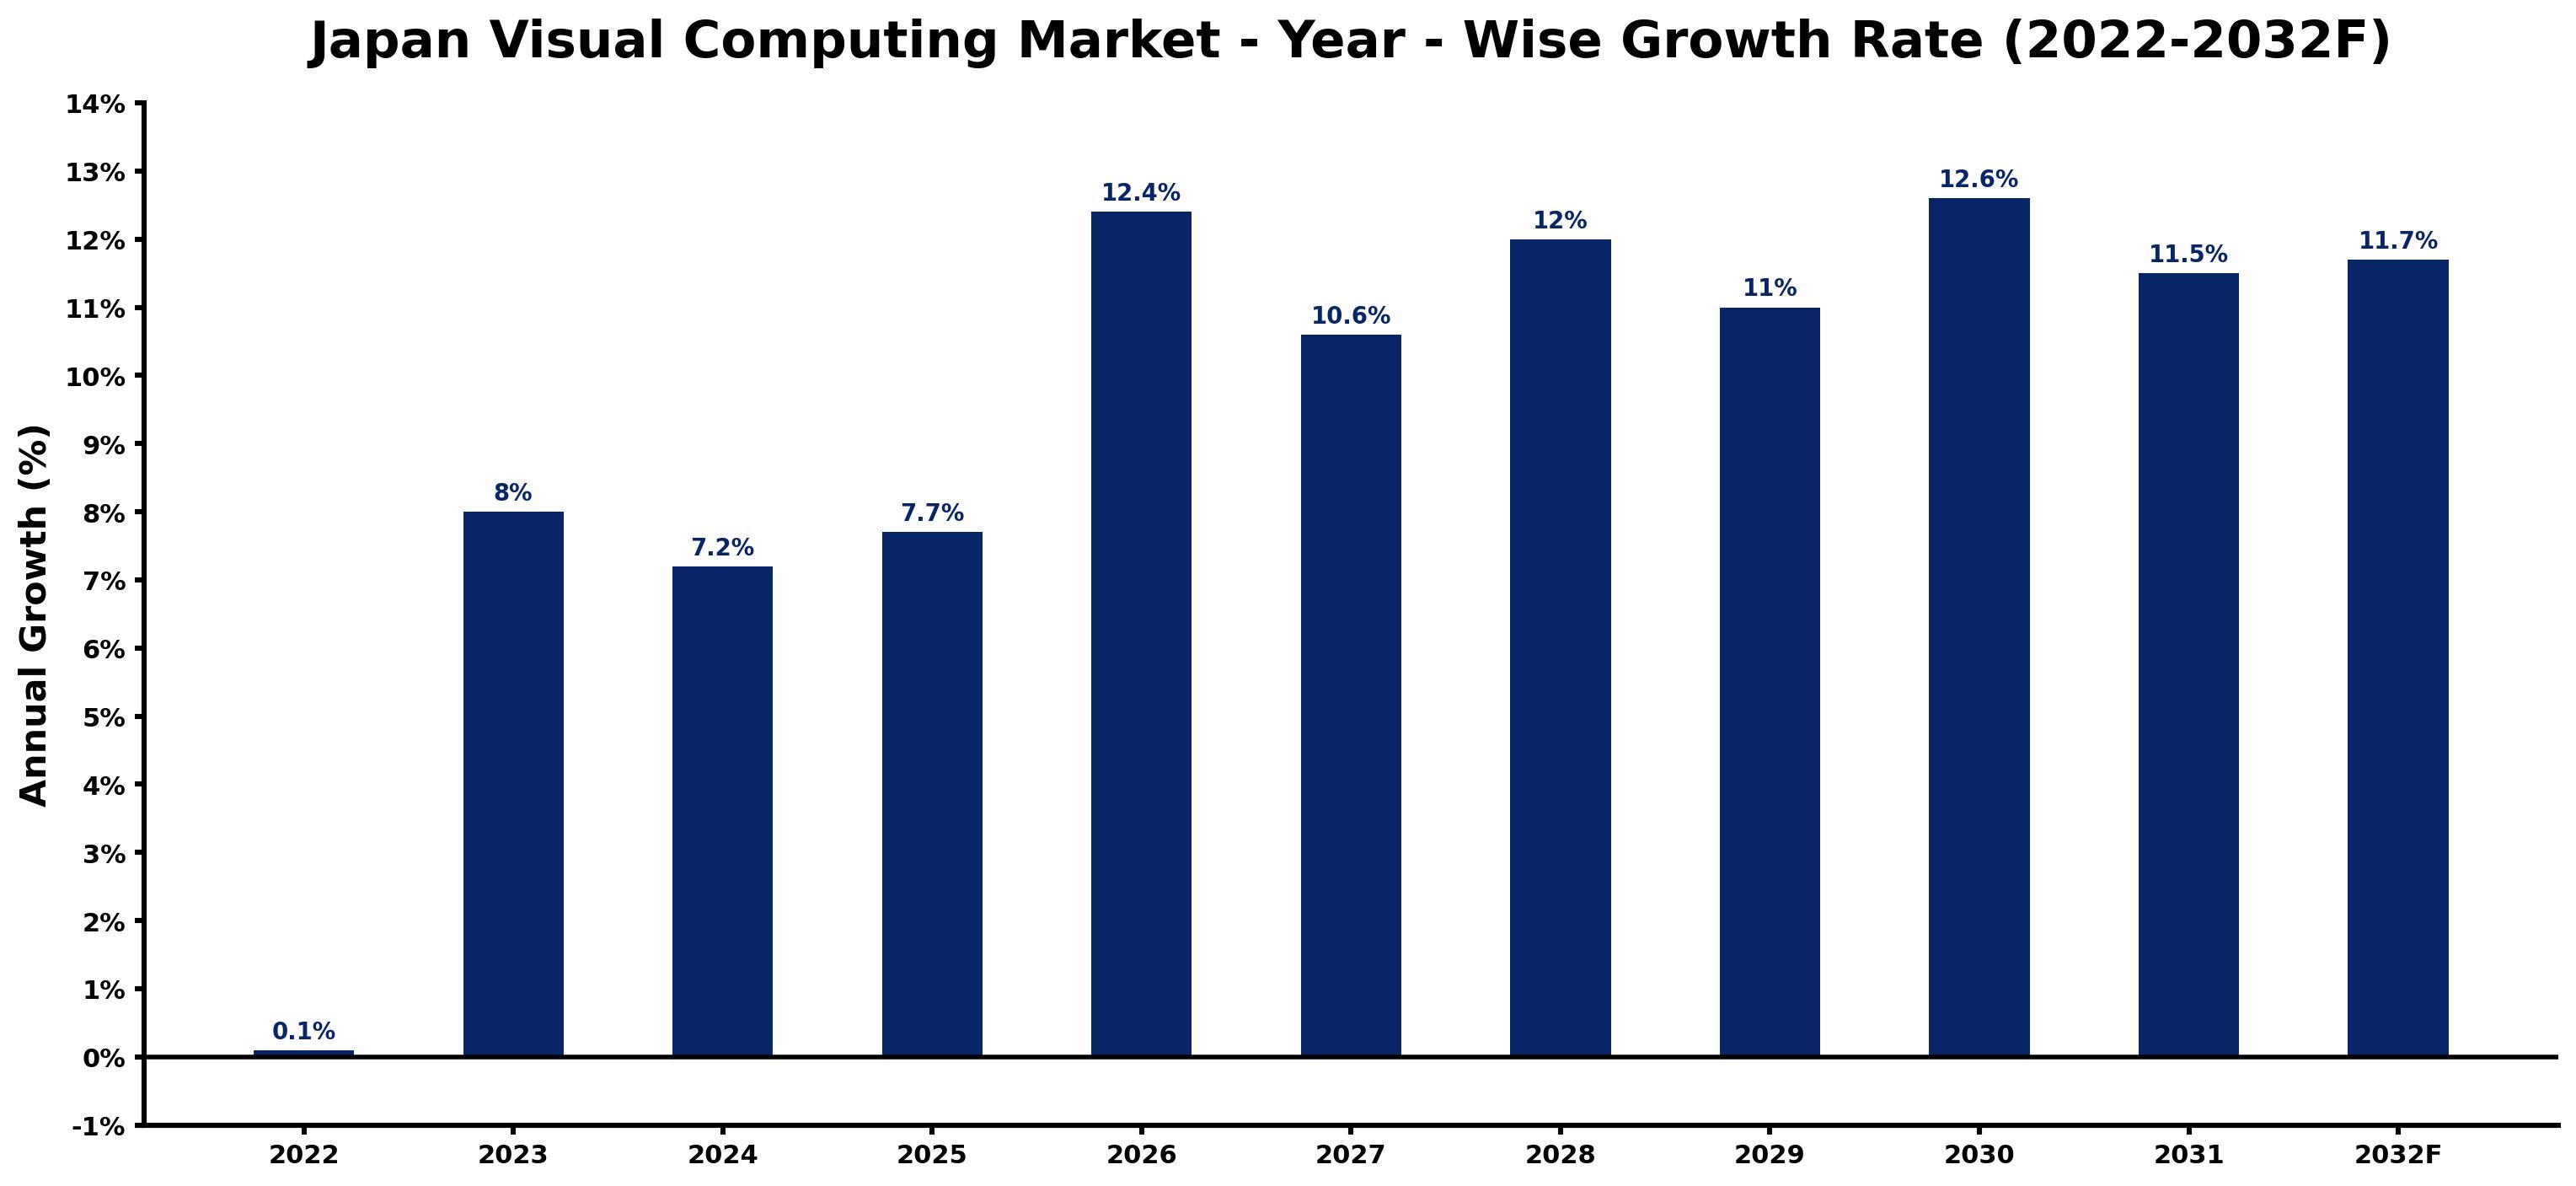
Below, each year's estimated growth is shown next to the factor that most influenced it.
| Year | Estimated Annual Growth (%) | Market Rationale |
| 2022 | 0.1 | The market showed minimal growth due to limited adoption of new technologies. |
| 2023 | 8.0 | Growth accelerated as educational institutions increased investments in interactive technologies. |
| 2024 | 7.2 | A slowdown occurred as market saturation began to affect growth rates. |
| 2025 | 7.7 | Demand rose again as more sectors adopted visual computing solutions for productivity. |
| 2026 | 12.4 | Growth is expected to surge as the gaming industry expands, driving demand for high-performance technologies. |
| 2027 | 10.6 | A slowdown will follow as the market adjusts to previous rapid growth. |
| 2028 | 12.0 | Demand is projected to increase again as corporate environments adopt more interactive displays. |
| 2029 | 11.0 | Growth is expected to slow as the market matures and competition intensifies. |
| 2030 | 12.6 | The market is projected to peak with substantial investments in advanced visual computing technologies. |
| 2031 | 11.5 | A slight slowdown will occur as the market stabilises after peak growth. |
| 2032 | 11.7 | Growth is expected to resume as new applications in healthcare and education emerge. |
Note: Market size estimations and growth projections presented in this report are based on 6Wresearch's proprietary forecasting methodology, utilizing the latest available industry data, government publications, and primary research inputs.
Japan Visual Computing Market Synopsis
Visual computing encompasses technologies that facilitate user interaction with digital content through sophisticated displays and software algorithms. The Japan Visual Computing Market thrives on the gaming industry, which generated approximately 1.5 trillion yen in 2022, alongside considerable investments in education and corporate environments. Demand is further bolstered by the integration of interactive technologies in retail and healthcare, enhancing user engagement across multiple sectors.
Market Dynamics Impact Analysis (2026–2032)
| Factor | Type | Impact | Primary Segment Affected |
| Increased adoption of interactive technologies in educational institutions | Driver | High | Interactive Whiteboard |
| Rising demand for immersive experiences in gaming and entertainment | Driver | High | Gaming |
| Growing installations of interactive kiosks in urban areas | Opportunity | High | Interactive Kiosk |
| Expansion of visual computing applications in healthcare | Opportunity | High | Healthcare |
| Market saturation in certain segments limiting growth potential | Restraint | Medium | Interactive Whiteboard |
| High costs associated with advanced visual computing technologies | Restraint | Medium | Gaming |
| Competition from alternative technologies affecting market share | Challenge | High | Interactive Kiosk |
| Rapid technological advancements leading to obsolescence | Challenge | Medium | Interactive Video Wall |
Evaluation of Drivers in Japan Visual Computing Market (2026–2032)
Below are the drivers that matter most for revenue growth, with supporting evidence.
| Drivers | Primary Segment Affected | Why It Matters (Evidence) |
| Investment in interactive whiteboards by educational institutions | Interactive Whiteboard | Over 1 million units installed in schools as of 2023, driving demand for improved learning experiences. |
| Growth of the gaming industry requiring advanced visual technologies | Gaming | Japan's gaming industry generated approximately 1.5 trillion yen in 2022, increasing demand for high-performance solutions. |
| Deployment of interactive kiosks in urban areas | Interactive Kiosk | Thousands of kiosks are found in shopping centers and transportation hubs, boosting customer engagement. |
| Adoption of interactive video walls in corporate environments | Interactive Video Wall | Increasing installations in major cities like Tokyo and Osaka improve presentation and advertising capabilities. |
| Rising use of visual computing in healthcare for telemedicine | Healthcare | Over 10 million patients served annually, increasing the demand for effective patient interaction technologies. |
Volumes grow on the back of substantial investments in educational technologies, with over 1 million interactive whiteboards installed in schools as of 2023. The gaming industry, generating approximately 1.5 trillion yen in 2022, fuels demand for advanced visual computing solutions. Urban areas have seen thousands of interactive kiosks deployed in shopping centers, boosting customer engagement. The healthcare sector is increasingly utilising visual computing for telemedicine applications, serving over 10 million patients annually, which raises the need for effective technologies. Corporate environments are adopting interactive video walls to improve presentations and advertising capabilities, reflecting a shift towards more engaging visual displays.
Evaluation of Restraints in Japan Visual Computing Market
The following restraints limit how fast demand can grow.
| Market Restraint | Primary Segment Affected | Why It Matters (Evidence) |
| Market saturation in educational institutions limiting further growth | Interactive Whiteboard | As over 1 million units are already installed, new installations are decreasing, affecting growth rates. |
| High costs of advanced visual computing technologies hindering adoption | Gaming | The gaming industry faces rising expenses in upgrading to high-performance visual computing solutions. |
| Competition from alternative technologies reducing market share | Interactive Kiosk | Emerging technologies provide similar functionalities, challenging the adoption of traditional kiosks. |
| Rapid technological advancements leading to obsolescence | Interactive Video Wall | Frequent updates in technology can render existing solutions outdated, affecting buyer confidence. |
| Limited awareness of visual computing benefits in certain sectors | Healthcare | Some healthcare providers remain hesitant to invest in visual computing due to lack of understanding. |
Japan Visual Computing Market Challenges
Producers of visual computing technologies encounter supply chain disruptions due to reliance on imported components, resulting in cost increases of 15% for manufacturers and delays in product launches. Competition from low-cost alternatives in neighbouring countries pressures local firms, potentially reducing market share by 20% for domestic suppliers. Regulatory hurdles related to the ISO 9241 standard impose compliance costs exceeding 10 million yen annually for companies adapting their products. Rapid technological advancements necessitate continuous investment, straining budgets and delaying innovation timelines for producers in this sector.
Trends in the Japan Visual Computing Market
The following changes are redrawing the Japan Visual Computing Market.
- Retailers Increasing Interactive Kiosk Deployments: Retailers are deploying interactive kiosks for customer engagement, with thousands installed in urban shopping centers. This shift highlights the need for improved customer experiences, particularly in major cities.
- Healthcare Providers Integrating Telemedicine Solutions: Healthcare providers are utilising visual computing for telemedicine applications, serving over 10 million patients annually. This trend underscores the growing importance of technology in patient interaction and care.
- Corporate Offices Upgrading to Interactive Video Walls: Corporate offices are adopting interactive video walls for presentations, particularly in cities like Osaka. This change reflects a growing demand for engaging visual displays in professional settings.
- Gaming Industry Demanding Advanced Visual Solutions: The gaming industry is driving demand for high-performance visual computing technologies, generating approximately 1.5 trillion yen in 2022. This trend highlights the importance of advanced solutions in improving user experiences.
Investment Opportunities in the Japan Visual Computing Market
The opportunities below stand out in the Japan Visual Computing Market for new entrants and existing suppliers.
- Urban Areas Expanding Interactive Kiosk Deployments: Urban areas are experiencing a surge in interactive kiosk installations, with thousands already deployed. This presents an opportunity for suppliers to improve customer engagement in retail and public spaces.
- Healthcare Sector Increasing Demand for Telemedicine Technologies: The healthcare sector is seeing a rise in telemedicine applications, serving over 10 million patients annually. Suppliers can invest in visual computing solutions tailored for patient interaction.
- Corporate Offices Upgrading Visual Display Technologies: Corporate environments are increasingly adopting interactive video walls for presentations, particularly in cities like Tokyo. This presents an opportunity for suppliers to provide advanced visual solutions.
- Gaming Industry Seeking High-Performance Visual Computing Solutions: The gaming industry generated approximately 1.5 trillion yen in 2022, creating a demand for advanced visual computing technologies. Suppliers can focus on high-performance solutions to meet this growing need.
Government Initiatives in the Japan Visual Computing Market
The Next-Generation Medical Infrastructure Act, enacted in 2017, updates previous laws by allowing certified bodies to anonymise medical data for research purposes. This measure supports the integration of visual computing in healthcare by facilitating data-driven innovations and the development of new applications.
The Pharmaceuticals and Medical Devices Agency (PMDA) oversees the approval of medical devices, ensuring safety and efficacy. This agency plays a critical role in approving visual computing applications in healthcare, supporting advancements in telemedicine and patient interaction.
Future Insight of the Japan Visual Computing Market
The rollout of interactive kiosks in urban areas will transform customer engagement by 2032 as technology progresses. By 2025, the Ministry of Education's initiatives will lead to over 1 million interactive whiteboards in classrooms, enriching educational interactions. The healthcare sector will witness a rise in telemedicine applications, serving over 10 million patients annually as visual computing becomes essential for remote consultations. Robotics in manufacturing will increasingly adopt visual computing solutions, with productivity gains projected at 25% by 2030.
Market Segmentation Analysis
Japan Visual Computing Market report covers a detailed analysis of the following market segments:
By Type – Interactive Whiteboard Leads, Interactive Kiosk Expected to Grow Fastest
According to Bhawna Singh, Assistant Manager at 6Wresearch, with 37% of type revenue in 2025, Interactive Whiteboard was the largest category. The interactive whiteboard segment holds the largest share due to its extensive installation in over 1 million schools across Japan, facilitating interactive learning. This widespread adoption is further encouraged by government initiatives aimed at integrating technology into educational environments. Interactive Kiosk is set to record the highest CAGR in this split, 16.3% over 2026–2032. The interactive kiosk segment is experiencing rapid growth, driven by the deployment of thousands of units in urban retail and public spaces, meeting consumer demands for information and services. As urbanisation continues, the need for these kiosks is projected to expand significantly. Suppliers should focus on developing interactive kiosks to meet the increasing demand in urban areas.
By Application – Gaming Leads, Healthcare Expected to Grow Fastest
Gaming accounted for 35% of the market by application in 2025. The gaming application dominates the market, generating around 1.5 trillion yen in 2022, highlighting the strong demand for high-performance visual computing solutions in this sector. This substantial revenue underscores the gaming industry's pivotal role in advancing visual computing technologies. Healthcare is projected to grow fastest, at a CAGR of 16.1% during 2026–2032. The healthcare application is the fastest-growing segment, with over 10 million patients served annually through telemedicine, reflecting a rising dependence on visual computing for patient interactions. This trend is likely to accelerate as the healthcare sector embraces advanced technologies. Buyers in the healthcare sector should invest in visual computing solutions to enhance patient engagement and service delivery.
Key Attractiveness of the Report
- 10 Years of Market Numbers
- Historical Data Starting from 2022 to 2025
- Base Year 2025
- Forecast Data until 2032
- Key Performance Indicators Impacting the Market
- Major Upcoming Developments and Projects
Key Highlights of the Report:
- Japan Visual Computing Market Outlook
- Market Size of Japan Visual Computing Market, 2025
- Forecast of Japan Visual Computing Market, 2032
- Historical Data and Forecast of Japan Visual Computing Revenues & Volume for the Period 2022-2032
- Japan Visual Computing Market Trend Evolution
- Japan Visual Computing Market Drivers and Challenges
- Japan Visual Computing Price Trends
- Japan Visual Computing Porter's Five Forces
- Japan Visual Computing Industry Life Cycle
- Historical Data and Forecast of Japan Visual Computing Market Revenues & Volume By Type for the Period 2022-2032
- Historical Data and Forecast of Japan Visual Computing Market Revenues & Volume By Interactive Whiteboard for the Period 2022-2032
- Historical Data and Forecast of Japan Visual Computing Market Revenues & Volume By Interactive Kiosk for the Period 2022-2032
- Historical Data and Forecast of Japan Visual Computing Market Revenues & Volume By Interactive Table for the Period 2022-2032
- Historical Data and Forecast of Japan Visual Computing Market Revenues & Volume By Interactive Video Wall for the Period 2022-2032
- Historical Data and Forecast of Japan Visual Computing Market Revenues & Volume By Monitor for the Period 2022-2032
- Historical Data and Forecast of Japan Visual Computing Market Revenues & Volume By Others for the Period 2022-2032
- Historical Data and Forecast of Japan Visual Computing Market Revenues & Volume By Application for the Period 2022-2032
- Historical Data and Forecast of Japan Visual Computing Market Revenues & Volume By Gaming for the Period 2022-2032
- Historical Data and Forecast of Japan Visual Computing Market Revenues & Volume By Media and Entertainment for the Period 2022-2032
- Historical Data and Forecast of Japan Visual Computing Market Revenues & Volume By Healthcare for the Period 2022-2032
- Historical Data and Forecast of Japan Visual Computing Market Revenues & Volume By Automotive for the Period 2022-2032
- Historical Data and Forecast of Japan Visual Computing Market Revenues & Volume By Manufacturing for the Period 2022-2032
- Historical Data and Forecast of Japan Visual Computing Market Revenues & Volume By Defense and Intelligence for the Period 2022-2032
- Historical Data and Forecast of Japan Visual Computing Market Revenues & Volume By Others for the Period 2022-2032
- Japan Visual Computing Import Export Trade Statistics
- Market Opportunity Assessment By Type
- Market Opportunity Assessment By Application
- Japan Visual Computing Top Companies Market Share
- Japan Visual Computing Competitive Benchmarking By Technical and Operational Parameters
- Japan Visual Computing Company Profiles
- Japan Visual Computing Key Strategic Recommendations
Market Covered
The report covers the following segments.
By Type
- Interactive Whiteboard
- Interactive Kiosk
- Interactive Table
- Interactive Video Wall
- Monitor
- Others
By Application
- Gaming
- Media and Entertainment
- Healthcare
- Automotive
- Manufacturing
- Defense and Intelligence
- Others