Jordan Crystal Lighting Market (2026-2032) | Forecast, Industry, Growth, Analysis, Revenue, Companies, Outlook, Trends, Share, Value & Size
Market Forecast By Product Type (Ceiling Crystal Lights, Crystal Chandeliers, Others), By Applications (Commercial, Designer, Superior Residential) And Competitive Landscape
| Product Code: ETC006306 | Publication Date: Sep 2020 | Updated Date: Jun 2026 | Product Type: Report | |
| Publisher: 6Wresearch | Author: Ravi Bhandari | No. of Pages: 70 | No. of Figures: 35 | No. of Tables: 5 |
Jordan Crystal Lighting Market Summary
The jordan crystal lighting market was estimated at USD 227 Million in 2025 and is projected to reach USD 307 Million by 2032, growing at a CAGR of 5.0% from 2026 to 2032.
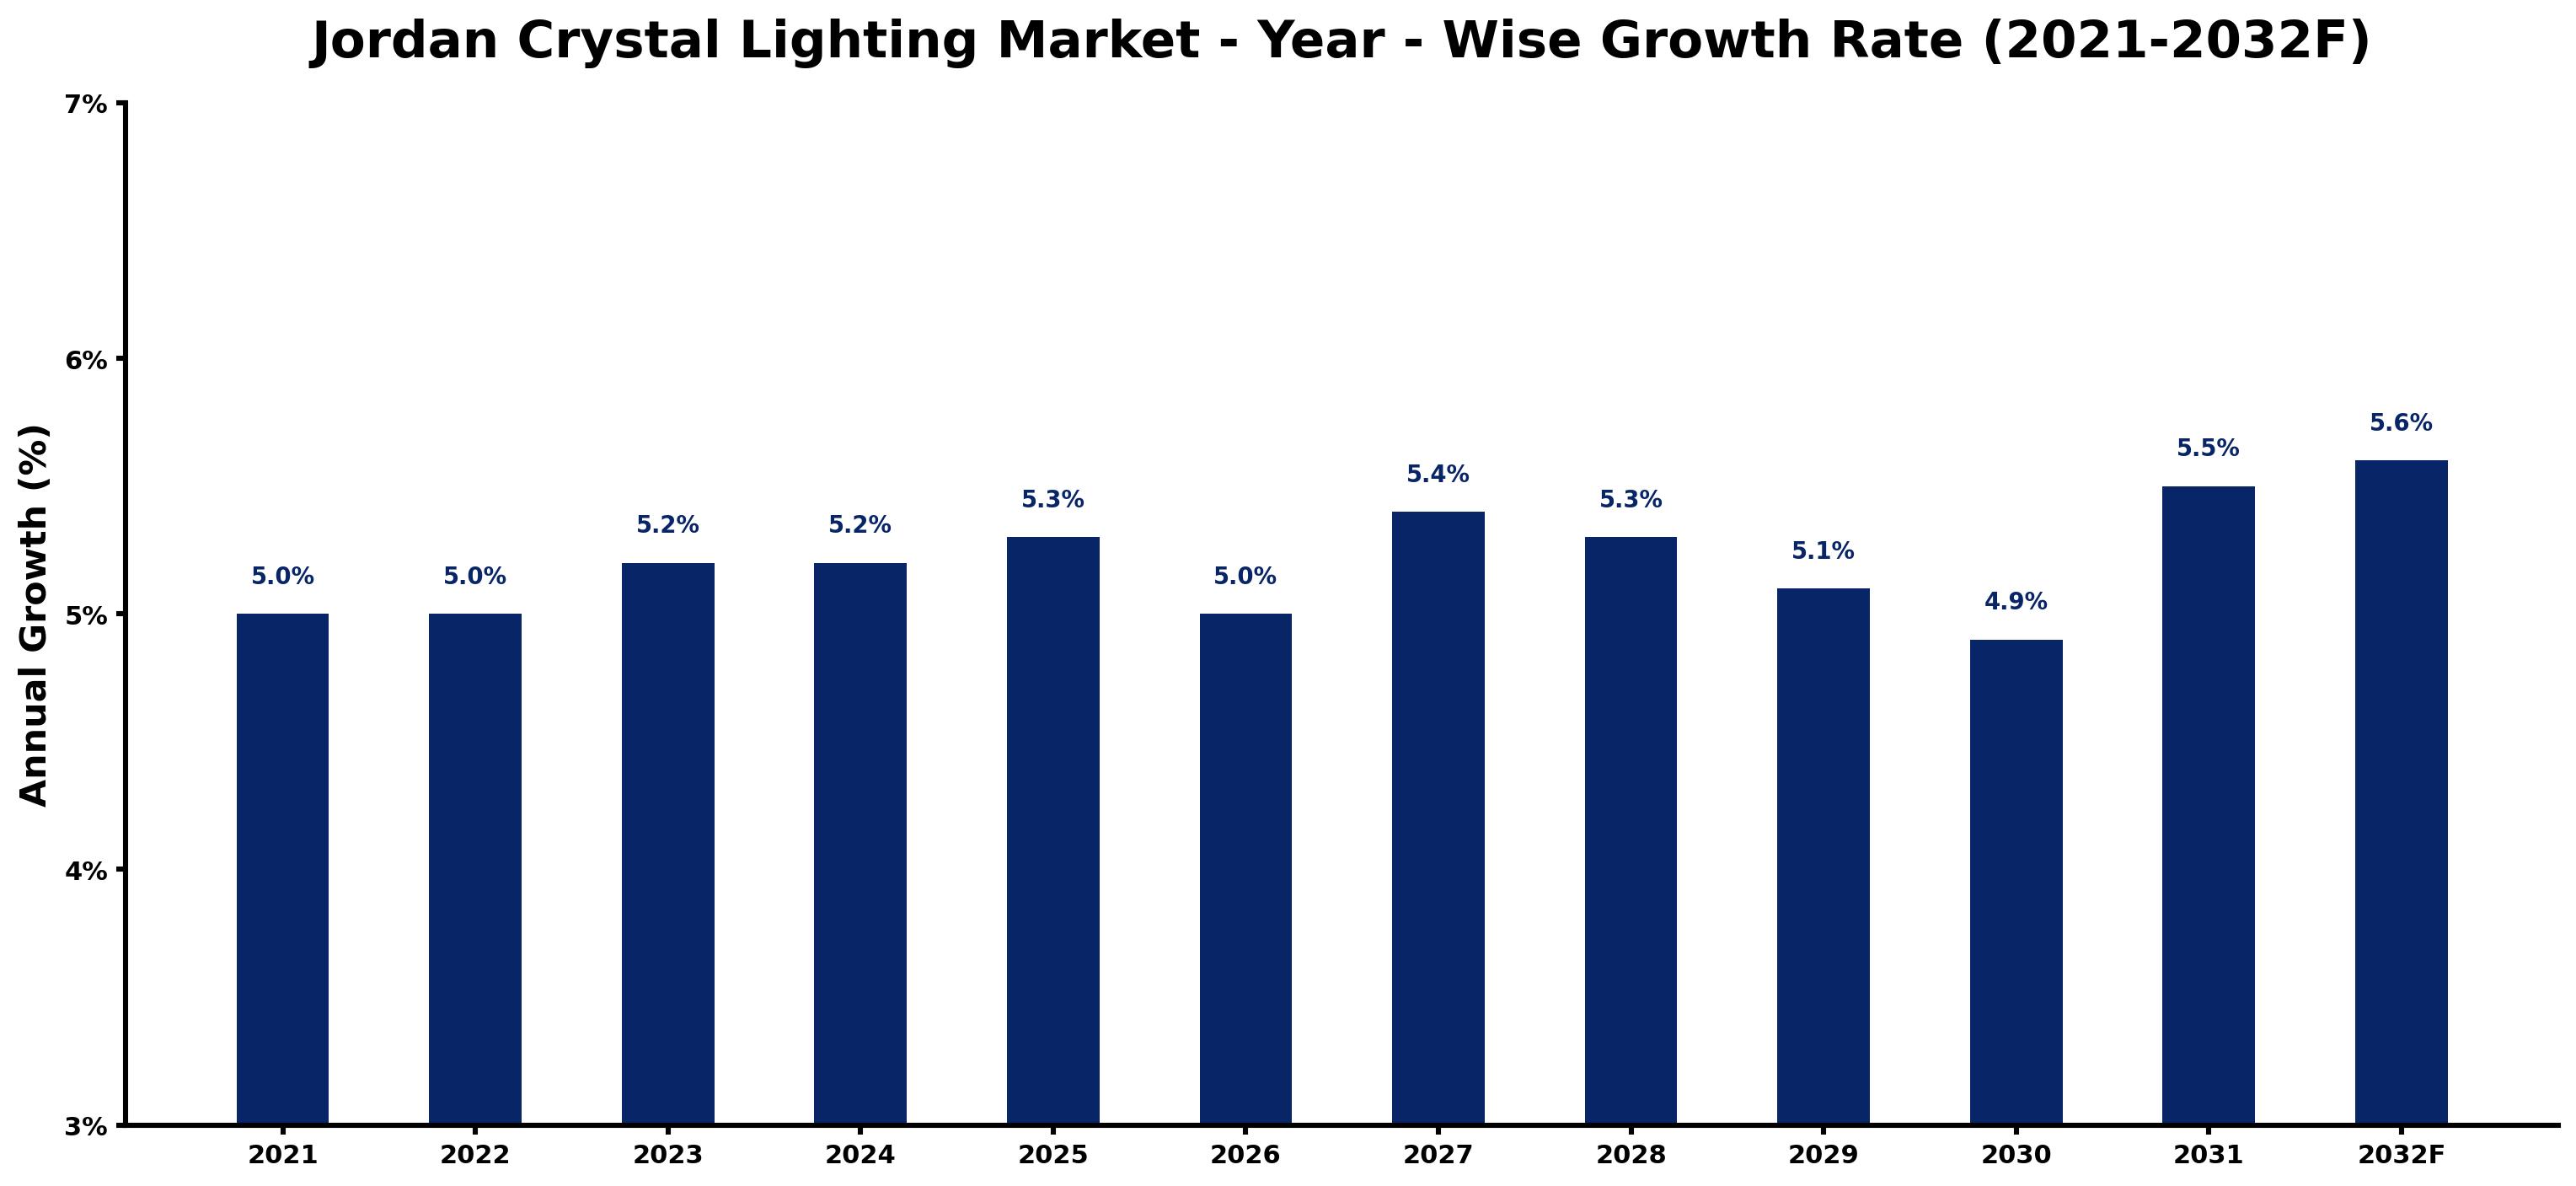
Jordan Crystal Lighting Market Growth Rate Analysis (2021-2032)
The Jordan Crystal Lighting market has shown remarkable stability over recent years, recording a steady growth rate of 5.0% in both 2021 and 2022. This stability is underscored by increasing consumer demand for aesthetic and energy-efficient lighting solutions. By 2023 and 2024, growth slightly picked up to 5.2%, driven by technological advancements in energy-efficient designs and increased investments in infrastructure. As the market evolves, a modest uptick to 5.5% in 2031 reflects ongoing innovation and a rising preference for sustainable products. However, growth forecasts moderate to around 4.9% by 2030 due to market saturation and economic pressures. Overall, the Jordan Crystal Lighting market demonstrates resilience, adapting to changing consumer preferences while emphasizing technological integration and sustainability.
Jordan Crystal Lighting Market Year-wise Growth Rate and Key Drivers
This graph highlights how the Jordan Crystal Lighting Market has steadily grown over the past five years, supported by major growth factors.
The table below presents the year wise growth rates along with the key drivers influencing the market
| Year | Growth Rate | Major Drivers |
| 2021 | 5.0% | Consumer interest in sustainable home décor began shaping luxury lighting choices. |
| 2022 | 5.0% | High home renovation activities created an uptick in premium lighting installations. |
| 2023 | 5.2% | Emergence of online marketplaces expanded access to diverse crystal lighting options. |
| 2024 | 5.2% | Economic recovery fueled spending on aesthetic home improvements and luxury items. |
| 2025 | 5.3% | Urbanization trends increased demand for stylish, energy-efficient lighting solutions. |
| 2026 | 5.0% | Technological innovations began enhancing production processes, driving cost efficiencies. |
| 2027 | 5.4% | Luxury tourism growth spurred demand for ornate lighting in hospitality spaces. |
| 2028 | 5.3% | Local artisans gained popularity, boosting interest in unique, handcrafted crystal lighting. |
| 2029 | 5.1% | Sustainability concerns led manufacturers to pursue eco-friendly crystal sourcing methods. |
| 2030 | 4.9% | Major construction projects like Neom highlighted lavish lighting demands in developments. |
| 2031 | 5.5% | Increased disposable income encouraged consumers to invest more in home aesthetics. |
| 2032 | 5.6% | Technological integration in lighting systems offered advanced features, attracting tech-savvy buyers. |
Note - Market size estimations and growth projections presented in this report are based on 6Wresearch's advanced forecasting approach, validated with industry datasets as of June 2026.
Key Highlights of the Report:
- Jordan Crystal Lighting Market Outlook
- Market Size of Jordan Crystal Lighting Market, 2025
- Forecast of Jordan Crystal Lighting Market, 2032F
- Historical Data and Forecast of Jordan Crystal Lighting Revenues & Volume for the Period 2022-2032F
- Jordan Crystal Lighting Market Trend Evolution
- Jordan Crystal Lighting Market Drivers and Challenges
- Jordan Crystal Lighting Price Trends
- Jordan Crystal Lighting Porter's Five Forces
- Jordan Crystal Lighting Industry Life Cycle
- Historical Data and Forecast of Jordan Crystal Lighting Market Revenues & Volume By Product Type for the Period 2022-2032F
- Historical Data and Forecast of Jordan Crystal Lighting Market Revenues & Volume By Ceiling Crystal Lights for the Period 2022-2032F
- Historical Data and Forecast of Jordan Crystal Lighting Market Revenues & Volume By Crystal Chandeliers for the Period 2022-2032F
- Historical Data and Forecast of Jordan Crystal Lighting Market Revenues & Volume By Others for the Period 2022-2032F
- Historical Data and Forecast of Jordan Crystal Lighting Market Revenues & Volume By Applications for the Period 2022-2032F
- Historical Data and Forecast of Jordan Crystal Lighting Market Revenues & Volume By Commercial for the Period 2022-2032F
- Historical Data and Forecast of Jordan Crystal Lighting Market Revenues & Volume By Designer for the Period 2022-2032F
- Historical Data and Forecast of Jordan Crystal Lighting Market Revenues & Volume By Superior Residential for the Period 2022-2032F
- Jordan Crystal Lighting Import Export Trade Statistics
- Market Opportunity Assessment By Product Type
- Market Opportunity Assessment By Applications
- Jordan Crystal Lighting Top Companies Market Share
- Jordan Crystal Lighting Competitive Benchmarking By Technical and Operational Parameters
- Jordan Crystal Lighting Company Profiles
- Jordan Crystal Lighting Key Strategic Recommendations
Frequently Asked Questions About the Market Study (FAQs):
6Wresearch actively monitors the Jordan Crystal Lighting Market and publishes its comprehensive annual report, highlighting emerging trends, growth drivers, revenue analysis, and forecast outlook. Our insights help businesses to make data-backed strategic decisions with ongoing market dynamics. Our analysts track relevent industries related to the Jordan Crystal Lighting Market, allowing our clients with actionable intelligence and reliable forecasts tailored to emerging regional needs.
Yes, we provide customisation as per your requirements. To learn more, feel free to contact us on sales@6wresearch.com
1 Executive Summary |
2 Introduction |
2.1 Key Highlights of the Report |
2.2 Report Description |
2.3 Market Scope & Segmentation |
2.4 Research Methodology |
2.5 Assumptions |
3 Jordan Crystal Lighting Market Overview |
3.1 Jordan Country Macro Economic Indicators |
3.2 Jordan Crystal Lighting Market Revenues & Volume, 2022 & 2032F |
3.3 Jordan Crystal Lighting Market - Industry Life Cycle |
3.4 Jordan Crystal Lighting Market - Porter's Five Forces |
3.5 Jordan Crystal Lighting Market Revenues & Volume Share, By Product Type, 2022 & 2032F |
3.6 Jordan Crystal Lighting Market Revenues & Volume Share, By Applications, 2022 & 2032F |
4 Jordan Crystal Lighting Market Dynamics |
4.1 Impact Analysis |
4.2 Market Drivers |
4.3 Market Restraints |
5 Jordan Crystal Lighting Market Trends |
6 Jordan Crystal Lighting Market, By Types |
6.1 Jordan Crystal Lighting Market, By Product Type |
6.1.1 Overview and Analysis |
6.1.2 Jordan Crystal Lighting Market Revenues & Volume, By Product Type, 2022 - 2032F |
6.1.3 Jordan Crystal Lighting Market Revenues & Volume, By Ceiling Crystal Lights, 2022 - 2032F |
6.1.4 Jordan Crystal Lighting Market Revenues & Volume, By Crystal Chandeliers, 2022 - 2032F |
6.1.5 Jordan Crystal Lighting Market Revenues & Volume, By Others, 2022 - 2032F |
6.2 Jordan Crystal Lighting Market, By Applications |
6.2.1 Overview and Analysis |
6.2.2 Jordan Crystal Lighting Market Revenues & Volume, By Commercial, 2022 - 2032F |
6.2.3 Jordan Crystal Lighting Market Revenues & Volume, By Designer, 2022 - 2032F |
6.2.4 Jordan Crystal Lighting Market Revenues & Volume, By Superior Residential, 2022 - 2032F |
7 Jordan Crystal Lighting Market Import-Export Trade Statistics |
7.1 Jordan Crystal Lighting Market Export to Major Countries |
7.2 Jordan Crystal Lighting Market Imports from Major Countries |
8 Jordan Crystal Lighting Market Key Performance Indicators |
9 Jordan Crystal Lighting Market - Opportunity Assessment |
9.1 Jordan Crystal Lighting Market Opportunity Assessment, By Product Type, 2022 & 2032F |
9.2 Jordan Crystal Lighting Market Opportunity Assessment, By Applications, 2022 & 2032F |
10 Jordan Crystal Lighting Market - Competitive Landscape |
10.1 Jordan Crystal Lighting Market Revenue Share, By Companies, 2025 |
10.2 Jordan Crystal Lighting Market Competitive Benchmarking, By Operating and Technical Parameters |
11 Company Profiles |
12 Recommendations |
13 Disclaimer |
Global Go To Market Strategy - 2030
Export potential enables firms to identify high-growth global markets with greater confidence by combining advanced trade intelligence with a structured quantitative methodology. The framework analyzes emerging demand trends and country-level import patterns while integrating macroeconomic and trade datasets such as GDP and population forecasts, bilateral import–export flows, tariff structures, elasticity differentials between developed and developing economies, geographic distance, and import demand projections. Using weighted trade values from 2020–2024 as the base period to project country-to-country export potential for 2030, these inputs are operationalized through calculated drivers such as gravity model parameters, tariff impact factors, and projected GDP per-capita growth. Through an analysis of hidden potentials, demand hotspots, and market conditions that are most favorable to success, this method enables firms to focus on target countries, maximize returns, and global expansion with data, backed by accuracy.
By factoring in the projected importer demand gap that is currently unmet and could be potential opportunity, it identifies the potential for the Exporter (Country) among 190 countries, against the general trade analysis, which identifies the biggest importer or exporter.
To discover high-growth global markets and optimize your business strategy:
Click Here
Pricing
- Single User License$ 1,995
- Department License$ 2,400
- Site License$ 3,120
- Global License$ 3,795

Leadership Perspectives from Industry Events
Search
Thought Leadership and Analyst Meet


Our Clients
6WResearch In News
- India Air Conditioner Market Set for Strong Rebound in 2026 After Weather-Led Correction and GST-Driven Recovery: 6Wresearch
- ADAS in India: How Automatic Emergency Braking, Blind Spot Detection & Driver Monitoring are Transforming Road Safety
- Doha a strategic location for EV manufacturing hub: IPA Qatar
- Demand for luxury TVs surging in the GCC, says Samsung
- Empowering Growth: The Thriving Journey of Bangladesh’s Cable Industry
- Demand for luxury TVs surging in the GCC, says Samsung
Latest Reports
- Poland Fire Protection Systems Market (2026-2032)
- Cape Verde Portable Hand-Thrown Extinguisher Market (2026-2032)
- Canada Portable Hand-Thrown Extinguisher Market (2026-2032)
- Cameroon Portable Hand-Thrown Extinguisher Market (2026-2032)
- Burundi Portable Hand-Thrown Extinguisher Market (2026-2032)
- Burkina Faso Portable Hand-Thrown Extinguisher Market (2026-2032)
- Bulgaria Portable Hand-Thrown Extinguisher Market (2026-2032)
- Brunei Portable Hand-Thrown Extinguisher Market (2026-2032)
- Botswana Portable Hand-Thrown Extinguisher Market (2026-2032)
- Bosnia and Herzegovina Portable Hand-Thrown Extinguisher Market (2026-2032)
Industry Events and Analyst Meet

HIMTEX 2026

India Refining Summit 2026

India EV Show 2026

EV tech India Expo 2026

Auto Tech Asia 2026
Whitepaper
- Middle East & Africa Commercial Security Market Click here to view more.
- Middle East & Africa Fire Safety Systems & Equipment Market Click here to view more.
- GCC Drone Market Click here to view more.
- Middle East Lighting Fixture Market Click here to view more.
- GCC Physical & Perimeter Security Market Click here to view more.