Jordan Mortar Market (2026-2032) | Companies, Analysis, Size, Share, Forecast, Outlook, Industry, Trends, Growth, Revenue & Value
Market Forecast By Type (Wet Mixed Mortar, Dry Mortar), By Application (Construction Industry, Home Decoration Industry, Others) And Competitive Landscape
| Product Code: ETC042566 | Publication Date: Jan 2021 | Updated Date: Jun 2026 | Product Type: Report | |
| Publisher: 6Wresearch | Author: Shubham Deep | No. of Pages: 70 | No. of Figures: 35 | No. of Tables: 5 |
Jordan Mortar Market Summary
The jordan mortar market was estimated at USD 333 Million in 2025 and is projected to reach USD 443 Million by 2032, growing at a CAGR of 4.7% from 2026 to 2032.
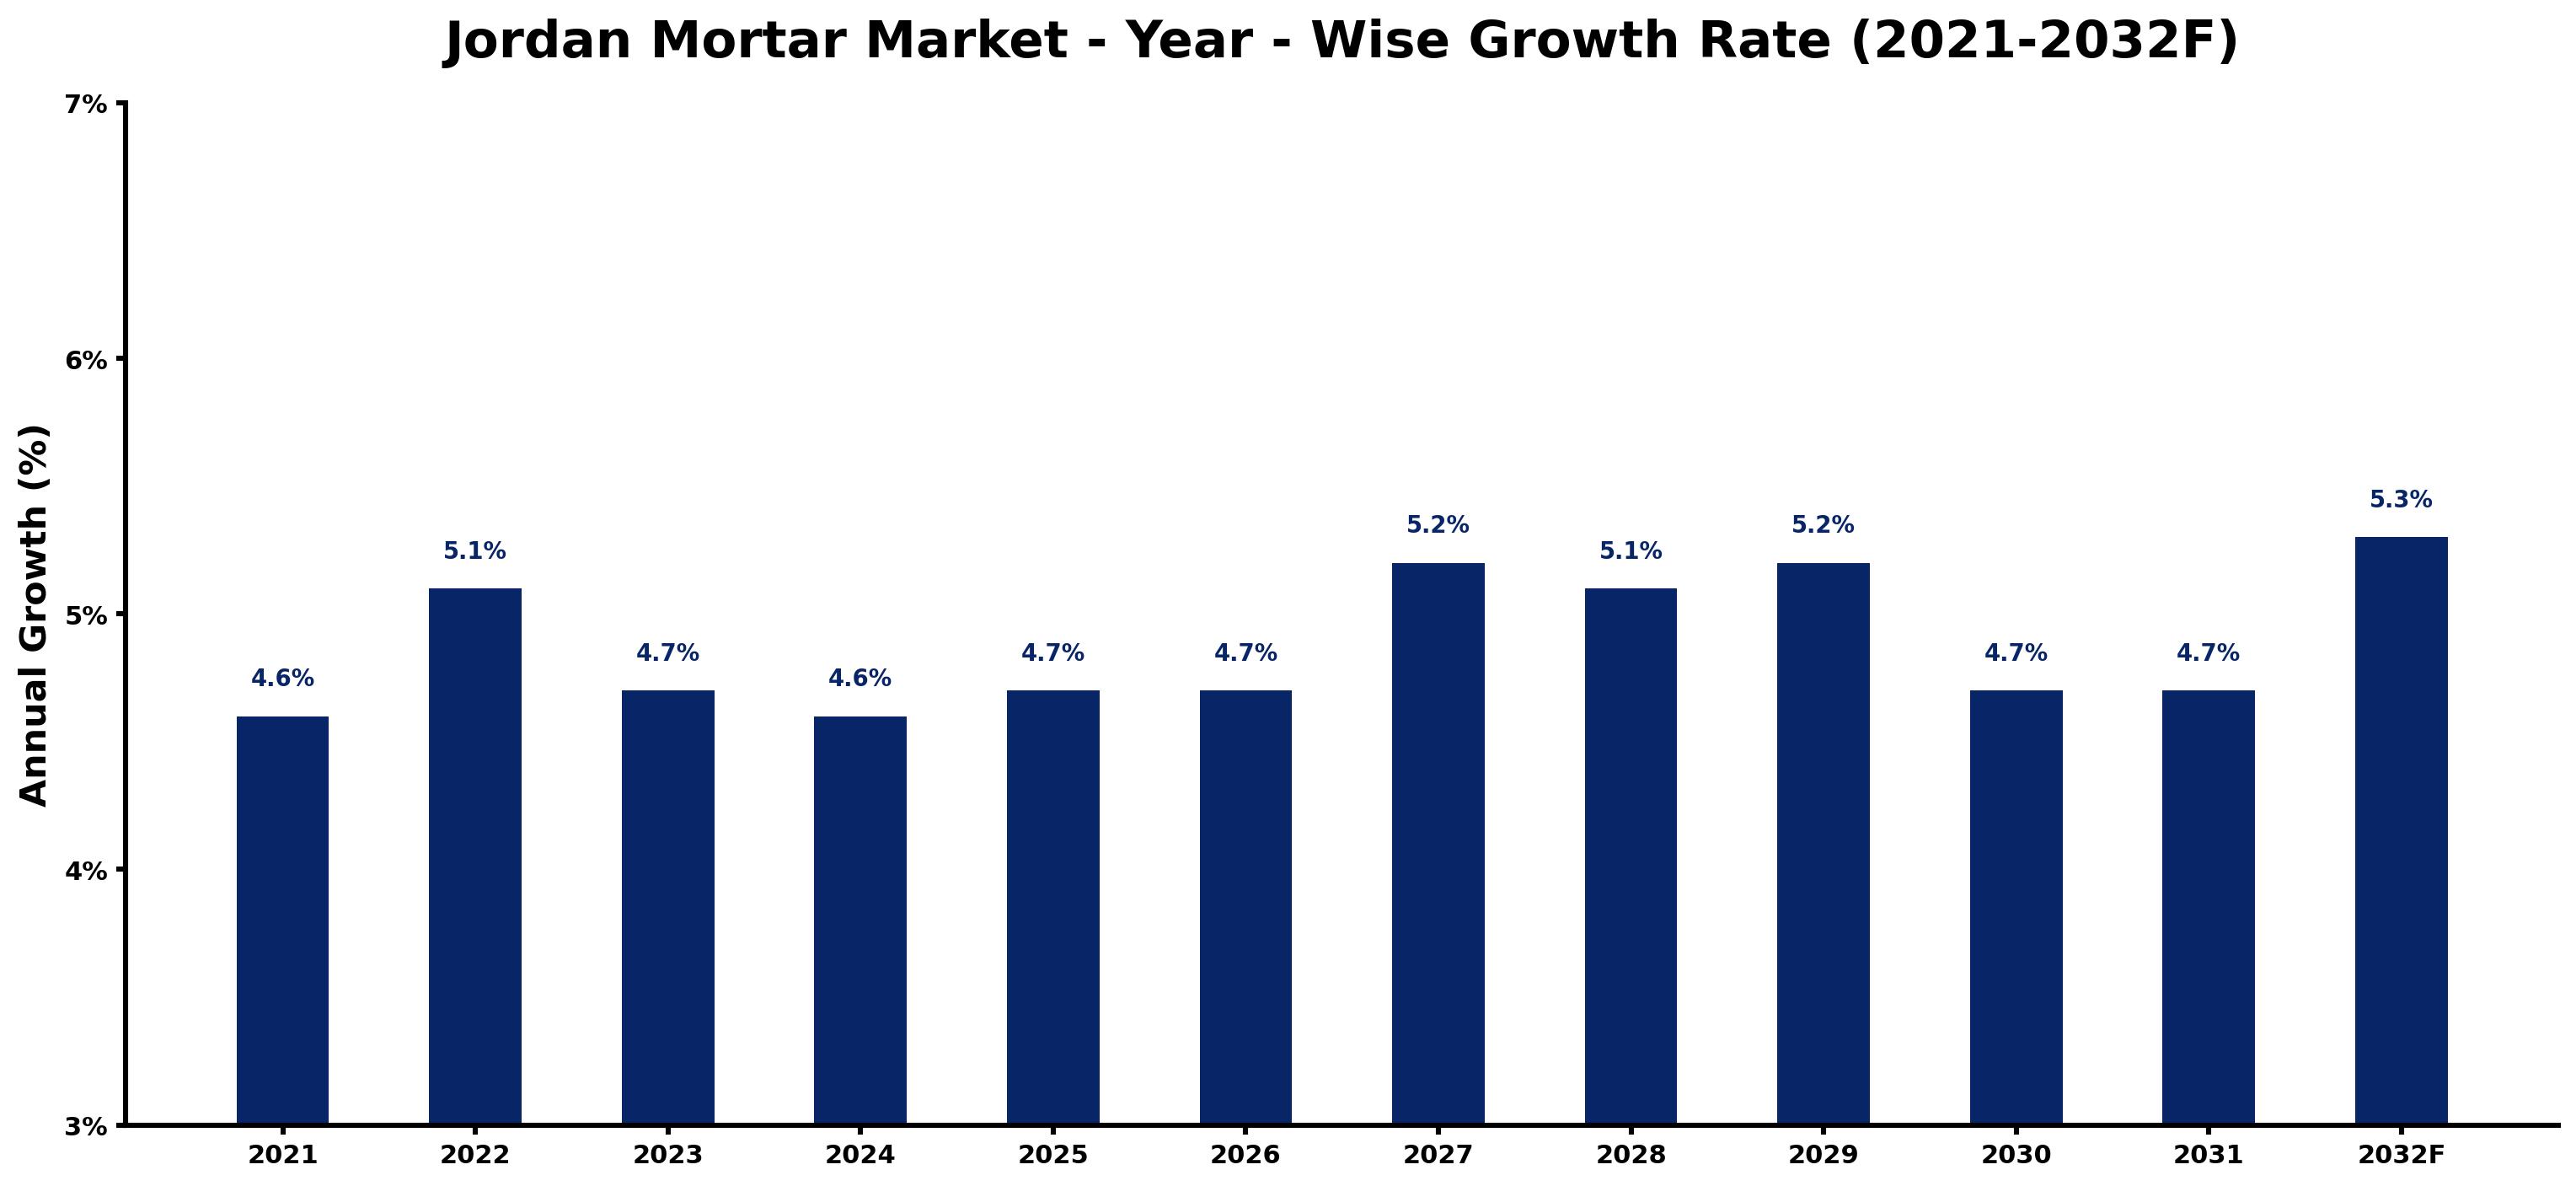
Jordan Mortar Market Growth Rate Analysis (2021-2032)
The Jordan Mortar market has exhibited stable growth, marked by a 4.6% increase in 2021, escalating to 5.2% by 2029. This expansion can be attributed to rising construction activity fueled by governmental infrastructure initiatives and growing consumer demand for residential and commercial projects. Notably, the market saw a slight dip to 4.7% in 2023 and 2024, likely influenced by fluctuating raw material costs and temporary supply chain disruptions. However, as investments in sustainable building technologies and energy-efficient construction practices gained traction in 2025 and beyond, the market rebounded, achieving a robust 5.3% growth in 2032. This upward trend reflects an adaptive market responding to evolving industry dynamics.
Jordan Mortar Market Year-wise Growth Rate and Key Drivers
This graph highlights how the Jordan Mortar Market has steadily grown over the past five years, supported by major growth factors.
The table below presents the year wise growth rates along with the key drivers influencing the market
| Year | Growth Rate | Major Drivers |
| 2021 | 4.6% | Construction activities in Jordan gained momentum post-pandemic, boosting mortar consumption significantly. |
| 2022 | 5.1% | Emergence of green building standards propelled demand for eco-friendly mortar products. |
| 2023 | 4.7% | Expanding urbanization in Amman led to increased residential and commercial construction projects. |
| 2024 | 4.6% | Infrastructure investments for tourism enhancements incentivized higher mortar usage across projects. |
| 2025 | 4.7% | Local manufacturers improved product quality, making Jordanian mortars more competitive regionally. |
| 2026 | 4.7% | Growing awareness of energy efficiency drove interest in advanced mortar technologies. |
| 2027 | 5.2% | Expansion of regional trade agreements facilitated easier access to imported raw materials. |
| 2028 | 5.1% | Emergence of smart city initiatives generated demand for innovative construction materials, including mortar. |
| 2029 | 5.2% | Increased focus on sustainability led to higher adoption of recycled materials in mortar production. |
| 2030 | 4.7% | Technological advancements in construction methods influenced mortar formulation and application processes. |
| 2031 | 4.7% | Rising residential complexes in urban areas created continuous demand for high-quality mortar solutions. |
| 2032 | 5.3% | Market consolidation efforts resulted in fewer suppliers, optimizing pricing and availability of mortar. |
Note - Market size estimations and growth projections presented in this report are based on 6Wresearch's advanced forecasting approach, validated with industry datasets as of June 2026.
Jordan Mortar Market Synopsis
The Jordan Mortar Market is projected to reach 4.7% and witness significant growth during the forecast period (2026-2032). This market is fundamentally influenced by the surge in construction activities driven by urbanization, infrastructure enhancements, and substantial government investments in the construction sector. As mortar serves as a pivotal building component for binding bricks, stones, and concrete blocks, its demand continues to rise across various residential and commercial projects throughout Jordan.
Jordan Mortar Market Growth Drivers
The growth trajectory of the Jordan Mortar Market is underpinned by several key drivers:
- Urbanization is accelerating in Jordan, leading to increased construction of residential spaces and commercial edifices, which directly boosts the demand for mortar.
- Ongoing infrastructure projects aimed at improving transportation and public facilities are creating a conducive environment for the mortar market to thrive.
- Government investments in large-scale construction initiatives contribute to a steady requirement for quality mortar products.
- The rising awareness of sustainable building practices is encouraging the use of eco-friendly mortar solutions, which are gaining traction in the market.
- Technological advancements in mortar formulations are enhancing product performance, thereby attracting more construction projects that prioritize durability and strength.
Jordan Mortar Market Trends and Opportunities
The Jordan Mortar Market is currently observing notable trends that present various opportunities for stakeholders:
- A significant shift towards sustainable and eco-friendly mortar products reflects increased consumer awareness of environmental issues.
- There is a growing preference for ready-to-use mortar solutions, appealing to construction companies seeking convenience and efficiency on site.
- Manufacturers are focusing on innovation, resulting in the development of mortars with specialized attributes such as improved adhesion, flexibility, and weather resistance.
- The demand for specialized mortars tailored to specific applications, such as tile installation or masonry works, is witnessing an upward trend.
- Collaborative ventures with local construction firms to provide bespoke mortar solutions are becoming prevalent, enhancing market reach and customer satisfaction.
Jordan Mortar Market Challenges and Restraints
Despite the growth opportunities, the Jordan Mortar Market faces significant challenges:
- The market experiences intense competition among existing manufacturers, which can limit pricing flexibility and profit margins.
- Fluctuating raw material prices pose risks to consistent production costs and profitability for manufacturers.
- Regional political instability can affect the overall construction environment, impacting demand for mortar products.
- Adapting to evolving sustainability requirements necessitates significant investment in research and development for many producers.
- Compliance with stringent quality and safety regulations complicates operations, particularly for smaller manufacturers struggling with capacity.
Jordan Mortar Market Government Investment and Initiatives
Government policies play a crucial role in shaping the Jordan Mortar Market. The Jordanian government has introduced various regulations intended to oversee the construction industry and ensure quality standards. Key initiatives include:
- Implementation of licensing requirements for manufacturers, aimed at maintaining high production standards and safety regulations.
- Quality control measures that necessitate rigorous testing and compliance to enhance product safety.
- Adherence to national building codes and standards that dictate the acceptable properties of mortar products used in construction.
- Programs encouraging sustainable building practices, promoting the use of eco-friendly materials within the construction sector.
- Public spending on infrastructure projects that not only supports immediate construction needs but also the long-term viability of the mortar market.
Jordan Mortar Market Latest Developments (May 2025 - June 2026)
In the period from May 2025 to June 2026, the Jordan Mortar Market has undergone several notable developments:
- Innovative manufacturing processes have been introduced, focusing on enhancing the performance characteristics of mortar products.
- There has been a rising trend towards automation and digitalization within manufacturing facilities, aiming to increase efficiency and reduce labor costs.
- New partnerships between local manufacturers and international suppliers have emerged to enhance product offerings and expand market reach.
- Sustainability initiatives have gained momentum, prompting companies to invest in eco-friendly product lines that comply with environmental standards.
- Government-led infrastructure projects have provided a substantial impetus for mortar demand, further solidifying market growth in this period.
Jordan Mortar Market - Key Attractiveness of the Report
- 10 Years of Market Numbers
- Historical Data Starting from 2022 to 2025
- Base Year: 2025
- Forecast Data until 2032
- Key Performance Indicators Impacting the Market
- Major Upcoming Developments and Projects
Key Highlights of the Report:
- Jordan Mortar Market Outlook
- Market Size of Jordan Mortar Market, 2025
- Forecast of Jordan Mortar Market, 2032F
- Historical Data and Forecast of Jordan Mortar Revenues & Volume for the Period 2022-2032F
- Jordan Mortar Market Trend Evolution
- Jordan Mortar Market Drivers and Challenges
- Jordan Mortar Price Trends
- Jordan Mortar Porter's Five Forces
- Jordan Mortar Industry Life Cycle
- Historical Data and Forecast of Jordan Mortar Market Revenues & Volume By Type for the Period 2022-2032F
- Historical Data and Forecast of Jordan Mortar Market Revenues & Volume By Wet Mixed Mortar for the Period 2022-2032F
- Historical Data and Forecast of Jordan Mortar Market Revenues & Volume By Dry Mortar for the Period 2022-2032F
- Historical Data and Forecast of Jordan Mortar Market Revenues & Volume By Application for the Period 2022-2032F
- Historical Data and Forecast of Jordan Mortar Market Revenues & Volume By Construction Industry for the Period 2022-2032F
- Historical Data and Forecast of Jordan Mortar Market Revenues & Volume By Home Decoration Industry for the Period 2022-2032F
- Historical Data and Forecast of Jordan Mortar Market Revenues & Volume By Others for the Period 2022-2032F
- Jordan Mortar Import Export Trade Statistics
- Market Opportunity Assessment By Type
- Market Opportunity Assessment By Application
- Jordan Mortar Top Companies Market Share
- Jordan Mortar Competitive Benchmarking By Technical and Operational Parameters
- Jordan Mortar Company Profiles
- Jordan Mortar Key Strategic Recommendations
Frequently Asked Questions About the Market Study (FAQs):
The growth is primarily driven by urbanization, infrastructure development, and significant government investments in construction.
Yes, challenges include intense competition, fluctuating raw material prices, and regional political instability affecting construction activities.
There is a noticeable trend towards sustainable and eco-friendly products, along with a growing demand for ready-to-use mortar solutions.
The government has implemented regulations for quality standards, licensing requirements for manufacturers, and initiatives promoting sustainable building practices.
6Wresearch actively monitors the Jordan Mortar Market and publishes its comprehensive annual report, highlighting emerging trends, growth drivers, revenue analysis, and forecast outlook. Our insights help businesses to make data-backed strategic decisions with ongoing market dynamics. Our analysts track relevent industries related to the Jordan Mortar Market, allowing our clients with actionable intelligence and reliable forecasts tailored to emerging regional needs.
Yes, we provide customisation as per your requirements. To learn more, feel free to contact us on sales@6wresearch.com
1 Executive Summary |
2 Introduction |
2.1 Key Highlights of the Report |
2.2 Report Description |
2.3 Market Scope & Segmentation |
2.4 Research Methodology |
2.5 Assumptions |
3 Jordan Mortar Market Overview |
3.1 Jordan Country Macro Economic Indicators |
3.2 Jordan Mortar Market Revenues & Volume, 2022 & 2032F |
3.3 Jordan Mortar Market - Industry Life Cycle |
3.4 Jordan Mortar Market - Porter's Five Forces |
3.5 Jordan Mortar Market Revenues & Volume Share, By Type, 2022 & 2032F |
3.6 Jordan Mortar Market Revenues & Volume Share, By Application, 2022 & 2032F |
4 Jordan Mortar Market Dynamics |
4.1 Impact Analysis |
4.2 Market Drivers |
4.3 Market Restraints |
5 Jordan Mortar Market Trends |
6 Jordan Mortar Market, By Types |
6.1 Jordan Mortar Market, By Type |
6.1.1 Overview and Analysis |
6.1.2 Jordan Mortar Market Revenues & Volume, By Type, 2022-2032F |
6.1.3 Jordan Mortar Market Revenues & Volume, By Wet Mixed Mortar, 2022-2032F |
6.1.4 Jordan Mortar Market Revenues & Volume, By Dry Mortar, 2022-2032F |
6.2 Jordan Mortar Market, By Application |
6.2.1 Overview and Analysis |
6.2.2 Jordan Mortar Market Revenues & Volume, By Construction Industry, 2022-2032F |
6.2.3 Jordan Mortar Market Revenues & Volume, By Home Decoration Industry, 2022-2032F |
6.2.4 Jordan Mortar Market Revenues & Volume, By Others, 2022-2032F |
7 Jordan Mortar Market Import-Export Trade Statistics |
7.1 Jordan Mortar Market Export to Major Countries |
7.2 Jordan Mortar Market Imports from Major Countries |
8 Jordan Mortar Market Key Performance Indicators |
9 Jordan Mortar Market - Opportunity Assessment |
9.1 Jordan Mortar Market Opportunity Assessment, By Type, 2022 & 2032F |
9.2 Jordan Mortar Market Opportunity Assessment, By Application, 2022 & 2032F |
10 Jordan Mortar Market - Competitive Landscape |
10.1 Jordan Mortar Market Revenue Share, By Companies, 2025 |
10.2 Jordan Mortar Market Competitive Benchmarking, By Operating and Technical Parameters |
11 Company Profiles |
12 Recommendations |
13 Disclaimer |
Global Go To Market Strategy - 2030
Export potential enables firms to identify high-growth global markets with greater confidence by combining advanced trade intelligence with a structured quantitative methodology. The framework analyzes emerging demand trends and country-level import patterns while integrating macroeconomic and trade datasets such as GDP and population forecasts, bilateral import–export flows, tariff structures, elasticity differentials between developed and developing economies, geographic distance, and import demand projections. Using weighted trade values from 2020–2024 as the base period to project country-to-country export potential for 2030, these inputs are operationalized through calculated drivers such as gravity model parameters, tariff impact factors, and projected GDP per-capita growth. Through an analysis of hidden potentials, demand hotspots, and market conditions that are most favorable to success, this method enables firms to focus on target countries, maximize returns, and global expansion with data, backed by accuracy.
By factoring in the projected importer demand gap that is currently unmet and could be potential opportunity, it identifies the potential for the Exporter (Country) among 190 countries, against the general trade analysis, which identifies the biggest importer or exporter.
To discover high-growth global markets and optimize your business strategy:
Click Here
Pricing
- Single User License$ 1,995
- Department License$ 2,400
- Site License$ 3,120
- Global License$ 3,795

Leadership Perspectives from Industry Events
Search
Thought Leadership and Analyst Meet


Our Clients
6WResearch In News
- India Air Conditioner Market Set for Strong Rebound in 2026 After Weather-Led Correction and GST-Driven Recovery: 6Wresearch
- ADAS in India: How Automatic Emergency Braking, Blind Spot Detection & Driver Monitoring are Transforming Road Safety
- Doha a strategic location for EV manufacturing hub: IPA Qatar
- Demand for luxury TVs surging in the GCC, says Samsung
- Empowering Growth: The Thriving Journey of Bangladesh’s Cable Industry
- Demand for luxury TVs surging in the GCC, says Samsung
Latest Reports
- Poland Fire Protection Systems Market (2026-2032)
- Cape Verde Portable Hand-Thrown Extinguisher Market (2026-2032)
- Canada Portable Hand-Thrown Extinguisher Market (2026-2032)
- Cameroon Portable Hand-Thrown Extinguisher Market (2026-2032)
- Burundi Portable Hand-Thrown Extinguisher Market (2026-2032)
- Burkina Faso Portable Hand-Thrown Extinguisher Market (2026-2032)
- Bulgaria Portable Hand-Thrown Extinguisher Market (2026-2032)
- Brunei Portable Hand-Thrown Extinguisher Market (2026-2032)
- Botswana Portable Hand-Thrown Extinguisher Market (2026-2032)
- Bosnia and Herzegovina Portable Hand-Thrown Extinguisher Market (2026-2032)
Industry Events and Analyst Meet

HIMTEX 2026

India Refining Summit 2026

India EV Show 2026

EV tech India Expo 2026

Auto Tech Asia 2026
Whitepaper
- Middle East & Africa Commercial Security Market Click here to view more.
- Middle East & Africa Fire Safety Systems & Equipment Market Click here to view more.
- GCC Drone Market Click here to view more.
- Middle East Lighting Fixture Market Click here to view more.
- GCC Physical & Perimeter Security Market Click here to view more.