Jordan Nano Copper Oxide Market (2026-2032) Outlook | Revenue, Industry, Forecast, Companies, Growth, Size, Trends, Value, Analysis, Share
Market Forecast By Type (Powder, Dispersed), By Application (Electricals & Electronics, Paints & Coatings, Catalysts, Energy Storage) And Competitive Landscape
| Product Code: ETC197698 | Publication Date: May 2022 | Updated Date: Jun 2026 | Product Type: Market Research Report | |
| Publisher: 6Wresearch | Author: Sumit Sagar | No. of Pages: 60 | No. of Figures: 40 | No. of Tables: 7 |
Jordan Nano Copper Oxide Market Size, Share & Growth Rate
The Jordan Nano Copper Oxide Market was estimated at USD 687 Million in 2025 and is projected to reach USD 991 Million by 2032, growing at a CAGR of 5.4% from 2026 to 2032. This growth trajectory is primarily driven by the increasing application of nano copper oxide in diverse sectors such as electronics, healthcare, and automotive industries. Additionally, the growing emphasis on advanced materials that enhance product performance is fueling demand and encouraging investments in research and development.
Jordan Nano Copper Oxide Market Growth Rate Analysis (2021-2032)
The Jordan Nano Copper Oxide market has exhibited stable growth, with rates fluctuating between 5.9% and 6.6% from 2021 to 2032. In 2022, growth peaked at 6.6%, driven by heightened demand from sectors like electronics and renewable energy, as industries increasingly integrate nano materials for their superior properties. The growth softened slightly in 2023 and 2025, reflecting temporary market adjustments due to supply chain challenges and fluctuating raw material prices. Nonetheless, robust investments in research and development have kept momentum alive, with anticipated growth at 6.6% again by 2032 as technological advancements and supportive policies continue to support the sector's expansion in Jordan's evolving industrial landscape.
Jordan Nano Copper Oxide Market Year-wise Growth Rate and Key Drivers
This graph highlights how the Jordan Nano Copper Oxide Market has steadily grown over the past five years, supported by major growth factors.
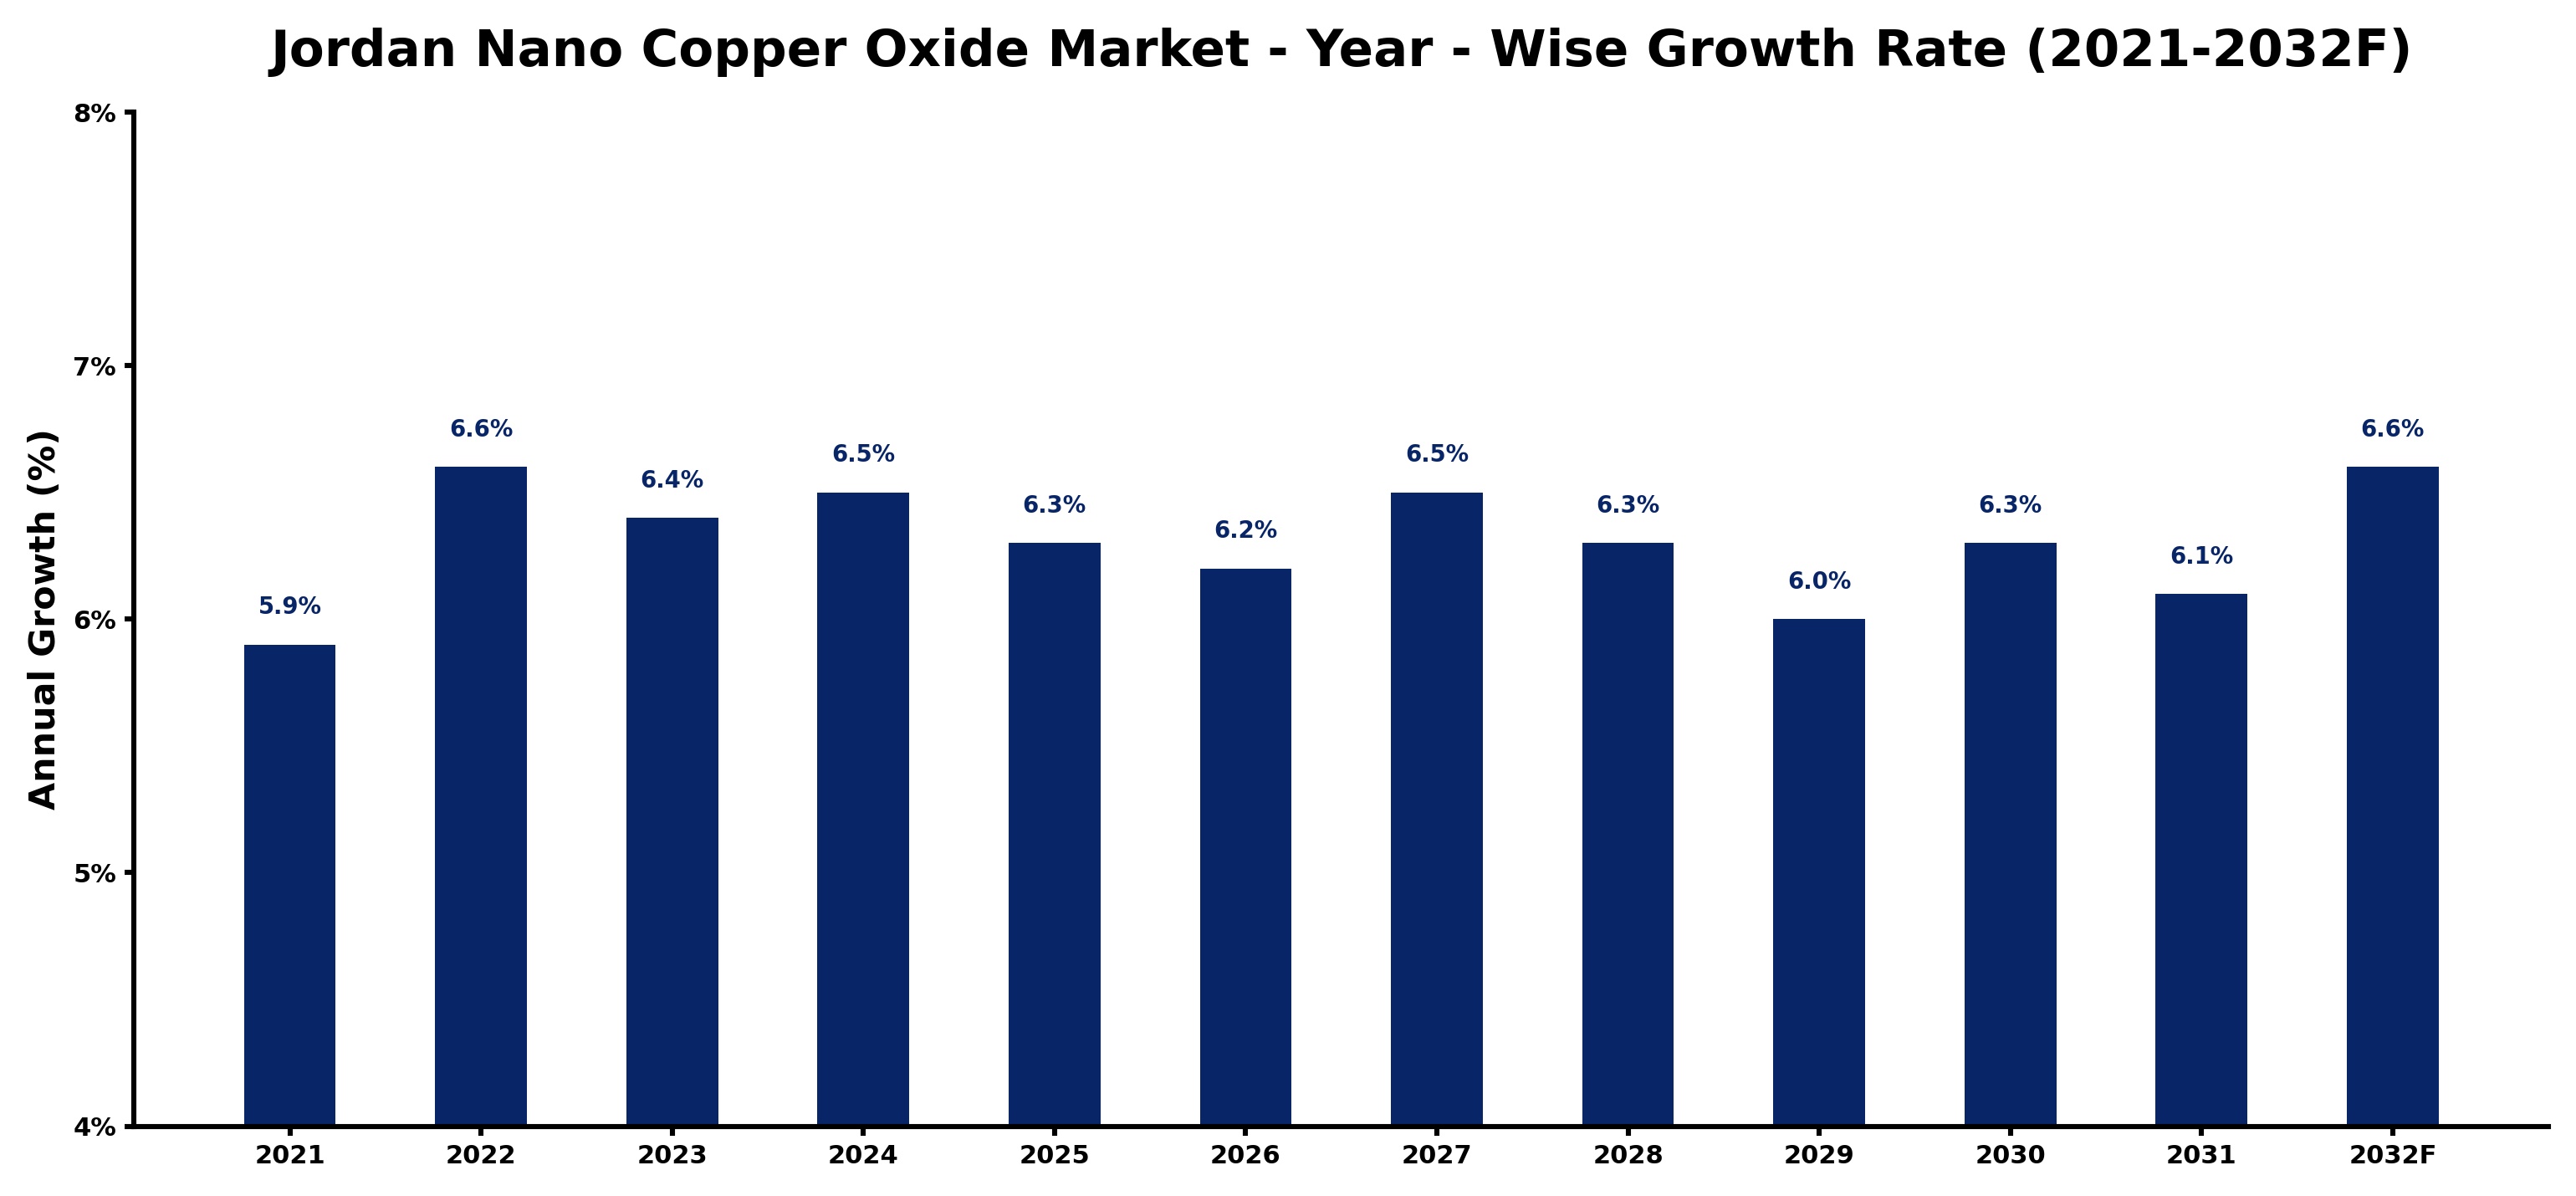
The table below presents the year‑wise growth rates along with the key drivers influencing the market
| Year | Growth Rate | Major Drivers |
| 2021 | 5.9% | Rising demand for advanced materials |
| 2022 | 6.6% | Increased applications in electronics |
| 2023 | 6.4% | Growth in renewable energy sector |
| 2024 | 6.5% | Expansion in healthcare technologies |
| 2025 | 6.3% | Advancements in nanotechnology research |
| 2026 | 6.2% | Surge in agricultural applications |
| 2027 | 6.5% | Emerging markets adopting innovations |
| 2028 | 6.3% | Sustainability trends driving usage |
| 2029 | 6.0% | Collaborations enhancing product development |
| 2030 | 6.3% | Regulatory support for nanomaterials |
| 2031 | 6.1% | Investment in research and development |
| 2032 | 6.6% | Consumer awareness of benefits rising |
Note - Market size estimations and growth projections presented in this report are based on 6Wresearch’s advanced forecasting approach, validated with industry datasets as of June 2026.
Jordan Nano Copper Oxide Market Synopsis
The most significant force shaping the Jordan Nano Copper Oxide Market today is the rising demand for antimicrobial coatings across multiple sectors. This surge in awareness regarding the health benefits associated with nano copper oxide is creating new avenues for innovation and application.
Furthermore, the competitive landscape of this market is marked by continuous advancements in technology and product development. Companies are actively engaged in enhancing the quality of their offerings, which is essential to meet the evolving needs of consumers and maintain a competitive edge in a dynamic market.
Jordan Nano Copper Oxide Market Key Takeaways
- The Jordan Nano Copper Oxide Market is experiencing significant growth driven by diverse industrial applications.
- Technological innovations are paving the way for enhanced product development and new applications.
- Government initiatives are supportive of nanotechnology, fostering research and development.
- Challenges include limited awareness and regulatory hurdles that could impact market entry and growth.
- Investment opportunities are ripe for those looking to manufacture and supply advanced nano materials.
Evaluation of Restraints in Jordan Nano Copper Oxide Market
Despite its promising growth, the Jordan Nano Copper Oxide Market faces specific constraints that limit its potential. A notable challenge is the limited understanding among potential end-users regarding the benefits and applications of nano copper oxide. This knowledge gap often results in hesitant adoption rates. Additionally, stringent regulatory frameworks and environmental guidelines can elevate production costs, creating barriers for new entrants. Moreover, fluctuations in raw material prices and broader economic uncertainties may disrupt pricing strategies and impact profitability for existing players.
Jordan Nano Copper Oxide Market Trends
Current trends indicate a robust inclination towards the integration of nano copper oxide in cutting-edge applications such as flexible electronics and energy-efficient devices. The market is witnessing an increased focus on eco-friendly alternatives, further driving demand for sustainable nanomaterials. Additionally, ongoing research into enhancing the thermal and electrical conductivity of nano copper oxide is likely to yield innovative applications that will redefine its use across various industries.
Jordan Nano Copper Oxide Market Opportunities
The landscape of the Jordan Nano Copper Oxide Market is ripe with investment opportunities. Companies focusing on the manufacture and supply of nano copper oxide are well-positioned to capitalize on the growing interest in advanced materials. There are significant prospects for research initiatives aimed at discovering new applications, as well as developing collaborations with industries keen on incorporating nano copper oxide into their products. Such partnerships are expected to stimulate further growth and enhance profitability.
Government Initiatives in the Jordan Nano Copper Oxide Market
The Jordanian government has introduced various initiatives to foster the growth of the Nano Copper Oxide Market. These initiatives include financial incentives for companies involved in production, promoting collaborative efforts between industry players and academic institutions, and investing in research and development. The establishment of regulatory frameworks aims to ensure product safety and environmental compliance while encouraging innovation within the nanotechnology sector.
Future Insights of the Jordan Nano Copper Oxide Market
Looking ahead to 2026-2032, the Jordan Nano Copper Oxide Market is anticipated to experience robust growth, spurred by the escalating demand for advanced materials across electronics, healthcare, and energy sectors. The market will benefit from the increased focus on sustainability and eco-friendly practices, alongside ongoing advancements in nanotechnology. As industries continue to recognize the advantages of using nano copper oxide for improved efficiency and performance, the landscape is set for significant expansion.
Jordan Nano Copper Oxide Market Latest Developments (May 2025 - June 2026)
Recent developments within the Jordan Nano Copper Oxide Market indicate a growing trend towards the implementation of innovative technologies aimed at improving product quality and functionality. Companies are also beginning to invest more heavily in research initiatives focused on new applications and enhanced performance characteristics. Additionally, strategic partnerships among industry stakeholders are becoming increasingly common, fostering collaborative innovations that promise to drive the market forward.
Jordan Nano Copper Oxide Market - Key Attractiveness of the Report
- 10 Years of Market Numbers
- Historical Data Starting from 2022 to 2025
- Base Year: 2025
- Forecast Data until 2032
- Key Performance Indicators Impacting the Market
- Major Upcoming Developments and Projects
Key Highlights of the Report:
- Jordan Nano Copper Oxide Market Outlook
- Market Size of Jordan Nano Copper Oxide Market, 2025
- Forecast of Jordan Nano Copper Oxide Market, 2032
- Historical Data and Forecast of Jordan Nano Copper Oxide Revenues & Volume for the Period 2022-2032F
- Jordan Nano Copper Oxide Market Trend Evolution
- Jordan Nano Copper Oxide Market Drivers and Challenges
- Jordan Nano Copper Oxide Price Trends
- Jordan Nano Copper Oxide Porter's Five Forces
- Jordan Nano Copper Oxide Industry Life Cycle
- Historical Data and Forecast of Jordan Nano Copper Oxide Market Revenues & Volume By Type for the Period 2022-2032F
- Historical Data and Forecast of Jordan Nano Copper Oxide Market Revenues & Volume By Powder for the Period 2022-2032F
- Historical Data and Forecast of Jordan Nano Copper Oxide Market Revenues & Volume By Dispersed for the Period 2022-2032F
- Historical Data and Forecast of Jordan Nano Copper Oxide Market Revenues & Volume By Application for the Period 2022-2032F
- Historical Data and Forecast of Jordan Nano Copper Oxide Market Revenues & Volume By Electricals & Electronics for the Period 2022-2032F
- Historical Data and Forecast of Jordan Nano Copper Oxide Market Revenues & Volume By Paints & Coatings for the Period 2022-2032F
- Historical Data and Forecast of Jordan Nano Copper Oxide Market Revenues & Volume By Catalysts for the Period 2022-2032F
- Historical Data and Forecast of Jordan Nano Copper Oxide Market Revenues & Volume By Energy Storage for the Period 2022-2032F
- Jordan Nano Copper Oxide Import Export Trade Statistics
- Market Opportunity Assessment By Type
- Market Opportunity Assessment By Application
- Jordan Nano Copper Oxide Top Companies Market Share
- Jordan Nano Copper Oxide Competitive Benchmarking By Technical and Operational Parameters
- Jordan Nano Copper Oxide Company Profiles
- Jordan Nano Copper Oxide Key Strategic Recommendations
Jordan Nano Copper Oxide Market - Frequently Asked Questions
The growth of the Jordan Nano Copper Oxide Market is predominantly driven by its diverse applications across electronics, healthcare, and automotive sectors, particularly in antimicrobial coatings and catalysts.
The Jordan Nano Copper Oxide Market was valued at USD 687 Million in 2025 and is projected to reach USD 991 Million by 2032, growing at a CAGR of 5.4% from 2026 to 2032, highlighting robust demand and promising growth ahead.
Emerging applications for nano copper oxide include its integration in electronic devices, development of energy-efficient products, and its role in advanced antimicrobial coatings, signaling the material's versatility.
Government policies are playing a crucial role by providing financial incentives for production and promoting research initiatives, thereby enhancing collaboration between industry and academic institutions.
The market faces challenges such as limited awareness of nano copper oxide's benefits among potential users and regulatory hurdles that may affect production costs and market entry for new companies.
6Wresearch actively monitors the Jordan Nano Copper Oxide Market and publishes its comprehensive annual report, highlighting emerging trends, growth drivers, revenue analysis, and forecast outlook. Our insights help businesses to make data-backed strategic decisions with ongoing market dynamics. Our analysts track relevent industries related to the Jordan Nano Copper Oxide Market, allowing our clients with actionable intelligence and reliable forecasts tailored to emerging regional needs.
Yes, we provide customisation as per your requirements. To learn more, feel free to contact us on sales@6wresearch.com
1 Executive Summary |
2 Introduction |
2.1 Key Highlights of the Report |
2.2 Report Description |
2.3 Market Scope & Segmentation |
2.4 Research Methodology |
2.5 Assumptions |
3 Jordan Nano Copper Oxide Market Overview |
3.1 Jordan Country Macro Economic Indicators |
3.2 Jordan Nano Copper Oxide Market Revenues & Volume, 2022 & 2032F |
3.3 Jordan Nano Copper Oxide Market - Industry Life Cycle |
3.4 Jordan Nano Copper Oxide Market - Porter's Five Forces |
3.5 Jordan Nano Copper Oxide Market Revenues & Volume Share, By Type, 2022 & 2032F |
3.6 Jordan Nano Copper Oxide Market Revenues & Volume Share, By Application, 2022 & 2032F |
4 Jordan Nano Copper Oxide Market Dynamics |
4.1 Impact Analysis |
4.2 Market Drivers |
4.2.1 Increasing demand for eco-friendly and sustainable products in various industries |
4.2.2 Growing investments in research and development for nanotechnology applications |
4.2.3 Favorable government policies promoting the use of nanomaterials in different sectors |
4.3 Market Restraints |
4.3.1 High production costs associated with manufacturing nano copper oxide |
4.3.2 Limited awareness and understanding of the benefits of nano copper oxide among end-users |
4.3.3 Regulatory challenges and concerns related to the potential health and environmental impacts of nanomaterials |
5 Jordan Nano Copper Oxide Market Trends |
6 Jordan Nano Copper Oxide Market, By Types |
6.1 Jordan Nano Copper Oxide Market, By Type |
6.1.1 Overview and Analysis |
6.1.2 Jordan Nano Copper Oxide Market Revenues & Volume, By Type, 2022-2032F |
6.1.3 Jordan Nano Copper Oxide Market Revenues & Volume, By Powder, 2022-2032F |
6.1.4 Jordan Nano Copper Oxide Market Revenues & Volume, By Dispersed, 2022-2032F |
6.2 Jordan Nano Copper Oxide Market, By Application |
6.2.1 Overview and Analysis |
6.2.2 Jordan Nano Copper Oxide Market Revenues & Volume, By Electricals & Electronics, 2022-2032F |
6.2.3 Jordan Nano Copper Oxide Market Revenues & Volume, By Paints & Coatings, 2022-2032F |
6.2.4 Jordan Nano Copper Oxide Market Revenues & Volume, By Catalysts, 2022-2032F |
6.2.5 Jordan Nano Copper Oxide Market Revenues & Volume, By Energy Storage, 2022-2032F |
7 Jordan Nano Copper Oxide Market Import-Export Trade Statistics |
7.1 Jordan Nano Copper Oxide Market Export to Major Countries |
7.2 Jordan Nano Copper Oxide Market Imports from Major Countries |
8 Jordan Nano Copper Oxide Market Key Performance Indicators |
8.1 Research and development expenditure dedicated to nano copper oxide technologies |
8.2 Number of patents filed for nano copper oxide applications |
8.3 Rate of adoption of nano copper oxide in key industries |
8.4 Environmental and health safety certifications obtained for nano copper oxide products |
8.5 Investment in infrastructure for the production and distribution of nano copper oxide |
9 Jordan Nano Copper Oxide Market - Opportunity Assessment |
9.1 Jordan Nano Copper Oxide Market Opportunity Assessment, By Type, 2022 & 2032F |
9.2 Jordan Nano Copper Oxide Market Opportunity Assessment, By Application, 2022 & 2032F |
10 Jordan Nano Copper Oxide Market - Competitive Landscape |
10.1 Jordan Nano Copper Oxide Market Revenue Share, By Companies, 2025 |
10.2 Jordan Nano Copper Oxide Market Competitive Benchmarking, By Operating and Technical Parameters |
11 Company Profiles |
12 Recommendations |
13 Disclaimer |
Global Go To Market Strategy - 2030
Export potential enables firms to identify high-growth global markets with greater confidence by combining advanced trade intelligence with a structured quantitative methodology. The framework analyzes emerging demand trends and country-level import patterns while integrating macroeconomic and trade datasets such as GDP and population forecasts, bilateral import–export flows, tariff structures, elasticity differentials between developed and developing economies, geographic distance, and import demand projections. Using weighted trade values from 2020–2024 as the base period to project country-to-country export potential for 2030, these inputs are operationalized through calculated drivers such as gravity model parameters, tariff impact factors, and projected GDP per-capita growth. Through an analysis of hidden potentials, demand hotspots, and market conditions that are most favorable to success, this method enables firms to focus on target countries, maximize returns, and global expansion with data, backed by accuracy.
By factoring in the projected importer demand gap that is currently unmet and could be potential opportunity, it identifies the potential for the Exporter (Country) among 190 countries, against the general trade analysis, which identifies the biggest importer or exporter.
To discover high-growth global markets and optimize your business strategy:
Click Here
Pricing
- Single User License$ 1,995
- Department License$ 2,400
- Site License$ 3,120
- Global License$ 3,795

Leadership Perspectives from Industry Events
Search
Thought Leadership and Analyst Meet


Our Clients
6WResearch In News
- India Air Conditioner Market Set for Strong Rebound in 2026 After Weather-Led Correction and GST-Driven Recovery: 6Wresearch
- ADAS in India: How Automatic Emergency Braking, Blind Spot Detection & Driver Monitoring are Transforming Road Safety
- Doha a strategic location for EV manufacturing hub: IPA Qatar
- Demand for luxury TVs surging in the GCC, says Samsung
- Empowering Growth: The Thriving Journey of Bangladesh’s Cable Industry
- Demand for luxury TVs surging in the GCC, says Samsung
Latest Reports
- Poland Fire Protection Systems Market (2026-2032)
- Cape Verde Portable Hand-Thrown Extinguisher Market (2026-2032)
- Canada Portable Hand-Thrown Extinguisher Market (2026-2032)
- Cameroon Portable Hand-Thrown Extinguisher Market (2026-2032)
- Burundi Portable Hand-Thrown Extinguisher Market (2026-2032)
- Burkina Faso Portable Hand-Thrown Extinguisher Market (2026-2032)
- Bulgaria Portable Hand-Thrown Extinguisher Market (2026-2032)
- Brunei Portable Hand-Thrown Extinguisher Market (2026-2032)
- Botswana Portable Hand-Thrown Extinguisher Market (2026-2032)
- Bosnia and Herzegovina Portable Hand-Thrown Extinguisher Market (2026-2032)
Industry Events and Analyst Meet

HIMTEX 2026

India Refining Summit 2026

India EV Show 2026

EV tech India Expo 2026

Auto Tech Asia 2026
Whitepaper
- Middle East & Africa Commercial Security Market Click here to view more.
- Middle East & Africa Fire Safety Systems & Equipment Market Click here to view more.
- GCC Drone Market Click here to view more.
- Middle East Lighting Fixture Market Click here to view more.
- GCC Physical & Perimeter Security Market Click here to view more.