Kenya Calcium Silicate Market (2026-2032) Outlook | Trends, Forecast, Growth, Companies, Revenue, Share, Industry, Size, Value & Analysis
Market Forecast By Application (Insulation, Paints & Coatings, Fire Protection, Cement, Ceramics, Others) And Competitive Landscape
| Product Code: ETC198242 | Publication Date: May 2022 | Updated Date: Jun 2026 | Product Type: Market Research Report | |
| Publisher: 6Wresearch | Author: Vasudha | No. of Pages: 60 | No. of Figures: 40 | No. of Tables: 7 |
Kenya Calcium Silicate Market Size, Share & Growth Rate
The Kenya Calcium Silicate Market was estimated at USD 360 Million in 2025 and is projected to reach USD 485 Million by 2032, growing at a CAGR of 4.3% from 2026 to 2032. This growth trajectory is primarily driven by the surge in construction activities, as well as the increasing focus on energy efficiency and fire-resistant materials. Additionally, governmental initiatives aimed at promoting sustainable building practices further bolster the demand for calcium silicate products across various sectors.
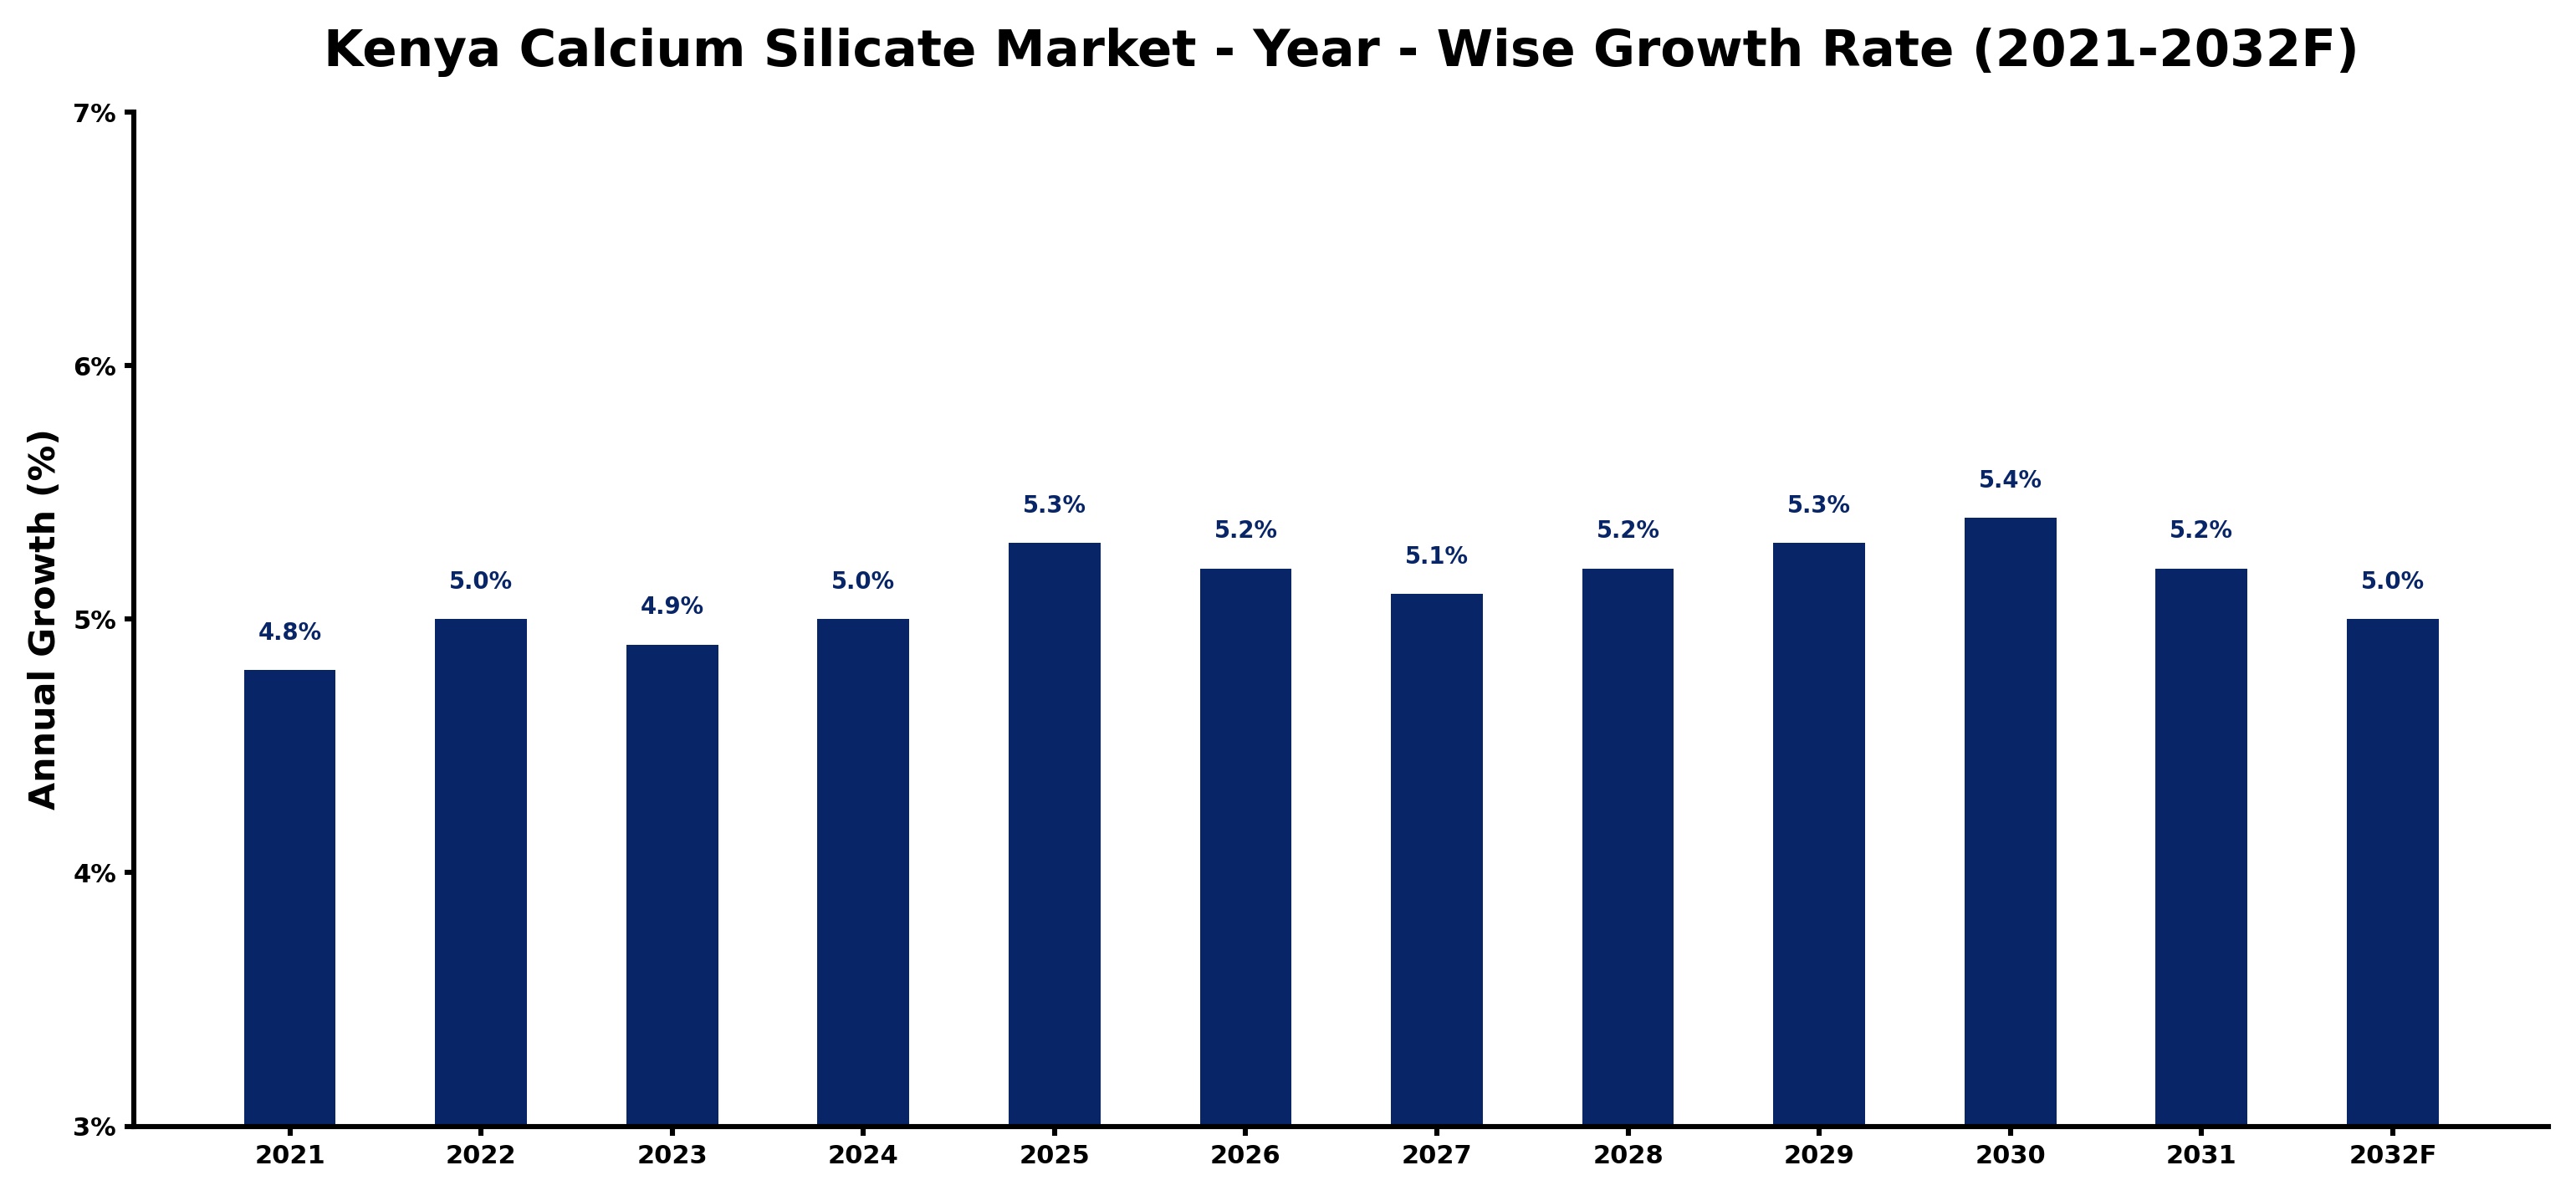
Kenya Calcium Silicate Market Growth Rate Analysis (2021-2032)
The Kenya calcium silicate market has exhibited a stable growth pattern, with yearly growth rates ranging from 4.8% in 2021 to a projected 5.4% by 2030. This gradual increase can be attributed to rising consumer demand, particularly in the construction and insulation sectors, driven by ongoing infrastructure projects and urbanization. For instance, growth hit 5.0% in both 2022 and 2024 as investments surged, while a slight dip to 4.9% in 2023 was influenced by global supply chain disruptions. The outlook remains robust, as an anticipated 5.3% growth in 2025 reflects strong industry resilience, supported by technological advancements and a shift towards sustainable building materials.
Kenya Calcium Silicate Market Year-wise Growth Rate and Key Drivers
This graph highlights how the Kenya Calcium Silicate Market has steadily grown over the past five years, supported by major growth factors.
The table below presents the year‑wise growth rates along with the key drivers influencing the market
| Year | Growth Rate | Major Drivers |
| 2021 | 4.8% | Construction sector demand increased |
| 2022 | 5.0% | Infrastructure projects drove consumption |
| 2023 | 4.9% | Green building initiatives gained traction |
| 2024 | 5.0% | Industrial applications expanded significantly |
| 2025 | 5.3% | Export opportunities enhanced growth |
| 2026 | 5.2% | Technological advancements improved efficiency |
| 2027 | 5.1% | Sustainability trends influenced purchasing |
| 2028 | 5.2% | Market education raised awareness |
| 2029 | 5.3% | Partnerships with builders strengthened |
| 2030 | 5.4% | Regulatory support fostered innovation |
| 2031 | 5.2% | Consumer preferences shifted positively |
| 2032 | 5.0% | Investment in manufacturing capabilities |
Note - Market size estimations and growth projections presented in this report are based on 6Wresearch’s advanced forecasting approach, validated with industry datasets as of June 2026.
Kenya Calcium Silicate Market Synopsis
The most significant force shaping the Kenya Calcium Silicate Market is the booming construction sector, which is witnessing a remarkable increase in project approvals and infrastructure development. As urbanization accelerates, there is a heightened demand for materials that not only provide insulation but also ensure safety and energy efficiency.
Moreover, growing awareness of fire safety and energy-saving solutions among builders and architects is contributing to the rising adoption of calcium silicate products. This trend reflects a broader shift toward sustainable construction practices, where the environmental benefits of calcium silicate are increasingly recognized and valued.
Kenya Calcium Silicate Market Key Takeaways
- The market is witnessing steady growth due to increased construction activities and regulatory support for sustainable building materials.
- Calcium silicate is favored for its fire resistance and thermal insulation properties, enhancing its appeal in various high-temperature applications.
- Investment in R&D is crucial for improving the quality and performance of calcium silicate products to meet evolving market needs.
- Government initiatives are encouraging local manufacturing, which is expected to improve product availability and reduce reliance on imports.
- Emerging trends in green building practices are positioning calcium silicate as a preferred choice for eco-friendly construction.
Evaluation of Restraints in Kenya Calcium Silicate Market
Despite the promising growth, the Kenya Calcium Silicate Market faces notable restraints. A significant challenge is the limited awareness among construction professionals and consumers regarding the advantages of calcium silicate products, which hampers widespread adoption. Additionally, the higher cost compared to traditional materials may deter price-sensitive customers. Logistical inefficiencies in the supply chain also contribute to product availability issues, complicating distribution efforts. Furthermore, the absence of consistent quality control measures poses risks concerning product reliability, potentially undermining consumer trust in these solutions.
Kenya Calcium Silicate Market Trends
The market is witnessing several key trends, including a shift towards sustainable materials driven by environmental consciousness among builders and consumers alike. The increasing integration of advanced technologies in the production processes of calcium silicate products is enhancing their quality and performance. Notably, the agricultural sector is beginning to explore the benefits of calcium silicate for crop health, indicating new avenues for growth. Additionally, the rise of green building certifications is further propelling the demand for fire-resistant and energy-efficient materials like calcium silicate.
Kenya Calcium Silicate Market Opportunities
The Kenya Calcium Silicate Market presents lucrative investment opportunities, particularly in manufacturing facilities dedicated to calcium silicate boards, pipes, and insulation materials. With substantial government investment in infrastructure and housing, there is a substantial demand for high-quality, sustainable materials. Collaboration with local construction firms and government projects can enhance market penetration. Furthermore, as awareness of the benefits of calcium silicate products grows, manufacturers that can effectively educate the market will likely see significant returns on investment.
Government Initiatives in the Kenya Calcium Silicate Market
The Kenyan government has actively implemented policies to support the development of the Calcium Silicate Market. These initiatives include providing incentives for local production, such as tax breaks and grants to companies investing in manufacturing capacities. Quality standards have been established to ensure the safety and effectiveness of calcium silicate products, while additional funding opportunities are available for research and innovation in the sector. This comprehensive approach aims to bolster domestic production, diminish dependency on imports, and enhance the overall competitiveness of the market.
Future Insights of the Kenya Calcium Silicate Market
Looking ahead to the period from 2026 to 2032, the Kenya Calcium Silicate Market is poised for sustained growth, spurred by ongoing construction and infrastructure projects. The expected rise in demand for energy-efficient and fire-resistant materials will propel market dynamics. A more profound acceptance of sustainable construction practices will likely solidify calcium silicate’s role as a preferred material choice in various industries. As the market matures, innovations and improvements in product offerings will enhance its attractiveness, contributing to robust growth in the years to come.
Kenya Calcium Silicate Market Latest Developments (May 2025 - June 2026)
Recent developments in the Kenya Calcium Silicate Market reflect a trend toward enhanced product innovation and distribution. Manufacturers are increasingly focused on streamlining their supply chains to improve product accessibility across various regions. There is also a notable uptick in collaborative efforts among industry stakeholders aimed at education and awareness campaigns regarding the benefits of calcium silicate. Furthermore, some companies are exploring opportunities for cross-industry partnerships to expand the applications of calcium silicate in sectors like agriculture and food processing.
Kenya Calcium Silicate Market - Key Attractiveness of the Report
- 10 Years of Market Numbers
- Historical Data Starting from 2022 to 2025
- Base Year: 2025
- Forecast Data until 2032
- Key Performance Indicators Impacting the Market
- Major Upcoming Developments and Projects
Key Highlights of the Report:
- Kenya Calcium Silicate Market Outlook
- Market Size of Kenya Calcium Silicate Market, 2025
- Forecast of Kenya Calcium Silicate Market, 2032
- Historical Data and Forecast of Kenya Calcium Silicate Revenues & Volume for the Period 2022-2032F
- Kenya Calcium Silicate Market Trend Evolution
- Kenya Calcium Silicate Market Drivers and Challenges
- Kenya Calcium Silicate Price Trends
- Kenya Calcium Silicate Porter's Five Forces
- Kenya Calcium Silicate Industry Life Cycle
- Historical Data and Forecast of Kenya Calcium Silicate Market Revenues & Volume By Application for the Period 2022-2032F
- Historical Data and Forecast of Kenya Calcium Silicate Market Revenues & Volume By Insulation for the Period 2022-2032F
- Historical Data and Forecast of Kenya Calcium Silicate Market Revenues & Volume By Paints & Coatings for the Period 2022-2032F
- Historical Data and Forecast of Kenya Calcium Silicate Market Revenues & Volume By Fire Protection for the Period 2022-2032F
- Historical Data and Forecast of Kenya Calcium Silicate Market Revenues & Volume By Cement for the Period 2022-2032F
- Historical Data and Forecast of Kenya Calcium Silicate Market Revenues & Volume By Ceramics for the Period 2022-2032F
- Historical Data and Forecast of Kenya Calcium Silicate Market Revenues & Volume By Others for the Period 2022-2032F
- Kenya Calcium Silicate Import Export Trade Statistics
- Market Opportunity Assessment By Application
- Kenya Calcium Silicate Top Companies Market Share
- Kenya Calcium Silicate Competitive Benchmarking By Technical and Operational Parameters
- Kenya Calcium Silicate Company Profiles
- Kenya Calcium Silicate Key Strategic Recommendations
Kenya Calcium Silicate Market - Frequently Asked Questions
The growth is primarily driven by increased construction activities, a focus on energy efficiency, and government initiatives promoting sustainable building practices.
The market was estimated at USD 360 Million in 2025 and is projected to grow to USD 485 Million by 2032, with a CAGR of 4.3% from 2026 to 2032.
Yes, limited awareness among consumers and construction professionals, higher costs compared to alternatives, and supply chain inefficiencies pose challenges in adoption.
Calcium silicate is mainly used in construction for thermal insulation, fireproofing, and as a sustainable building material, with growing interest in agricultural applications.
The government is offering incentives for local manufacturing, setting quality standards, and promoting research and development to enhance the domestic production of calcium silicate products.
Future trends will likely include advancements in product quality, increased focus on eco-friendly materials, and greater integration of calcium silicate in various sectors, driven by heightened sustainability awareness.
6Wresearch actively monitors the Kenya Calcium Silicate Market and publishes its comprehensive annual report, highlighting emerging trends, growth drivers, revenue analysis, and forecast outlook. Our insights help businesses to make data-backed strategic decisions with ongoing market dynamics. Our analysts track relevent industries related to the Kenya Calcium Silicate Market, allowing our clients with actionable intelligence and reliable forecasts tailored to emerging regional needs.
Yes, we provide customisation as per your requirements. To learn more, feel free to contact us on sales@6wresearch.com
1 Executive Summary |
2 Introduction |
2.1 Key Highlights of the Report |
2.2 Report Description |
2.3 Market Scope & Segmentation |
2.4 Research Methodology |
2.5 Assumptions |
3 Kenya Calcium Silicate Market Overview |
3.1 Kenya Country Macro Economic Indicators |
3.2 Kenya Calcium Silicate Market Revenues & Volume, 2022 & 2032F |
3.3 Kenya Calcium Silicate Market - Industry Life Cycle |
3.4 Kenya Calcium Silicate Market - Porter's Five Forces |
3.5 Kenya Calcium Silicate Market Revenues & Volume Share, By Application, 2022 & 2032F |
4 Kenya Calcium Silicate Market Dynamics |
4.1 Impact Analysis |
4.2 Market Drivers |
4.2.1 Growing construction industry in Kenya |
4.2.2 Increasing awareness about the benefits of calcium silicate in construction materials |
4.2.3 Government initiatives promoting sustainable building practices |
4.3 Market Restraints |
4.3.1 Fluctuating raw material prices |
4.3.2 Lack of skilled labor for handling calcium silicate products |
4.3.3 Competition from alternative building materials |
5 Kenya Calcium Silicate Market Trends |
6 Kenya Calcium Silicate Market, By Types |
6.1 Kenya Calcium Silicate Market, By Application |
6.1.1 Overview and Analysis |
6.1.2 Kenya Calcium Silicate Market Revenues & Volume, By Application, 2022-2032F |
6.1.3 Kenya Calcium Silicate Market Revenues & Volume, By Insulation, 2022-2032F |
6.1.4 Kenya Calcium Silicate Market Revenues & Volume, By Paints & Coatings, 2022-2032F |
6.1.5 Kenya Calcium Silicate Market Revenues & Volume, By Fire Protection, 2022-2032F |
6.1.6 Kenya Calcium Silicate Market Revenues & Volume, By Cement, 2022-2032F |
6.1.7 Kenya Calcium Silicate Market Revenues & Volume, By Ceramics, 2022-2032F |
6.1.8 Kenya Calcium Silicate Market Revenues & Volume, By Others, 2022-2032F |
7 Kenya Calcium Silicate Market Import-Export Trade Statistics |
7.1 Kenya Calcium Silicate Market Export to Major Countries |
7.2 Kenya Calcium Silicate Market Imports from Major Countries |
8 Kenya Calcium Silicate Market Key Performance Indicators |
8.1 Number of new construction projects utilizing calcium silicate |
8.2 Adoption rate of calcium silicate products in the construction industry |
8.3 Investment in research and development for improving calcium silicate products |
9 Kenya Calcium Silicate Market - Opportunity Assessment |
9.1 Kenya Calcium Silicate Market Opportunity Assessment, By Application, 2022 & 2032F |
10 Kenya Calcium Silicate Market - Competitive Landscape |
10.1 Kenya Calcium Silicate Market Revenue Share, By Companies, 2025 |
10.2 Kenya Calcium Silicate Market Competitive Benchmarking, By Operating and Technical Parameters |
11 Company Profiles |
12 Recommendations |
13 Disclaimer |
Global Go To Market Strategy - 2030
Export potential enables firms to identify high-growth global markets with greater confidence by combining advanced trade intelligence with a structured quantitative methodology. The framework analyzes emerging demand trends and country-level import patterns while integrating macroeconomic and trade datasets such as GDP and population forecasts, bilateral import–export flows, tariff structures, elasticity differentials between developed and developing economies, geographic distance, and import demand projections. Using weighted trade values from 2020–2024 as the base period to project country-to-country export potential for 2030, these inputs are operationalized through calculated drivers such as gravity model parameters, tariff impact factors, and projected GDP per-capita growth. Through an analysis of hidden potentials, demand hotspots, and market conditions that are most favorable to success, this method enables firms to focus on target countries, maximize returns, and global expansion with data, backed by accuracy.
By factoring in the projected importer demand gap that is currently unmet and could be potential opportunity, it identifies the potential for the Exporter (Country) among 190 countries, against the general trade analysis, which identifies the biggest importer or exporter.
To discover high-growth global markets and optimize your business strategy:
Click Here
Pricing
- Single User License$ 1,995
- Department License$ 2,400
- Site License$ 3,120
- Global License$ 3,795

Leadership Perspectives from Industry Events
Search
Thought Leadership and Analyst Meet


Our Clients
6WResearch In News
- India Air Conditioner Market Set for Strong Rebound in 2026 After Weather-Led Correction and GST-Driven Recovery: 6Wresearch
- ADAS in India: How Automatic Emergency Braking, Blind Spot Detection & Driver Monitoring are Transforming Road Safety
- Doha a strategic location for EV manufacturing hub: IPA Qatar
- Demand for luxury TVs surging in the GCC, says Samsung
- Empowering Growth: The Thriving Journey of Bangladesh’s Cable Industry
- Demand for luxury TVs surging in the GCC, says Samsung
Latest Reports
- Poland Fire Protection Systems Market (2026-2032)
- Cape Verde Portable Hand-Thrown Extinguisher Market (2026-2032)
- Canada Portable Hand-Thrown Extinguisher Market (2026-2032)
- Cameroon Portable Hand-Thrown Extinguisher Market (2026-2032)
- Burundi Portable Hand-Thrown Extinguisher Market (2026-2032)
- Burkina Faso Portable Hand-Thrown Extinguisher Market (2026-2032)
- Bulgaria Portable Hand-Thrown Extinguisher Market (2026-2032)
- Brunei Portable Hand-Thrown Extinguisher Market (2026-2032)
- Botswana Portable Hand-Thrown Extinguisher Market (2026-2032)
- Bosnia and Herzegovina Portable Hand-Thrown Extinguisher Market (2026-2032)
Industry Events and Analyst Meet

HIMTEX 2026

India Refining Summit 2026

India EV Show 2026

EV tech India Expo 2026

Auto Tech Asia 2026
Whitepaper
- Middle East & Africa Commercial Security Market Click here to view more.
- Middle East & Africa Fire Safety Systems & Equipment Market Click here to view more.
- GCC Drone Market Click here to view more.
- Middle East Lighting Fixture Market Click here to view more.
- GCC Physical & Perimeter Security Market Click here to view more.