Kenya Electronic Components Market (2026-2032) | Trends, Value, Growth, Companies, Size, Share, Analysis, Industry, Outlook, Revenue & Forecast
Market Forecast By Types (Passive , Active, Electro Mechanic), By Applications (Automotive, Communications, Industrial, Computing Applications, Others) And Competitive Landscape
| Product Code: ETC036550 | Publication Date: Oct 2020 | Updated Date: Jun 2026 | Product Type: Report | |
| Publisher: 6Wresearch | Author: Summon Dutta | No. of Pages: 70 | No. of Figures: 35 | No. of Tables: 5 |
Kenya Electronic Components Market Summary
The kenya electronic components market was estimated at USD 463 Million in 2025 and is projected to reach USD 618 Million by 2032, growing at a CAGR of 5.3% from 2026 to 2032.
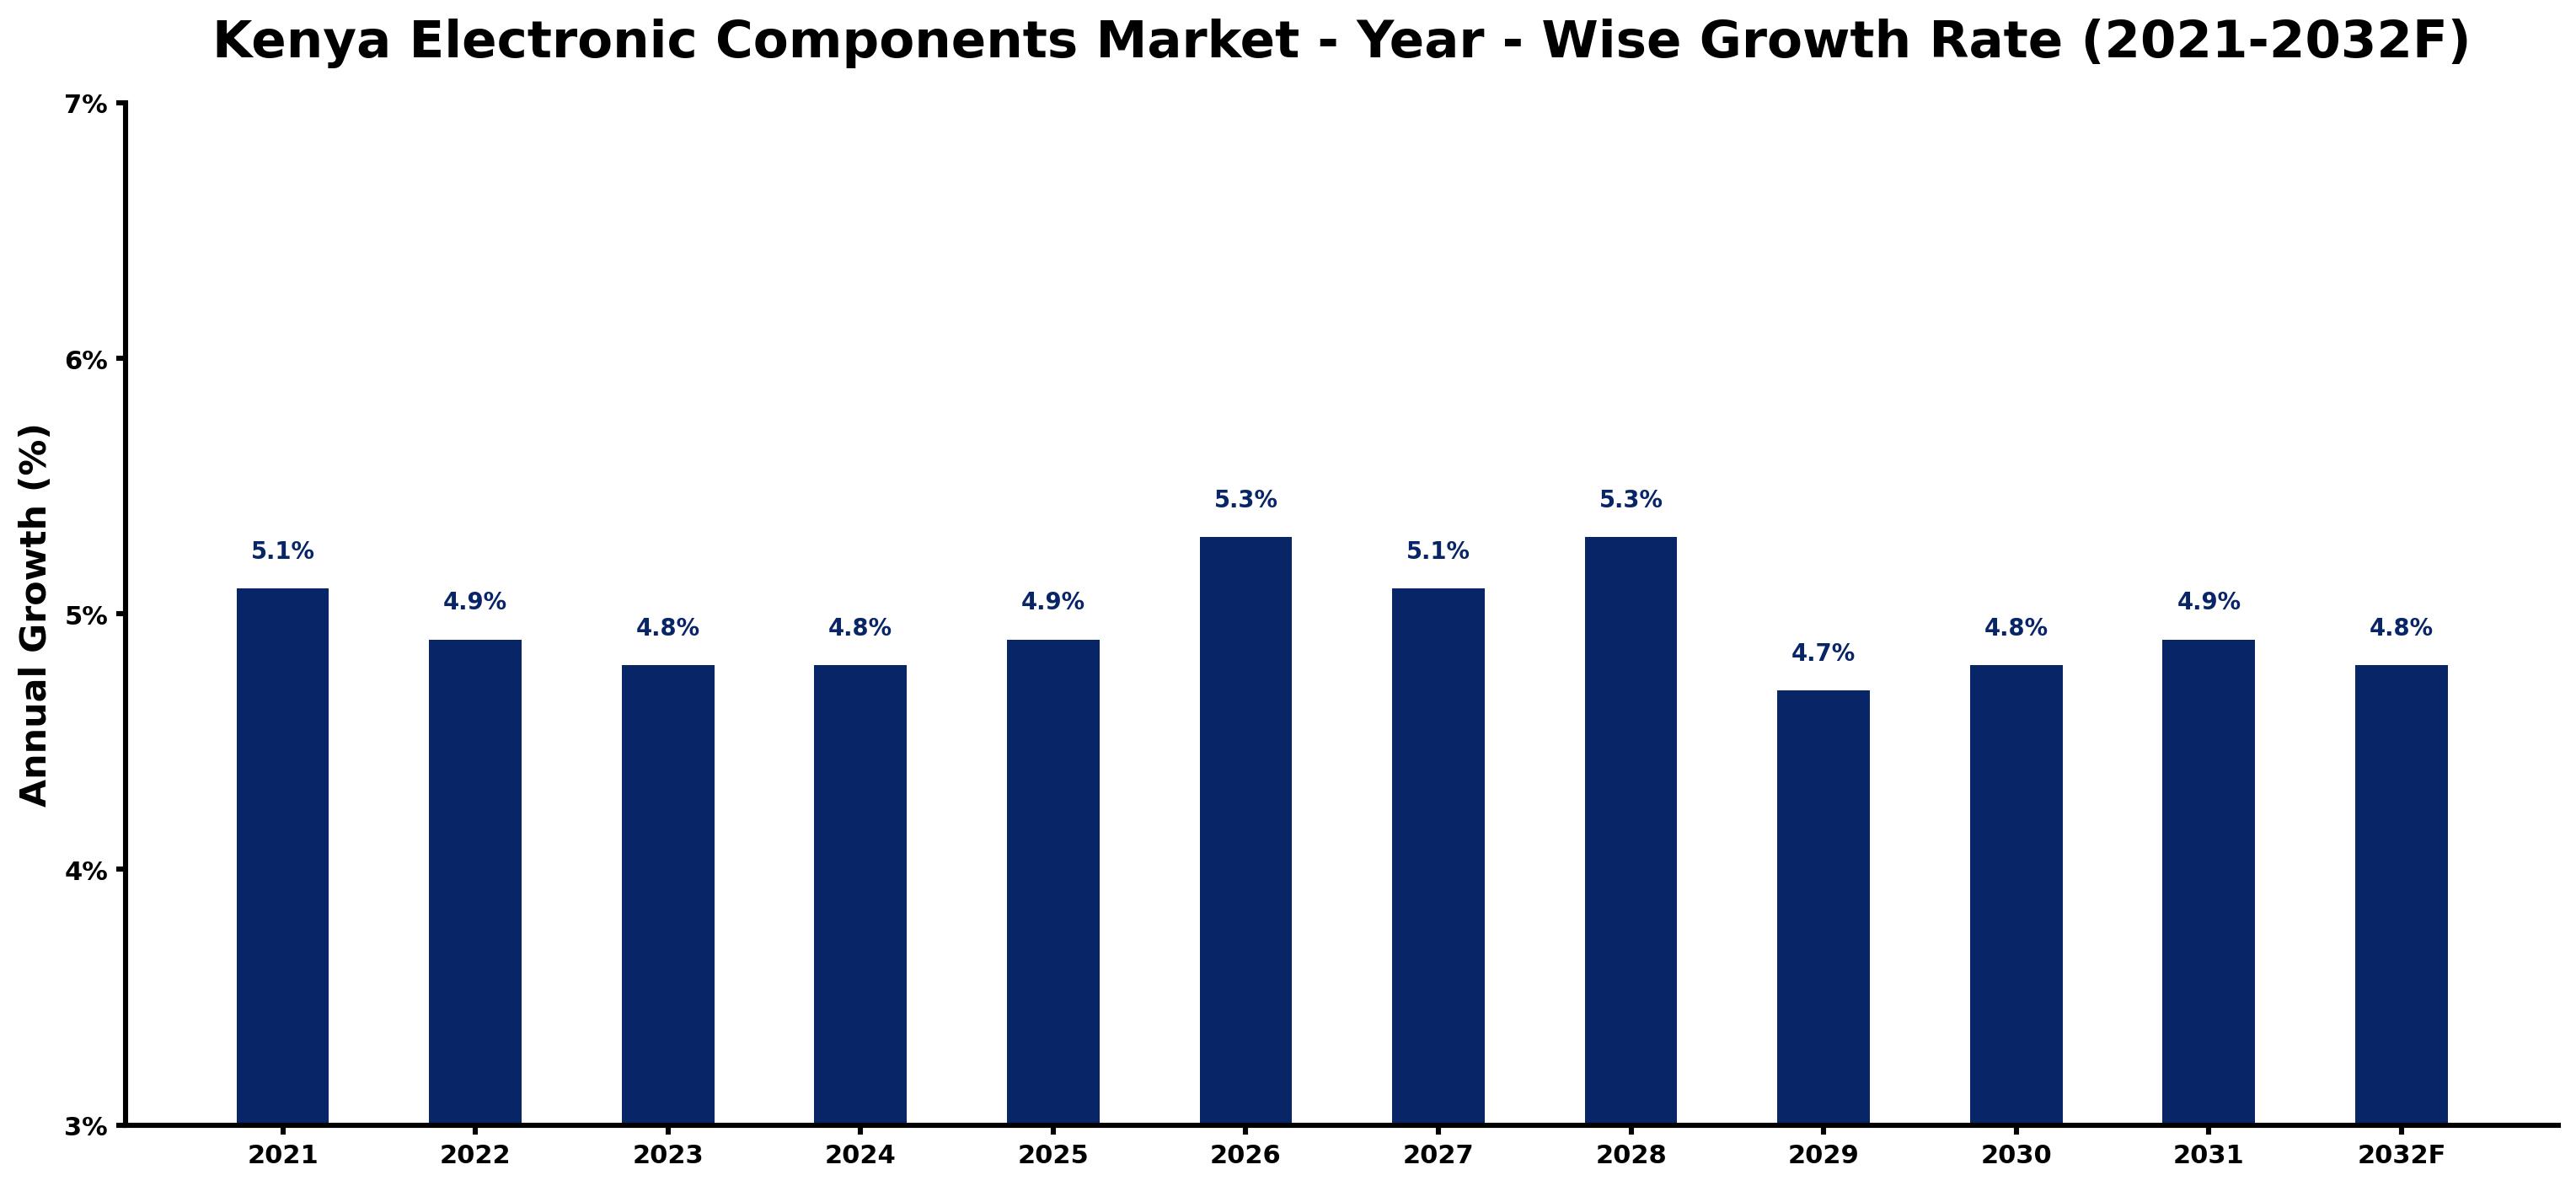
Kenya Electronic Components Market Growth Rate Analysis (2021-2032)
The Kenya Electronic Components Market has exhibited stable growth, with yearly increases of 5.1% in 2021 tapering slightly to 4.8% in subsequent years, before witnessing a resurgence to 5.3% in 2026. This pattern indicates a responsive adaptability to evolving consumer demand and technological advancements. The growth trajectory has been bolstered by investments in infrastructure and digitalization, alongside a consistent push from government policies favoring the energy transition. Fluctuations, such as the dip to 4.7% in 2029, are attributed to temporary supply chain disruptions, while an underlying demand for electronic components, driven by industrial applications and consumer electronics, is anticipated to maintain momentum through to 2032.
Kenya Electronic Components Market Year-wise Growth Rate and Key Drivers
This graph highlights how the Kenya Electronic Components Market has steadily grown over the past five years, supported by major growth factors.
The table below presents the year wise growth rates along with the key drivers influencing the market
| Year | Growth Rate | Major Drivers |
| 2021 | 5.1% | Local manufacturing initiatives begin reducing dependency on imported electronic components significantly. |
| 2022 | 4.9% | Emerging tech startups explore innovative applications for electronics in various industries. |
| 2023 | 4.8% | Telecommunication infrastructure projects demand robust electronic components for enhanced connectivity solutions. |
| 2024 | 4.8% | Investment in renewable energy sectors boosts demand for electronic components in solar systems. |
| 2025 | 4.9% | Mobile payment solutions require advanced electronic components for secure transaction capabilities. |
| 2026 | 5.3% | Increased internet penetration fosters growth in IoT devices, driving component market expansion. |
| 2027 | 5.1% | Industrial automation trends propel interest in electronics for manufacturing efficiency improvements. |
| 2028 | 5.3% | Growing urbanization encourages consumer electronics market growth, influencing component requirements. |
| 2029 | 4.7% | Collaboration between local firms and foreign investors enhances component innovation and production. |
| 2030 | 4.8% | Education technology adoption sparks demand for electronics tailored for smart learning environments. |
| 2031 | 4.9% | Government policies start emphasizing local sourcing, impacting the electronic components supply chain. |
| 2032 | 4.8% | Smart city projects necessitate advanced electronic components for integrated urban infrastructure solutions. |
Note - Market size estimations and growth projections presented in this report are based on 6Wresearch's advanced forecasting approach, validated with industry datasets as of June 2026.
Kenya Electronic Components Market Synopsis
The Kenya Electronic Components Market is projected to reach 5.3% and witness significant growth during the forecast period (2026-2032). This market is primarily driven by the increasing demand for electronic devices across various sectors, including automotive, consumer electronics, and telecommunications. The rise in smartphone and tablet usage, coupled with government initiatives aimed at infrastructure development and digitization, further propels market expansion.
Kenya Electronic Components Market Growth Drivers
Several factors are driving growth in the Kenya Electronic Components Market. Firstly, the proliferation of advanced technology in various industries has created a robust demand for electronic components. Secondly, an increase in disposable incomes among the middle-class population is leading to higher consumption of electronic devices. Thirdly, the government's strategic focus on enhancing manufacturing capabilities and promoting digital transformation underlines a supportive environment for the sector. Fourthly, the energy-efficient trend in electronic components is reshaping manufacturers' choices, emphasizing products like semiconductors and connectors. Lastly, the growing interest in renewable energy solutions is generating additional demand for electronic components such as solar panels and energy storage systems.
Kenya Electronic Components Market Trends and Opportunities
The Kenya Electronic Components Market is experiencing notable trends that present exciting opportunities for stakeholders.
- The shift towards miniaturization of electronic components is gaining momentum, enhancing device performance and functionality while reducing space requirements.
- There is an increasing demand for high-quality and reliable components, driven by technological advancements across multiple sectors.
- The integration of smart technologies into everyday products is resulting in a surge in demand for sensors and IoT-enabled components.
- The market is witnessing a growing inclination towards sustainable practices, with a rise in the use of eco-friendly components.
- The government's emphasis on supporting local manufacturing presents a unique opportunity for investors to engage in the electronic components sector.
Kenya Electronic Components Market Challenges and Restraints
Despite its growth prospects, the Kenya Electronic Components Market faces several challenges. A significant issue is the heavy reliance on imported electronic components, exposing the market to supply chain vulnerabilities, potential delays, and cost fluctuations influenced by exchange rates. Furthermore, the prevalence of counterfeit products poses a threat to quality assurance in the market, potentially undermining consumer trust. Additionally, a skills gap exists within the local workforce, hindering innovation and growth within the sector. Addressing these challenges is crucial for sustainable market development and requires investment in local production and workforce training.
Kenya Electronic Components Market Investment Opportunities
As the Kenya Electronic Components Market evolves, it presents various investment opportunities. Investors are encouraged to explore the supply of vital components like semiconductors, resistors, capacitors, and connectors to local manufacturers. The emphasis on renewable energy solutions opens opportunities for components related to solar energy and energy storage systems. Moreover, the government's commitment to digitalization implies that there will be demand for advanced electronic components that support IoT and 5G technologies. Identifying and establishing partnerships with local manufacturers can enhance market entry strategies, while remaining attuned to regulatory changes will ensure compliance and operational success.
Kenya Electronic Components Market Government Investment and Initiatives
The Kenyan government has laid out various policies aimed at bolstering the electronic components market. These initiatives are strategically focused on promoting local manufacturing capabilities and fostering innovation. Public spending on research and development is being increased to stimulate technological advancement within the sector. Additionally, incentives such as tax reductions and import duty exemptions are being implemented to attract foreign investment and encourage local production. Regulatory frameworks have also been established to ensure compliance with international standards, enhancing the overall quality and safety of electronic products in the market.
Kenya Electronic Components Market Latest Developments (May 2025 - June 2026)
The period between May 2025 and June 2026 has seen significant activities in the Kenya Electronic Components Market. Industry stakeholders have been focusing on enhancing supply chain efficiencies to mitigate impacts of previous disruptions. There have also been noticeable collaborations aimed at fostering innovation in electronic manufacturing processes. Furthermore, as part of ongoing infrastructure development, there has been an increase in the establishment of local assembly plants, which has further bolstered the demand for domestic electronic components. The government has actively participated in initiatives designed to encourage digital literacy and adoption, empowering the workforce to engage with emerging technologies effectively.
Kenya Electronic Components Market - Key Attractiveness of the Report
- 10 Years of Market Numbers
- Historical Data Starting from 2022 to 2025
- Base Year: 2025
- Forecast Data until 2032
- Key Performance Indicators Impacting the Market
- Major Upcoming Developments and Projects
Key Highlights of the Report:
- Kenya Electronic Components Market Outlook
- Market Size of Kenya Electronic Components Market, 2025
- Forecast of Kenya Electronic Components Market, 2032F
- Historical Data and Forecast of Kenya Electronic Components Revenues & Volume for the Period 2022-2032F
- Kenya Electronic Components Market Trend Evolution
- Kenya Electronic Components Market Drivers and Challenges
- Kenya Electronic Components Price Trends
- Kenya Electronic Components Porter's Five Forces
- Kenya Electronic Components Industry Life Cycle
- Historical Data and Forecast of Kenya Electronic Components Market Revenues & Volume By Types for the Period 2022-2032F
- Historical Data and Forecast of Kenya Electronic Components Market Revenues & Volume By Passive for the Period 2022-2032F
- Historical Data and Forecast of Kenya Electronic Components Market Revenues & Volume By Active for the Period 2022-2032F
- Historical Data and Forecast of Kenya Electronic Components Market Revenues & Volume By Electro Mechanic for the Period 2022-2032F
- Historical Data and Forecast of Kenya Electronic Components Market Revenues & Volume By Applications for the Period 2022-2032F
- Historical Data and Forecast of Kenya Electronic Components Market Revenues & Volume By Automotive for the Period 2022-2032F
- Historical Data and Forecast of Kenya Electronic Components Market Revenues & Volume By Communications for the Period 2022-2032F
- Historical Data and Forecast of Kenya Electronic Components Market Revenues & Volume By Industrial for the Period 2022-2032F
- Historical Data and Forecast of Kenya Electronic Components Market Revenues & Volume By Computing Applications for the Period 2022-2032F
- Historical Data and Forecast of Kenya Electronic Components Market Revenues & Volume By Others for the Period 2022-2032F
- Kenya Electronic Components Import Export Trade Statistics
- Market Opportunity Assessment By Types
- Market Opportunity Assessment By Applications
- Kenya Electronic Components Top Companies Market Share
- Kenya Electronic Components Competitive Benchmarking By Technical and Operational Parameters
- Kenya Electronic Components Company Profiles
- Kenya Electronic Components Key Strategic Recommendations
Frequently Asked Questions About the Market Study (FAQs):
The growth is primarily driven by the increasing demand for advanced technologies, higher consumption of electronic devices, and government support for manufacturing.
Key challenges include reliance on imports, the prevalence of counterfeit products, and a limited skilled workforce.
Opportunities include supplying semiconductors and renewable energy components, as well as engaging in local manufacturing partnerships.
The government supports market growth through policies that promote local manufacturing, innovation incentives, and regulatory compliance frameworks.
6Wresearch actively monitors the Kenya Electronic Components Market and publishes its comprehensive annual report, highlighting emerging trends, growth drivers, revenue analysis, and forecast outlook. Our insights help businesses to make data-backed strategic decisions with ongoing market dynamics. Our analysts track relevent industries related to the Kenya Electronic Components Market, allowing our clients with actionable intelligence and reliable forecasts tailored to emerging regional needs.
Yes, we provide customisation as per your requirements. To learn more, feel free to contact us on sales@6wresearch.com
1 Executive Summary |
2 Introduction |
2.1 Key Highlights of the Report |
2.2 Report Description |
2.3 Market Scope & Segmentation |
2.4 Research Methodology |
2.5 Assumptions |
3 Kenya Electronic Components Market Overview |
3.1 Kenya Country Macro Economic Indicators |
3.2 Kenya Electronic Components Market Revenues & Volume, 2022 & 2032F |
3.3 Kenya Electronic Components Market - Industry Life Cycle |
3.4 Kenya Electronic Components Market - Porter's Five Forces |
3.5 Kenya Electronic Components Market Revenues & Volume Share, By Types, 2022 & 2032F |
3.6 Kenya Electronic Components Market Revenues & Volume Share, By Applications, 2022 & 2032F |
4 Kenya Electronic Components Market Dynamics |
4.1 Impact Analysis |
4.2 Market Drivers |
4.3 Market Restraints |
5 Kenya Electronic Components Market Trends |
6 Kenya Electronic Components Market, By Types |
6.1 Kenya Electronic Components Market, By Types |
6.1.1 Overview and Analysis |
6.1.2 Kenya Electronic Components Market Revenues & Volume, By Types, 2022-2032F |
6.1.3 Kenya Electronic Components Market Revenues & Volume, By Passive , 2022-2032F |
6.1.4 Kenya Electronic Components Market Revenues & Volume, By Active, 2022-2032F |
6.1.5 Kenya Electronic Components Market Revenues & Volume, By Electro Mechanic, 2022-2032F |
6.2 Kenya Electronic Components Market, By Applications |
6.2.1 Overview and Analysis |
6.2.2 Kenya Electronic Components Market Revenues & Volume, By Automotive, 2022-2032F |
6.2.3 Kenya Electronic Components Market Revenues & Volume, By Communications, 2022-2032F |
6.2.4 Kenya Electronic Components Market Revenues & Volume, By Industrial, 2022-2032F |
6.2.5 Kenya Electronic Components Market Revenues & Volume, By Computing Applications, 2022-2032F |
6.2.6 Kenya Electronic Components Market Revenues & Volume, By Others, 2022-2032F |
7 Kenya Electronic Components Market Import-Export Trade Statistics |
7.1 Kenya Electronic Components Market Export to Major Countries |
7.2 Kenya Electronic Components Market Imports from Major Countries |
8 Kenya Electronic Components Market Key Performance Indicators |
9 Kenya Electronic Components Market - Opportunity Assessment |
9.1 Kenya Electronic Components Market Opportunity Assessment, By Types, 2022 & 2032F |
9.2 Kenya Electronic Components Market Opportunity Assessment, By Applications, 2022 & 2032F |
10 Kenya Electronic Components Market - Competitive Landscape |
10.1 Kenya Electronic Components Market Revenue Share, By Companies, 2025 |
10.2 Kenya Electronic Components Market Competitive Benchmarking, By Operating and Technical Parameters |
11 Company Profiles |
12 Recommendations |
13 Disclaimer |
Global Go To Market Strategy - 2030
Export potential enables firms to identify high-growth global markets with greater confidence by combining advanced trade intelligence with a structured quantitative methodology. The framework analyzes emerging demand trends and country-level import patterns while integrating macroeconomic and trade datasets such as GDP and population forecasts, bilateral import–export flows, tariff structures, elasticity differentials between developed and developing economies, geographic distance, and import demand projections. Using weighted trade values from 2020–2024 as the base period to project country-to-country export potential for 2030, these inputs are operationalized through calculated drivers such as gravity model parameters, tariff impact factors, and projected GDP per-capita growth. Through an analysis of hidden potentials, demand hotspots, and market conditions that are most favorable to success, this method enables firms to focus on target countries, maximize returns, and global expansion with data, backed by accuracy.
By factoring in the projected importer demand gap that is currently unmet and could be potential opportunity, it identifies the potential for the Exporter (Country) among 190 countries, against the general trade analysis, which identifies the biggest importer or exporter.
To discover high-growth global markets and optimize your business strategy:
Click Here
Pricing
- Single User License$ 1,995
- Department License$ 2,400
- Site License$ 3,120
- Global License$ 3,795

Leadership Perspectives from Industry Events
Search
Thought Leadership and Analyst Meet


Our Clients
6WResearch In News
- India Air Conditioner Market Set for Strong Rebound in 2026 After Weather-Led Correction and GST-Driven Recovery: 6Wresearch
- ADAS in India: How Automatic Emergency Braking, Blind Spot Detection & Driver Monitoring are Transforming Road Safety
- Doha a strategic location for EV manufacturing hub: IPA Qatar
- Demand for luxury TVs surging in the GCC, says Samsung
- Empowering Growth: The Thriving Journey of Bangladesh’s Cable Industry
- Demand for luxury TVs surging in the GCC, says Samsung
Latest Reports
- Poland Fire Protection Systems Market (2026-2032)
- Cape Verde Portable Hand-Thrown Extinguisher Market (2026-2032)
- Canada Portable Hand-Thrown Extinguisher Market (2026-2032)
- Cameroon Portable Hand-Thrown Extinguisher Market (2026-2032)
- Burundi Portable Hand-Thrown Extinguisher Market (2026-2032)
- Burkina Faso Portable Hand-Thrown Extinguisher Market (2026-2032)
- Bulgaria Portable Hand-Thrown Extinguisher Market (2026-2032)
- Brunei Portable Hand-Thrown Extinguisher Market (2026-2032)
- Botswana Portable Hand-Thrown Extinguisher Market (2026-2032)
- Bosnia and Herzegovina Portable Hand-Thrown Extinguisher Market (2026-2032)
Industry Events and Analyst Meet

HIMTEX 2026

India Refining Summit 2026

India EV Show 2026

EV tech India Expo 2026

Auto Tech Asia 2026
Whitepaper
- Middle East & Africa Commercial Security Market Click here to view more.
- Middle East & Africa Fire Safety Systems & Equipment Market Click here to view more.
- GCC Drone Market Click here to view more.
- Middle East Lighting Fixture Market Click here to view more.
- GCC Physical & Perimeter Security Market Click here to view more.