Qatar Electronic Components Market (2026-2032) | Revenue, Size, Outlook, Share, Forecast, Companies, Industry, Growth, Trends, Value & Analysis
Market Forecast By Types (Passive , Active, Electro Mechanic), By Applications (Automotive, Communications, Industrial, Computing Applications, Others) And Competitive Landscape
| Product Code: ETC036541 | Publication Date: Jul 2023 | Updated Date: Jun 2026 | Product Type: Report | |
| Publisher: 6Wresearch | Author: Ravi Bhandari | No. of Pages: 70 | No. of Figures: 35 | No. of Tables: 5 |
Qatar Electronic Components Market Summary
The qatar electronic components market was estimated at USD 467 Million in 2025 and is projected to reach USD 624 Million by 2032, growing at a CAGR of 5.2% from 2026 to 2032.
Qatar Electronic Components Market Growth Rate Analysis (2021-2032)
The Qatar Electronic Components Market has shown steady growth, with annual increases reflecting a stable trajectory. The market expanded by 4.8% in 2021, continuing to gain momentum with a 5.2% rise in both 2022 and 2023. This growth is largely driven by innovative technological advancements and heightened consumer demand for smart devices. While growth is projected to dip slightly to 5.1% in 2024 before easing to 4.6% in 2025, a resurgence to 5.2% is expected by 2026. Factors such as ongoing infrastructure investments and the transition towards digitalization are crucial in fostering this demand. By 2032, the market is anticipated to maintain a robust 4.9% growth, underscoring its resilience amidst global trends.
Qatar Electronic Components Market Year-wise Growth Rate and Key Drivers
This graph highlights how the Qatar Electronic Components Market has steadily grown over the past five years, supported by major growth factors.
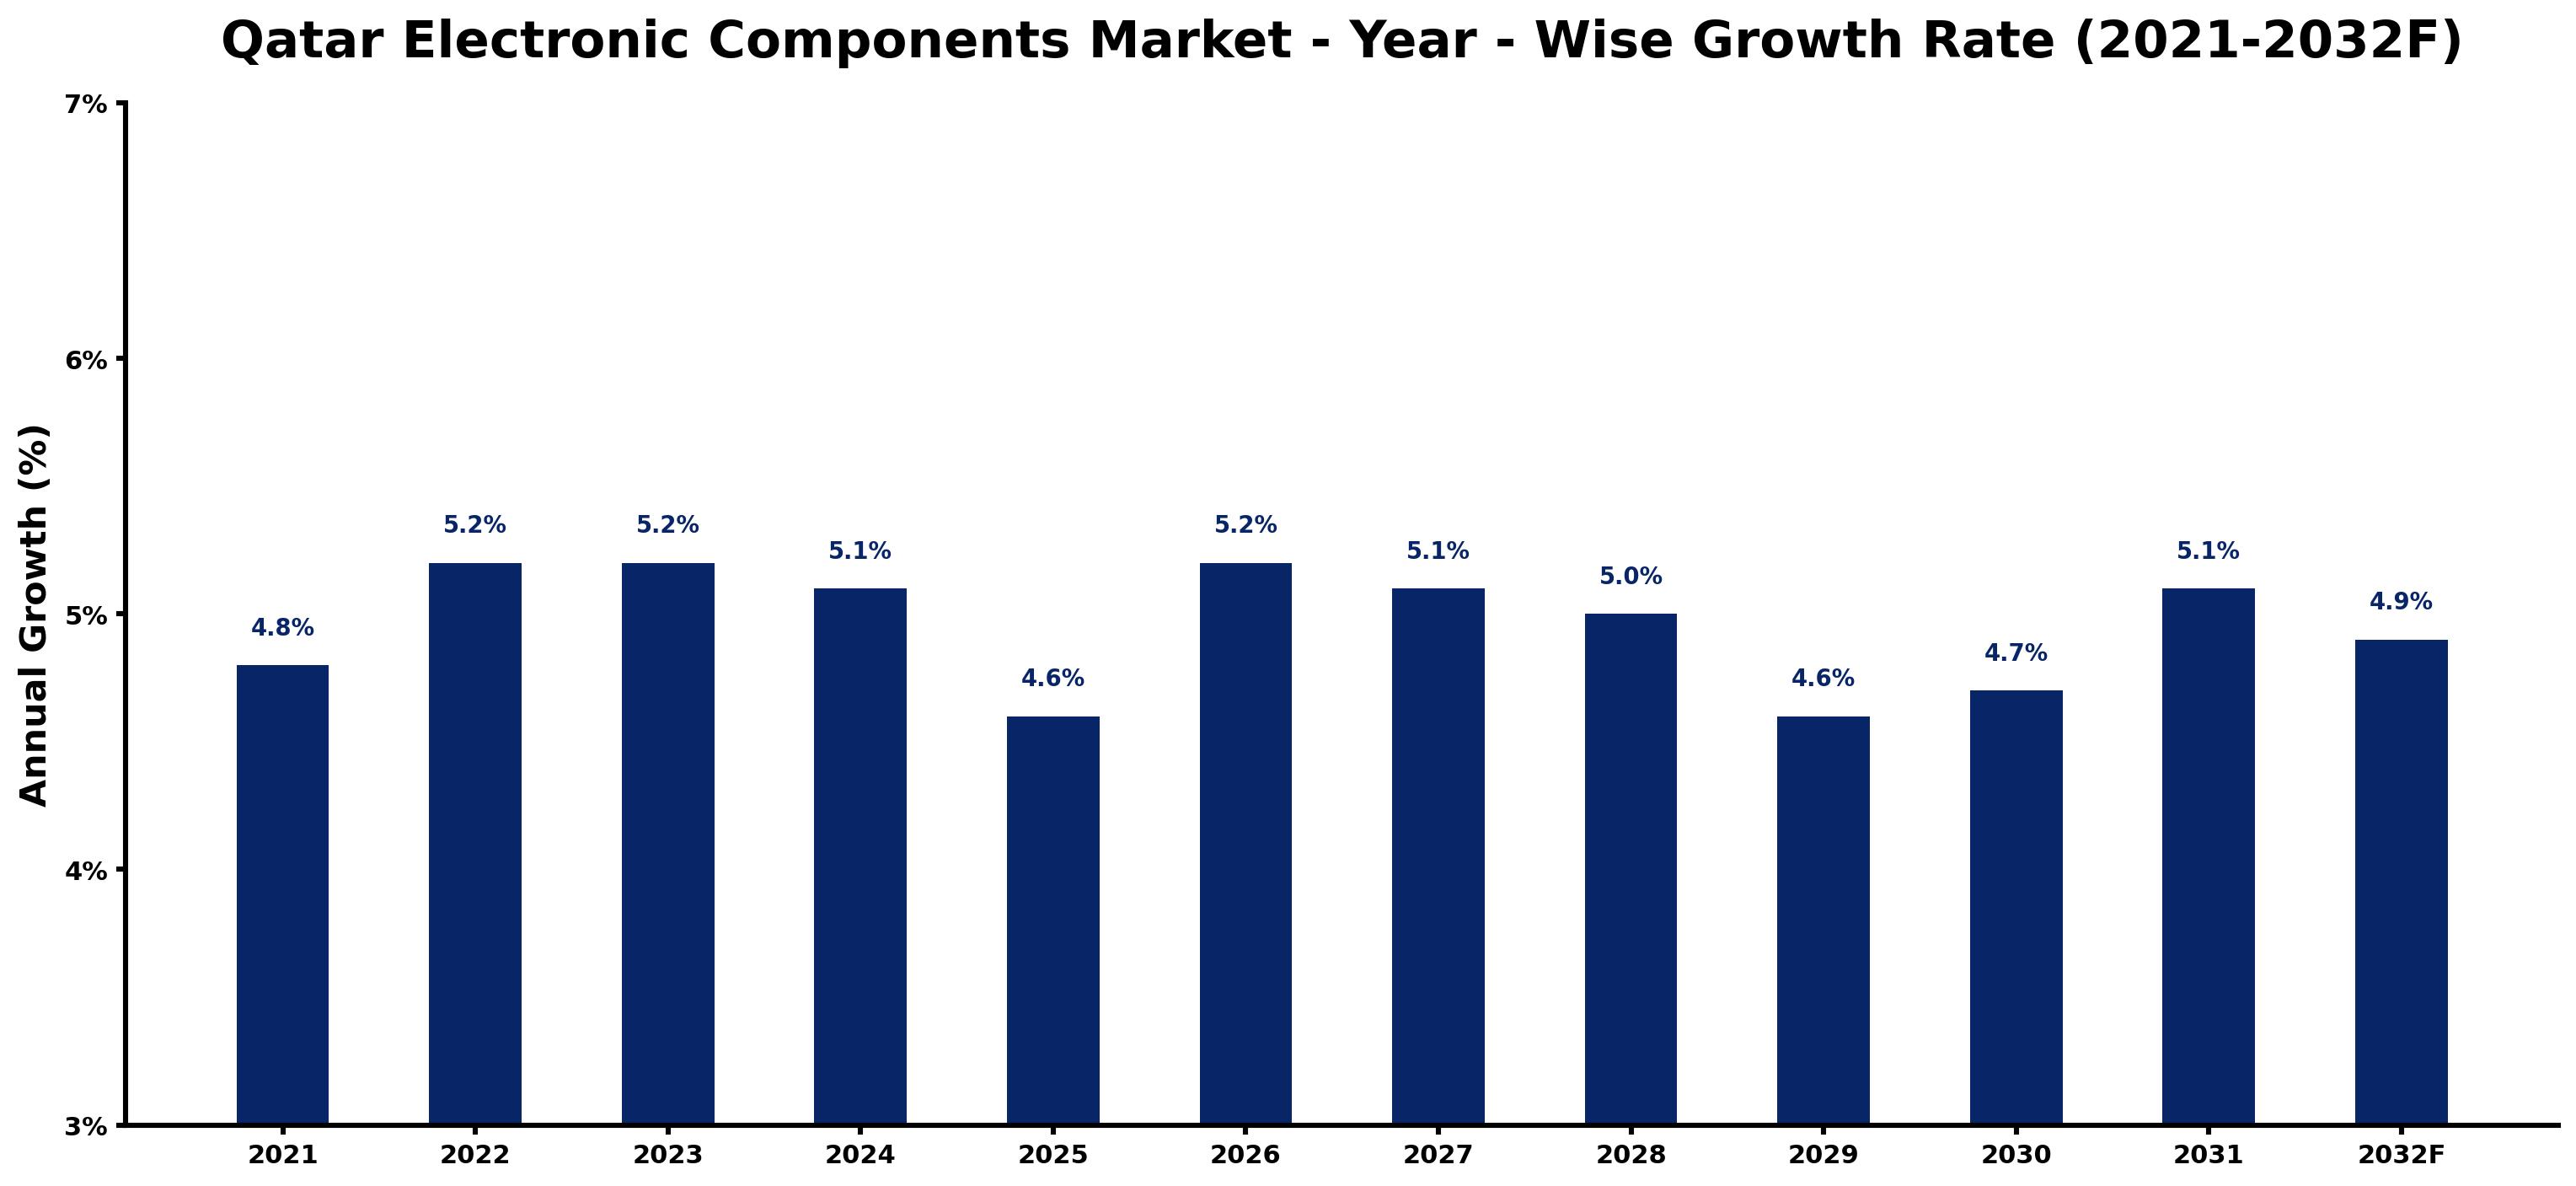
The table below presents the year wise growth rates along with the key drivers influencing the market
| Year | Growth Rate | Major Drivers |
| 2021 | 4.8% | Post-lockdown retail projects stimulated demand for electronic components across various sectors. |
| 2022 | 5.2% | Local firms focused on enhancing supply chains to meet increasing market competition. |
| 2023 | 5.2% | Major infrastructure projects pushed for more reliable and high-quality electronic components. |
| 2024 | 5.1% | The integration of IoT devices created new opportunities for component manufacturers in Qatar. |
| 2025 | 4.6% | International partnerships emerged, boosting technology transfer and local innovation efforts. |
| 2026 | 5.2% | Sustainability trends prompted companies to seek greener electronic solutions and practices. |
| 2027 | 5.1% | Regional trade agreements opened up pathways for exporting local electronic products effectively. |
| 2028 | 5.0% | Demand for automotive electronics surged due to rising electric vehicle adoption in Qatar. |
| 2029 | 4.6% | A shift towards smart home solutions expanded markets for related electronic components significantly. |
| 2030 | 4.7% | Technological advancements in renewable energy systems highlighted the need for specialized components. |
| 2031 | 5.1% | Growing cybersecurity concerns led to increased investments in secure electronic systems across sectors. |
| 2032 | 4.9% | Smart city initiatives required innovative electronic components to support urban infrastructure demands. |
Note - Market size estimations and growth projections presented in this report are based on 6Wresearch's advanced forecasting approach, validated with industry datasets as of June 2026.
Qatar Electronic Components Market Synopsis
The Qatar Electronic Components Market is projected to reach 5.2% and witness significant growth during the forecast period (2026-2032). Qatar serves as a pivotal hub for electronic components within the Middle East, characterized by the presence of numerous leading international companies leveraging the country's abundant resources. The expansion of Qatar's economy has been a driving force behind the increased demand for electronic components, fueled by the robust hydrocarbon sector and extensive infrastructure development initiatives.
Qatar Electronic Components Market Growth Drivers
Several factors are contributing to the growth of the Qatar Electronic Components Market:
- The government's favorable policies promoting foreign investment have created a supportive environment for businesses operating within the electronic components sector.
- Access to high-quality raw materials has been streamlined, ensuring that manufacturers can source the necessary inputs without significant delays or quality concerns.
- Rising consumer spending in Qatar is driving demand for advanced electronic devices, further stimulating the need for various electronic components.
- Rapid technological advancements are encouraging the adoption of innovative electronic solutions across various industries, prompting local manufacturers to expand their offerings.
- Competition among domestic players has intensified, leading to improvements in product quality and customer service, which ultimately benefits end-users.
Qatar Electronic Components Market Challenges and Restraints
Despite the positive outlook, the Qatar Electronic Components Market faces several challenges that could impede growth:
- Limited availability of advanced technology and equipment in the local market hinders the ability to produce cutting-edge electronic components.
- A conservative approach among local users has led to slow adoption rates of new technologies, affecting overall market growth.
- The lack of extensive research and development facilities within Qatar restricts innovation and the introduction of new products.
- Strict import regulations can deter businesses from exporting locally manufactured electronic components, impacting their market reach.
- Recent global supply chain disruptions, particularly due to the Covid-19 pandemic, have left a lasting impact on the production processes and logistics of electronic components.
Qatar Electronic Components Market Government Investment and Initiatives
The Qatar government plays a crucial role in fostering the growth of the electronic components sector through various initiatives and investments:
- Government policies aimed at enhancing foreign direct investment have set a positive precedent for businesses looking to establish operations in Qatar.
- Public spending on infrastructure development has created demand for a wide range of electronic components, benefiting the local market.
- Incentives such as tax exemptions and subsidies on utilities have made it economically viable for manufacturers to operate in the region.
- Development plans aligned with Qatar National Vision 2030 emphasize the importance of diversifying the economy, thereby enhancing support for the technology sector.
- Collaborations between public institutions and private entities aim to boost research and development capabilities, which are essential for sustaining long-term growth in the sector.
Qatar Electronic Components Market Latest Developments (May 2025 - June 2026)
During the period from May 2025 to June 2026, the Qatar Electronic Components Market has experienced several notable developments:
- The introduction of new government policies to streamline the importation of advanced electronic technologies has improved access for local manufacturers.
- Increased collaboration between educational institutions and the private sector has enhanced skills training, addressing the shortage of experienced personnel.
- Growing emphasis on sustainability and energy efficiency has encouraged the development of eco-friendly electronic components, aligning with global trends.
- Efforts to enhance the supply chain resilience have led to investments in logistics and distribution networks, positively affecting deliveries and costs.
- The market has seen heightened international interest, with several foreign entities exploring opportunities to enter the Qatari electronic components landscape.
Qatar Electronic Components Market - Key Attractiveness of the Report
- 10 Years of Market Numbers
- Historical Data Starting from 2022 to 2025
- Base Year: 2025
- Forecast Data until 2032
- Key Performance Indicators Impacting the Market
- Major Upcoming Developments and Projects
Key Highlights of the Report:
- Qatar Electronic Components Market Outlook
- Market Size of Qatar Electronic Components Market, 2025
- Forecast of Qatar Electronic Components Market, 2032
- Historical Data and Forecast of Qatar Electronic Components Revenues & Volume for the Period 2022-2032F
- Qatar Electronic Components Market Trend Evolution
- Qatar Electronic Components Market Drivers and Challenges
- Qatar Electronic Components Price Trends
- Qatar Electronic Components Porter's Five Forces
- Qatar Electronic Components Industry Life Cycle
- Historical Data and Forecast of Qatar Electronic Components Market Revenues & Volume By Types for the Period 2022-2032F
- Historical Data and Forecast of Qatar Electronic Components Market Revenues & Volume By Passive for the Period 2022-2032F
- Historical Data and Forecast of Qatar Electronic Components Market Revenues & Volume By Active for the Period 2022-2032F
- Historical Data and Forecast of Qatar Electronic Components Market Revenues & Volume By Electro Mechanic for the Period 2022-2032F
- Historical Data and Forecast of Qatar Electronic Components Market Revenues & Volume By Applications for the Period 2022-2032F
- Historical Data and Forecast of Qatar Electronic Components Market Revenues & Volume By Automotive for the Period 2022-2032F
- Historical Data and Forecast of Qatar Electronic Components Market Revenues & Volume By Communications for the Period 2022-2032F
- Historical Data and Forecast of Qatar Electronic Components Market Revenues & Volume By Industrial for the Period 2022-2032F
- Historical Data and Forecast of Qatar Electronic Components Market Revenues & Volume By Computing Applications for the Period 2022-2032F
- Historical Data and Forecast of Qatar Electronic Components Market Revenues & Volume By Others for the Period 2022-2032F
- Qatar Electronic Components Import Export Trade Statistics
- Market Opportunity Assessment By Types
- Market Opportunity Assessment By Applications
- Qatar Electronic Components Top Companies Market Share
- Qatar Electronic Components Competitive Benchmarking By Technical and Operational Parameters
- Qatar Electronic Components Company Profiles
- Qatar Electronic Components Key Strategic Recommendations
Frequently Asked Questions About the Market Study (FAQs):
Here are some frequently asked questions regarding the Qatar Electronic Components Market:
The primary drivers include favorable government policies, rising consumer spending, and technological advancements.
The market faces challenges such as limited access to advanced technology, conservative adoption rates, and strict import regulations.
The pandemic has led to decreased consumer spending and disrupted supply chains, impacting overall market demand.
6Wresearch actively monitors the Qatar Electronic Components Market and publishes its comprehensive annual report, highlighting emerging trends, growth drivers, revenue analysis, and forecast outlook. Our insights help businesses to make data-backed strategic decisions with ongoing market dynamics. Our analysts track relevent industries related to the Qatar Electronic Components Market, allowing our clients with actionable intelligence and reliable forecasts tailored to emerging regional needs.
Yes, we provide customisation as per your requirements. To learn more, feel free to contact us on sales@6wresearch.com
1 Executive Summary |
2 Introduction |
2.1 Key Highlights of the Report |
2.2 Report Description |
2.3 Market Scope & Segmentation |
2.4 Research Methodology |
2.5 Assumptions |
3 Qatar Electronic Components Market Overview |
3.1 Qatar Country Macro Economic Indicators |
3.2 Qatar Electronic Components Market Revenues & Volume, 2022 & 2032F |
3.3 Qatar Electronic Components Market - Industry Life Cycle |
3.4 Qatar Electronic Components Market - Porter's Five Forces |
3.5 Qatar Electronic Components Market Revenues & Volume Share, By Types, 2022 & 2032F |
3.6 Qatar Electronic Components Market Revenues & Volume Share, By Applications, 2022 & 2032F |
4 Qatar Electronic Components Market Dynamics |
4.1 Impact Analysis |
4.2 Market Drivers |
4.3 Market Restraints |
5 Qatar Electronic Components Market Trends |
6 Qatar Electronic Components Market, By Types |
6.1 Qatar Electronic Components Market, By Types |
6.1.1 Overview and Analysis |
6.1.2 Qatar Electronic Components Market Revenues & Volume, By Types, 2022-2032F |
6.1.3 Qatar Electronic Components Market Revenues & Volume, By Passive , 2022-2032F |
6.1.4 Qatar Electronic Components Market Revenues & Volume, By Active, 2022-2032F |
6.1.5 Qatar Electronic Components Market Revenues & Volume, By Electro Mechanic, 2022-2032F |
6.2 Qatar Electronic Components Market, By Applications |
6.2.1 Overview and Analysis |
6.2.2 Qatar Electronic Components Market Revenues & Volume, By Automotive, 2022-2032F |
6.2.3 Qatar Electronic Components Market Revenues & Volume, By Communications, 2022-2032F |
6.2.4 Qatar Electronic Components Market Revenues & Volume, By Industrial, 2022-2032F |
6.2.5 Qatar Electronic Components Market Revenues & Volume, By Computing Applications, 2022-2032F |
6.2.6 Qatar Electronic Components Market Revenues & Volume, By Others, 2022-2032F |
7 Qatar Electronic Components Market Import-Export Trade Statistics |
7.1 Qatar Electronic Components Market Export to Major Countries |
7.2 Qatar Electronic Components Market Imports from Major Countries |
8 Qatar Electronic Components Market Key Performance Indicators |
9 Qatar Electronic Components Market - Opportunity Assessment |
9.1 Qatar Electronic Components Market Opportunity Assessment, By Types, 2022 & 2032F |
9.2 Qatar Electronic Components Market Opportunity Assessment, By Applications, 2022 & 2032F |
10 Qatar Electronic Components Market - Competitive Landscape |
10.1 Qatar Electronic Components Market Revenue Share, By Companies, 2025 |
10.2 Qatar Electronic Components Market Competitive Benchmarking, By Operating and Technical Parameters |
11 Company Profiles |
12 Recommendations |
13 Disclaimer |
Global Go To Market Strategy - 2030
Export potential enables firms to identify high-growth global markets with greater confidence by combining advanced trade intelligence with a structured quantitative methodology. The framework analyzes emerging demand trends and country-level import patterns while integrating macroeconomic and trade datasets such as GDP and population forecasts, bilateral import–export flows, tariff structures, elasticity differentials between developed and developing economies, geographic distance, and import demand projections. Using weighted trade values from 2020–2024 as the base period to project country-to-country export potential for 2030, these inputs are operationalized through calculated drivers such as gravity model parameters, tariff impact factors, and projected GDP per-capita growth. Through an analysis of hidden potentials, demand hotspots, and market conditions that are most favorable to success, this method enables firms to focus on target countries, maximize returns, and global expansion with data, backed by accuracy.
By factoring in the projected importer demand gap that is currently unmet and could be potential opportunity, it identifies the potential for the Exporter (Country) among 190 countries, against the general trade analysis, which identifies the biggest importer or exporter.
To discover high-growth global markets and optimize your business strategy:
Click Here
Pricing
- Single User License$ 1,995
- Department License$ 2,400
- Site License$ 3,120
- Global License$ 3,795

Leadership Perspectives from Industry Events
Search
Thought Leadership and Analyst Meet


Our Clients
6WResearch In News
- India Air Conditioner Market Set for Strong Rebound in 2026 After Weather-Led Correction and GST-Driven Recovery: 6Wresearch
- ADAS in India: How Automatic Emergency Braking, Blind Spot Detection & Driver Monitoring are Transforming Road Safety
- Doha a strategic location for EV manufacturing hub: IPA Qatar
- Demand for luxury TVs surging in the GCC, says Samsung
- Empowering Growth: The Thriving Journey of Bangladesh’s Cable Industry
- Demand for luxury TVs surging in the GCC, says Samsung
Latest Reports
- Poland Fire Protection Systems Market (2026-2032)
- Cape Verde Portable Hand-Thrown Extinguisher Market (2026-2032)
- Canada Portable Hand-Thrown Extinguisher Market (2026-2032)
- Cameroon Portable Hand-Thrown Extinguisher Market (2026-2032)
- Burundi Portable Hand-Thrown Extinguisher Market (2026-2032)
- Burkina Faso Portable Hand-Thrown Extinguisher Market (2026-2032)
- Bulgaria Portable Hand-Thrown Extinguisher Market (2026-2032)
- Brunei Portable Hand-Thrown Extinguisher Market (2026-2032)
- Botswana Portable Hand-Thrown Extinguisher Market (2026-2032)
- Bosnia and Herzegovina Portable Hand-Thrown Extinguisher Market (2026-2032)
Industry Events and Analyst Meet

HIMTEX 2026

India Refining Summit 2026

India EV Show 2026

EV tech India Expo 2026

Auto Tech Asia 2026
Whitepaper
- Middle East & Africa Commercial Security Market Click here to view more.
- Middle East & Africa Fire Safety Systems & Equipment Market Click here to view more.
- GCC Drone Market Click here to view more.
- Middle East Lighting Fixture Market Click here to view more.
- GCC Physical & Perimeter Security Market Click here to view more.