Kenya Potassium chlorate Market (2026-2032) Outlook | Share, Industry, Analysis, Forecast, Trends, Size, Revenue, Value, Growth & Companies
Market Forecast By Product type (Pharmaceutical Grade, Chemical Grade), By End-use (Explosives, Matches, Disinfectants, Bleaches, Medical) And Competitive Landscape
| Product Code: ETC103569 | Publication Date: Jun 2021 | Updated Date: Jun 2026 | Product Type: Report | |
| Publisher: 6Wresearch | Author: Bhawna Singh | No. of Pages: 70 | No. of Figures: 35 | No. of Tables: 5 |
Kenya Potassium chlorate Market Size, Share & Growth Rate
The Kenya Potassium chlorate Market was estimated at USD 654 Million in 2025 and is projected to reach USD 929 Million by 2032, growing at a CAGR of 5.1% from 2026 to 2032. This growth trajectory is largely fueled by the expanding applications of potassium chlorate in industries such as agriculture and pyrotechnics. The vibrant demand for fireworks during various festivities and the herbicidal use of potassium chlorate are critical drivers of market expansion.
Kenya Potassium chlorate Market Growth Rate Analysis (2021-2032)
The Kenya potassium chlorate market has shown a robust average yearly growth of approximately 6.1% from 2021 to 2023, driven by a steady rise in demand from pyrotechnics and agricultural sectors. In 2022, growth slightly dipped to 6.0% due to supply chain challenges and rising raw material costs. However, a rebound to 6.2% in 2023 and a projected 6.4% in 2032 highlight an influx of investments aimed at improving production efficiency and infrastructure. Additionally, the ongoing digitalization of manufacturing processes and governmental support for chemical production are expected to further stabilize the market, despite minor fluctuations expected through 2028, when growth may slow to 5.7%.
Kenya Potassium chlorate Market Year-wise Growth Rate and Key Drivers
This graph highlights how the Kenya Potassium chlorate Market has steadily grown over the past five years, supported by major growth factors.
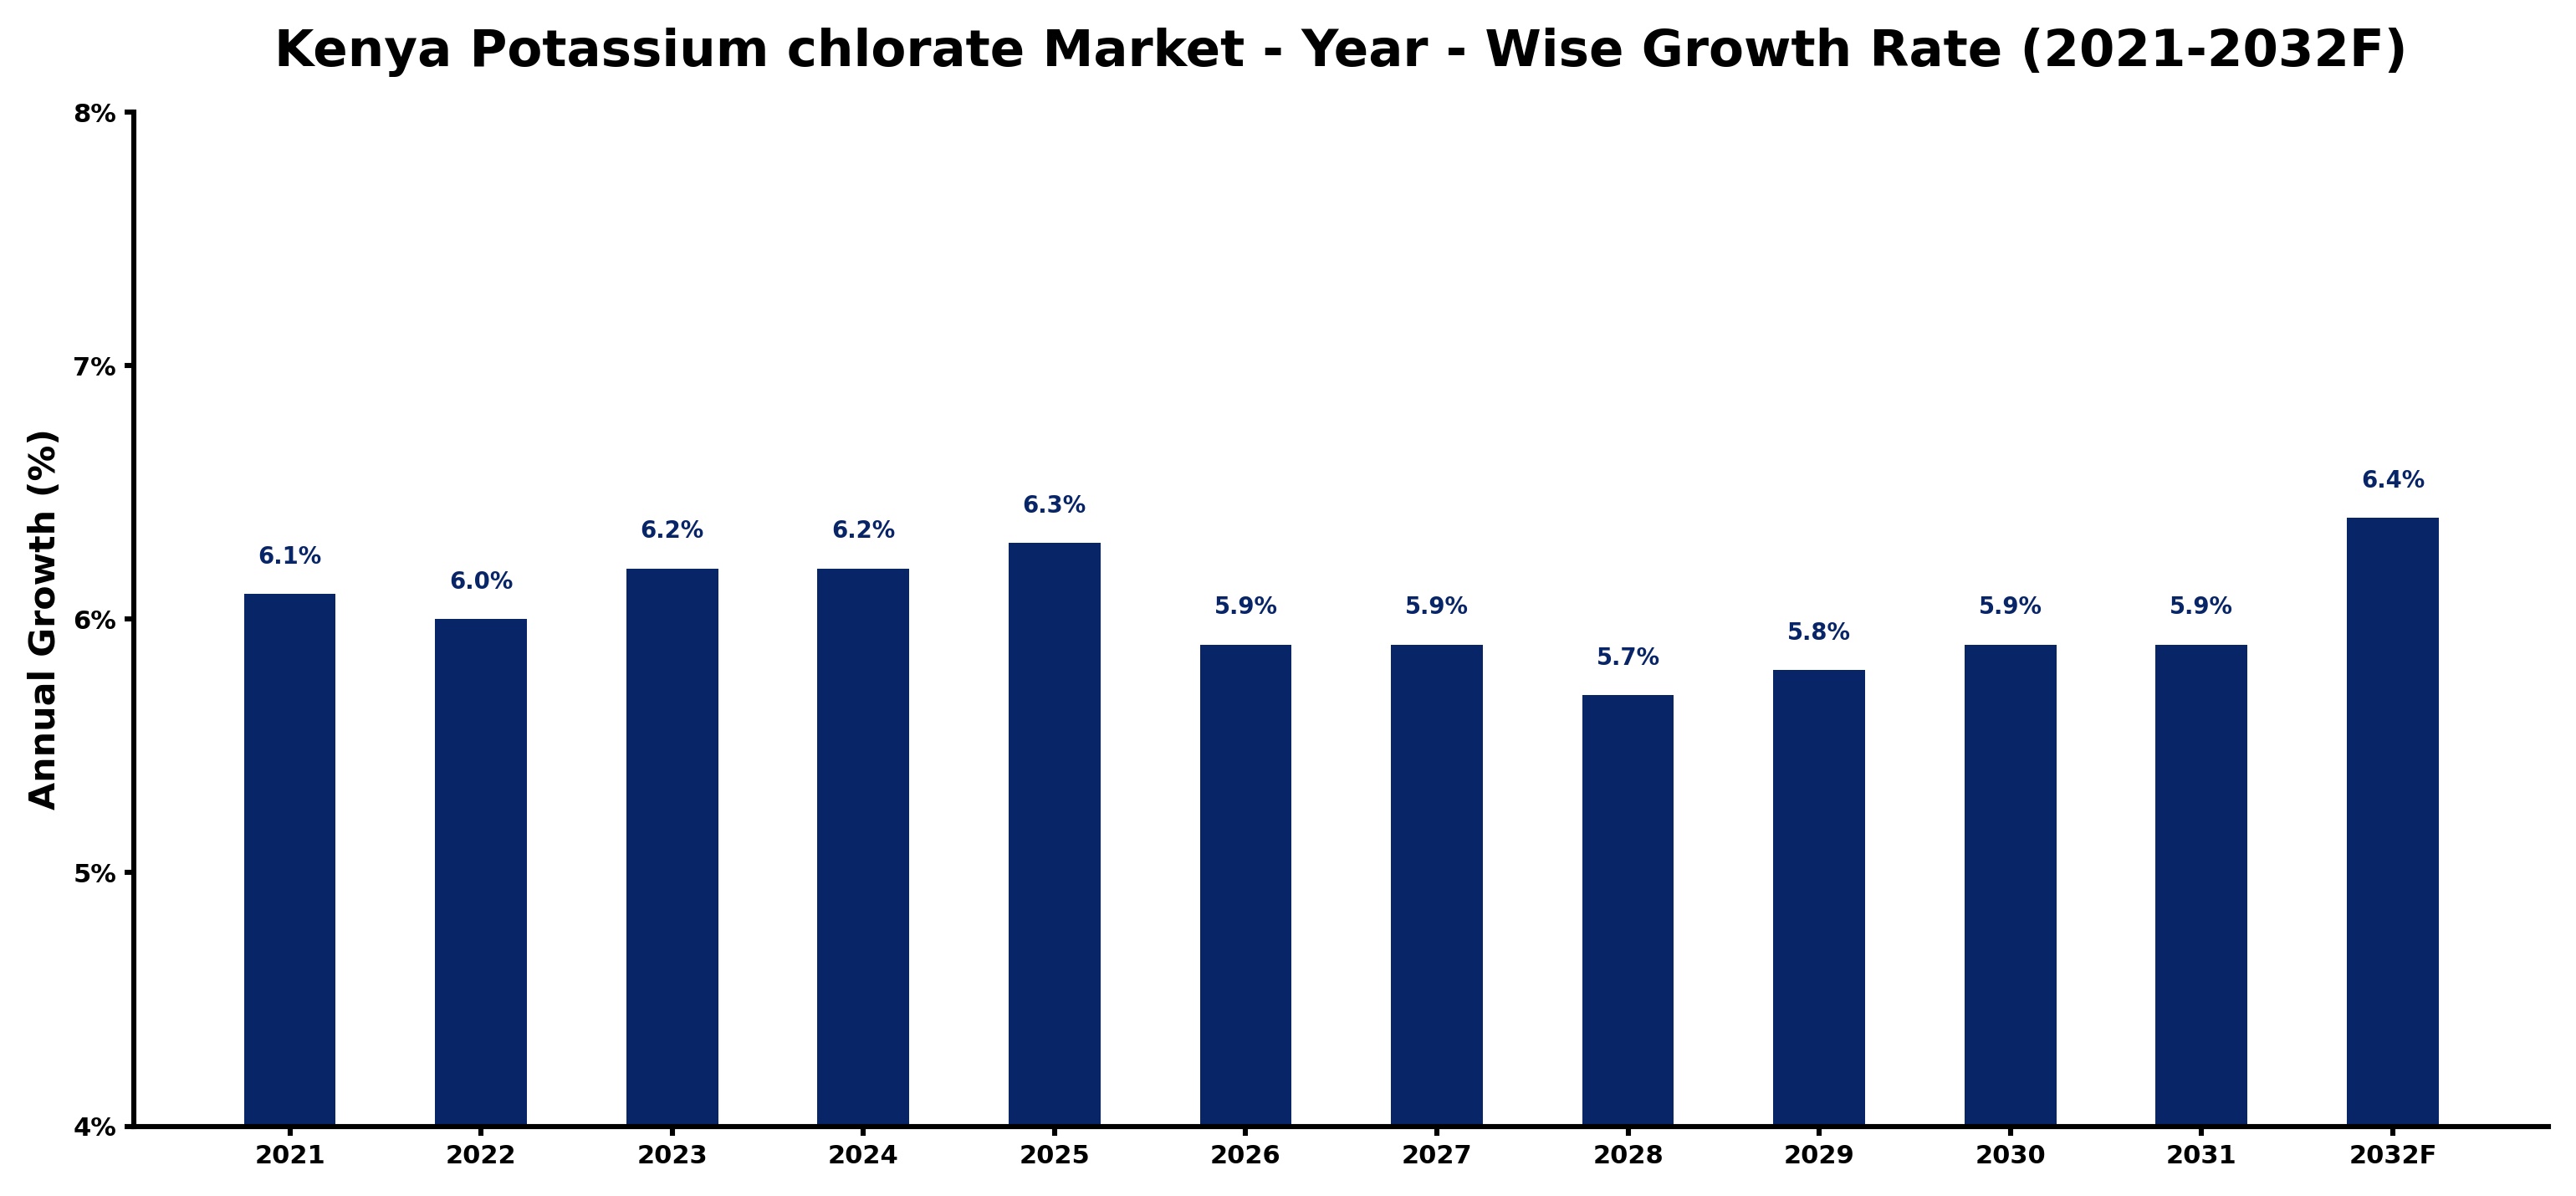
The table below presents the year‑wise growth rates along with the key drivers influencing the market
| Year | Growth Rate | Major Drivers |
| 2021 | 6.1% | Adoption of advanced manufacturing technologies boosts potassium chlorate output |
| 2022 | 6.0% | Improved local manufacturing capacity boosted potassium chlorate supply reliability |
| 2023 | 6.2% | Local chemical plants boost potassium chlorate output for exports |
| 2024 | 6.2% | Increased manufacturing investments boost potassium chlorate production capacity |
| 2025 | 6.3% | New manufacturing facilities boost potassium chlorate production capacity in Kenya |
| 2026 | 5.9% | Potassium chlorate production upgrades boost local chemical manufacturing capabilities |
| 2027 | 5.9% | New manufacturing plants enhance potassium chlorate production capacity |
| 2028 | 5.7% | Automation technology adoption boosts potassium chlorate production efficiency |
| 2029 | 5.8% | Chemical manufacturing capacity expansion drives potassium chlorate supply stability |
| 2030 | 5.9% | Production upgrades in chlorate plants boost export readiness significantly |
| 2031 | 5.9% | Local potassium chlorate manufacturers boost production capacity through modernization |
| 2032 | 6.4% | Local potassium chlorate manufacturers invest in advanced production technologies |
Note - Market size estimations and growth projections presented in this report are based on 6Wresearch’s advanced forecasting approach, validated with industry datasets as of June 2026.
Kenya Potassium chlorate Market Synopsis
In recent years, the Kenya Potassium chlorate market has gained momentum, primarily due to the robust demand from the fireworks and agricultural sectors. However, as the market matures, the focus is shifting toward innovative applications and sustainability initiatives that resonate with evolving consumer expectations.
Looking ahead, the Kenya Potassium chlorate market is anticipated to navigate both opportunities and challenges. The ongoing growth of infrastructure projects and the agriculture sector will further solidify its position. Yet, players must remain vigilant regarding regulatory frameworks and market dynamics that could influence their strategies.
Kenya Potassium chlorate Market Key Takeaways
- The market is anticipated to grow significantly, driven by the expanding applications across agriculture and pyrotechnics.
- Regulatory frameworks pose both challenges and opportunities for compliant market players.
- Sustainable practices are gaining traction as companies innovate to meet environmental standards.
- Infrastructure development in Kenya will catalyze further demand for potassium chlorate.
- Investment in education and compliance is essential for market players to mitigate risks associated with regulations.
Evaluation of Restraints in Kenya Potassium chlorate Market
Despite the growth potential, the Kenya Potassium chlorate market faces real limitations. Stringent regulations concerning the handling and storage of potassium chlorate create barriers to entry and operational hurdles for existing players. Inconsistent enforcement of these regulations often leads to confusion among manufacturers and distributors. Furthermore, the presence of alternative chemicals poses competitive threats, while limited infrastructure hampers efficient distribution. This complex environment necessitates strategic planning and adaptation from stakeholders wishing to thrive.
Kenya Potassium chlorate Market Trends
The market is currently shaped by notable trends towards sustainability and product innovation. Companies are increasingly adopting eco-friendly practices in response to consumer preferences and regulatory pressure. Additionally, the rise in popularity of fireworks displays is resulting in heightened demand for potassium chlorate in pyrotechnics. There is also a growing inclination towards the integration of potassium chlorate in agricultural solutions, particularly as a herbicide, which reflects a broader trend toward chemical applications that enhance crop yields while minimizing environmental impact.
Kenya Potassium chlorate Market Opportunities
With promising growth on the horizon, there are substantial investment opportunities in the Kenya Potassium chlorate market. The agriculture sector, as a major consumer, represents a lucrative avenue for growth as farmers increasingly turn to potassium chlorate for herbicide use. Moreover, the construction industry’s expanding needs for explosives in infrastructure projects present additional avenues for market entry and expansion. Investors may also consider initiatives geared towards innovation and sustainability, which are increasingly important in attracting consumer interest and complying with regulatory demands.
Government Initiatives in the Kenya Potassium chlorate Market
The Kenyan government has established stringent regulations surrounding the production and distribution of potassium chlorate to ensure safety and security. These regulations necessitate licenses and permits for manufacturers and distributors, along with regular inspections to maintain compliance. Efforts are also underway to create awareness about proper handling and disposal practices among industry players. Such initiatives aim to prevent illegal activities while fostering a responsible market environment.
Future Insights of the Kenya Potassium chlorate Market
The Kenya Potassium chlorate market is poised for continuous growth between 2026 and 2032, driven by diversification across various industrial applications. The ongoing adoption of potassium chlorate in agriculture, particularly as a herbicide, will play a significant role in shaping market dynamics. Additionally, the rise in demand from the fireworks and chemical manufacturing sectors underscores a robust future outlook. Technological advancements, alongside regulatory compliance, will be key determinants of how market players capitalize on emerging opportunities.
Kenya Potassium chlorate Market Latest Developments (May 2025 - June 2026)
Recent developments in the Kenya Potassium chlorate market indicate a notable shift towards compliance with environmental regulations. Companies are actively investing in sustainable production methods and engaging with regulatory bodies to enhance safety protocols. Additionally, strategic partnerships are emerging within the agricultural sector to promote the benefits of potassium chlorate as an effective herbicide, reflecting a proactive approach in addressing both market needs and environmental concerns.
Kenya Potassium chlorate Market - Key Attractiveness of the Report
- 10 Years of Market Numbers
- Historical Data Starting from 2022 to 2025
- Base Year: 2025
- Forecast Data until 2032
- Key Performance Indicators Impacting the Market
- Major Upcoming Developments and Projects
Key Highlights of the Report:
- Kenya Potassium chlorate Market Outlook
- Market Size of Kenya Potassium chlorate Market, 2025
- Forecast of Kenya Potassium chlorate Market, 2032
- Historical Data and Forecast of Kenya Potassium chlorate Revenues & Volume for the Period 2022-2032F
- Kenya Potassium chlorate Market Trend Evolution
- Kenya Potassium chlorate Market Drivers and Challenges
- Kenya Potassium chlorate Price Trends
- Kenya Potassium chlorate Porter's Five Forces
- Kenya Potassium chlorate Industry Life Cycle
- Historical Data and Forecast of Kenya Potassium chlorate Market Revenues & Volume By Product type for the Period 2022-2032F
- Historical Data and Forecast of Kenya Potassium chlorate Market Revenues & Volume By Pharmaceutical Grade for the Period 2022-2032F
- Historical Data and Forecast of Kenya Potassium chlorate Market Revenues & Volume By Chemical Grade for the Period 2022-2032F
- Historical Data and Forecast of Kenya Potassium chlorate Market Revenues & Volume By End-use for the Period 2022-2032F
- Historical Data and Forecast of Kenya Potassium chlorate Market Revenues & Volume By Explosives for the Period 2022-2032F
- Historical Data and Forecast of Kenya Potassium chlorate Market Revenues & Volume By Matches for the Period 2022-2032F
- Historical Data and Forecast of Kenya Potassium chlorate Market Revenues & Volume By Disinfectants for the Period 2022-2032F
- Historical Data and Forecast of Kenya Potassium chlorate Market Revenues & Volume By Bleaches for the Period 2022-2032F
- Historical Data and Forecast of Kenya Potassium chlorate Market Revenues & Volume By Medical for the Period 2022-2032F
- Kenya Potassium chlorate Import Export Trade Statistics
- Market Opportunity Assessment By Product type
- Market Opportunity Assessment By End-use
- Kenya Potassium chlorate Top Companies Market Share
- Kenya Potassium chlorate Competitive Benchmarking By Technical and Operational Parameters
- Kenya Potassium chlorate Company Profiles
- Kenya Potassium chlorate Key Strategic Recommendations
Kenya Potassium chlorate Market - Frequently Asked Questions
The primary drivers include strong demand from the agriculture sector for herbicidal applications and the increasing popularity of fireworks during festivals.
The Kenya Potassium chlorate Market was estimated at USD 654 Million in 2025 and is projected to reach USD 929 Million by 2032, growing at a CAGR of 5.1% from 2026 to 2032.
Companies face regulatory hurdles regarding the safe handling and use of potassium chlorate, as well as competition from alternative chemicals in various applications.
Significant opportunities lie within the agricultural sector and the growing construction industry, where potassium chlorate serves crucial functions in herbicides and explosives, respectively.
The government mandates strict licensing and compliance requirements for the production and distribution of potassium chlorate to ensure safety and prevent misuse.
Emerging trends include a shift toward sustainable practices, innovative product development, and a focus on meeting stricter environmental regulations.
6Wresearch actively monitors the Kenya Potassium chlorate Market and publishes its comprehensive annual report, highlighting emerging trends, growth drivers, revenue analysis, and forecast outlook. Our insights help businesses to make data-backed strategic decisions with ongoing market dynamics. Our analysts track relevent industries related to the Kenya Potassium chlorate Market, allowing our clients with actionable intelligence and reliable forecasts tailored to emerging regional needs.
Yes, we provide customisation as per your requirements. To learn more, feel free to contact us on sales@6wresearch.com
1 Executive Summary |
2 Introduction |
2.1 Key Highlights of the Report |
2.2 Report Description |
2.3 Market Scope & Segmentation |
2.4 Research Methodology |
2.5 Assumptions |
3 Kenya Potassium chlorate Market Overview |
3.1 Kenya Country Macro Economic Indicators |
3.2 Kenya Potassium chlorate Market Revenues & Volume, 2022 & 2032F |
3.3 Kenya Potassium chlorate Market - Industry Life Cycle |
3.4 Kenya Potassium chlorate Market - Porter's Five Forces |
3.5 Kenya Potassium chlorate Market Revenues & Volume Share, By Product type, 2022 & 2032F |
3.6 Kenya Potassium chlorate Market Revenues & Volume Share, By End-use, 2022 & 2032F |
4 Kenya Potassium chlorate Market Dynamics |
4.1 Impact Analysis |
4.2 Market Drivers |
4.3 Market Restraints |
5 Kenya Potassium chlorate Market Trends |
6 Kenya Potassium chlorate Market, By Types |
6.1 Kenya Potassium chlorate Market, By Product type |
6.1.1 Overview and Analysis |
6.1.2 Kenya Potassium chlorate Market Revenues & Volume, By Product type, 2022-2032F |
6.1.3 Kenya Potassium chlorate Market Revenues & Volume, By Pharmaceutical Grade, 2022-2032F |
6.1.4 Kenya Potassium chlorate Market Revenues & Volume, By Chemical Grade, 2022-2032F |
6.2 Kenya Potassium chlorate Market, By End-use |
6.2.1 Overview and Analysis |
6.2.2 Kenya Potassium chlorate Market Revenues & Volume, By Explosives, 2022-2032F |
6.2.3 Kenya Potassium chlorate Market Revenues & Volume, By Matches, 2022-2032F |
6.2.4 Kenya Potassium chlorate Market Revenues & Volume, By Disinfectants, 2022-2032F |
6.2.5 Kenya Potassium chlorate Market Revenues & Volume, By Bleaches, 2022-2032F |
6.2.6 Kenya Potassium chlorate Market Revenues & Volume, By Medical, 2022-2032F |
7 Kenya Potassium chlorate Market Import-Export Trade Statistics |
7.1 Kenya Potassium chlorate Market Export to Major Countries |
7.2 Kenya Potassium chlorate Market Imports from Major Countries |
8 Kenya Potassium chlorate Market Key Performance Indicators |
9 Kenya Potassium chlorate Market - Opportunity Assessment |
9.1 Kenya Potassium chlorate Market Opportunity Assessment, By Product type, 2022 & 2032F |
9.2 Kenya Potassium chlorate Market Opportunity Assessment, By End-use, 2022 & 2032F |
10 Kenya Potassium chlorate Market - Competitive Landscape |
10.1 Kenya Potassium chlorate Market Revenue Share, By Companies, 2025 |
10.2 Kenya Potassium chlorate Market Competitive Benchmarking, By Operating and Technical Parameters |
11 Company Profiles |
12 Recommendations |
13 Disclaimer |
Global Go To Market Strategy - 2030
Export potential enables firms to identify high-growth global markets with greater confidence by combining advanced trade intelligence with a structured quantitative methodology. The framework analyzes emerging demand trends and country-level import patterns while integrating macroeconomic and trade datasets such as GDP and population forecasts, bilateral import–export flows, tariff structures, elasticity differentials between developed and developing economies, geographic distance, and import demand projections. Using weighted trade values from 2020–2024 as the base period to project country-to-country export potential for 2030, these inputs are operationalized through calculated drivers such as gravity model parameters, tariff impact factors, and projected GDP per-capita growth. Through an analysis of hidden potentials, demand hotspots, and market conditions that are most favorable to success, this method enables firms to focus on target countries, maximize returns, and global expansion with data, backed by accuracy.
By factoring in the projected importer demand gap that is currently unmet and could be potential opportunity, it identifies the potential for the Exporter (Country) among 190 countries, against the general trade analysis, which identifies the biggest importer or exporter.
To discover high-growth global markets and optimize your business strategy:
Click Here
Pricing
- Single User License$ 1,995
- Department License$ 2,400
- Site License$ 3,120
- Global License$ 3,795

Leadership Perspectives from Industry Events
Search
Thought Leadership and Analyst Meet


Our Clients
6WResearch In News
- India Air Conditioner Market Set for Strong Rebound in 2026 After Weather-Led Correction and GST-Driven Recovery: 6Wresearch
- ADAS in India: How Automatic Emergency Braking, Blind Spot Detection & Driver Monitoring are Transforming Road Safety
- Doha a strategic location for EV manufacturing hub: IPA Qatar
- Demand for luxury TVs surging in the GCC, says Samsung
- Empowering Growth: The Thriving Journey of Bangladesh’s Cable Industry
- Demand for luxury TVs surging in the GCC, says Samsung
Latest Reports
- Poland Fire Protection Systems Market (2026-2032)
- Cape Verde Portable Hand-Thrown Extinguisher Market (2026-2032)
- Canada Portable Hand-Thrown Extinguisher Market (2026-2032)
- Cameroon Portable Hand-Thrown Extinguisher Market (2026-2032)
- Burundi Portable Hand-Thrown Extinguisher Market (2026-2032)
- Burkina Faso Portable Hand-Thrown Extinguisher Market (2026-2032)
- Bulgaria Portable Hand-Thrown Extinguisher Market (2026-2032)
- Brunei Portable Hand-Thrown Extinguisher Market (2026-2032)
- Botswana Portable Hand-Thrown Extinguisher Market (2026-2032)
- Bosnia and Herzegovina Portable Hand-Thrown Extinguisher Market (2026-2032)
Industry Events and Analyst Meet

HIMTEX 2026

India Refining Summit 2026

India EV Show 2026

EV tech India Expo 2026

Auto Tech Asia 2026
Whitepaper
- Middle East & Africa Commercial Security Market Click here to view more.
- Middle East & Africa Fire Safety Systems & Equipment Market Click here to view more.
- GCC Drone Market Click here to view more.
- Middle East Lighting Fixture Market Click here to view more.
- GCC Physical & Perimeter Security Market Click here to view more.