Kenya Refractory Material Market (2026-2032) Outlook | Analysis, Growth, Forecast, Value, Industry, Size, Trends, Companies, Share & Revenue
Market Forecast By Form (Shaped, Unshaped), By Chemical Composition (Alumina, Silica, Magnesia, Fireclay, Others), By Chemistry (Acidic, Basic, Neutral), By End-use (Metals & Metallurgy, Cement, Glass & Ceramics, Power Generation, Others) And Competitive Landscape
| Product Code: ETC195482 | Publication Date: May 2022 | Updated Date: Jun 2026 | Product Type: Market Research Report | |
| Publisher: 6Wresearch | Author: Dhaval Chaurasia | No. of Pages: 60 | No. of Figures: 40 | No. of Tables: 7 |
Kenya Refractory Material Market Size, Share & Growth Rate
The Kenya Refractory Material Market was estimated at USD 633 Million in 2025 and is projected to reach USD 910 Million by 2032, growing at a CAGR of 5.3% from 2026 to 2032. This growth trajectory is driven primarily by the expansion of the industrial sector, particularly in cement, steel, and glass manufacturing. Furthermore, as industries modernize and prioritize efficiency and sustainability, the demand for innovative, eco-friendly refractory materials continues to rise.
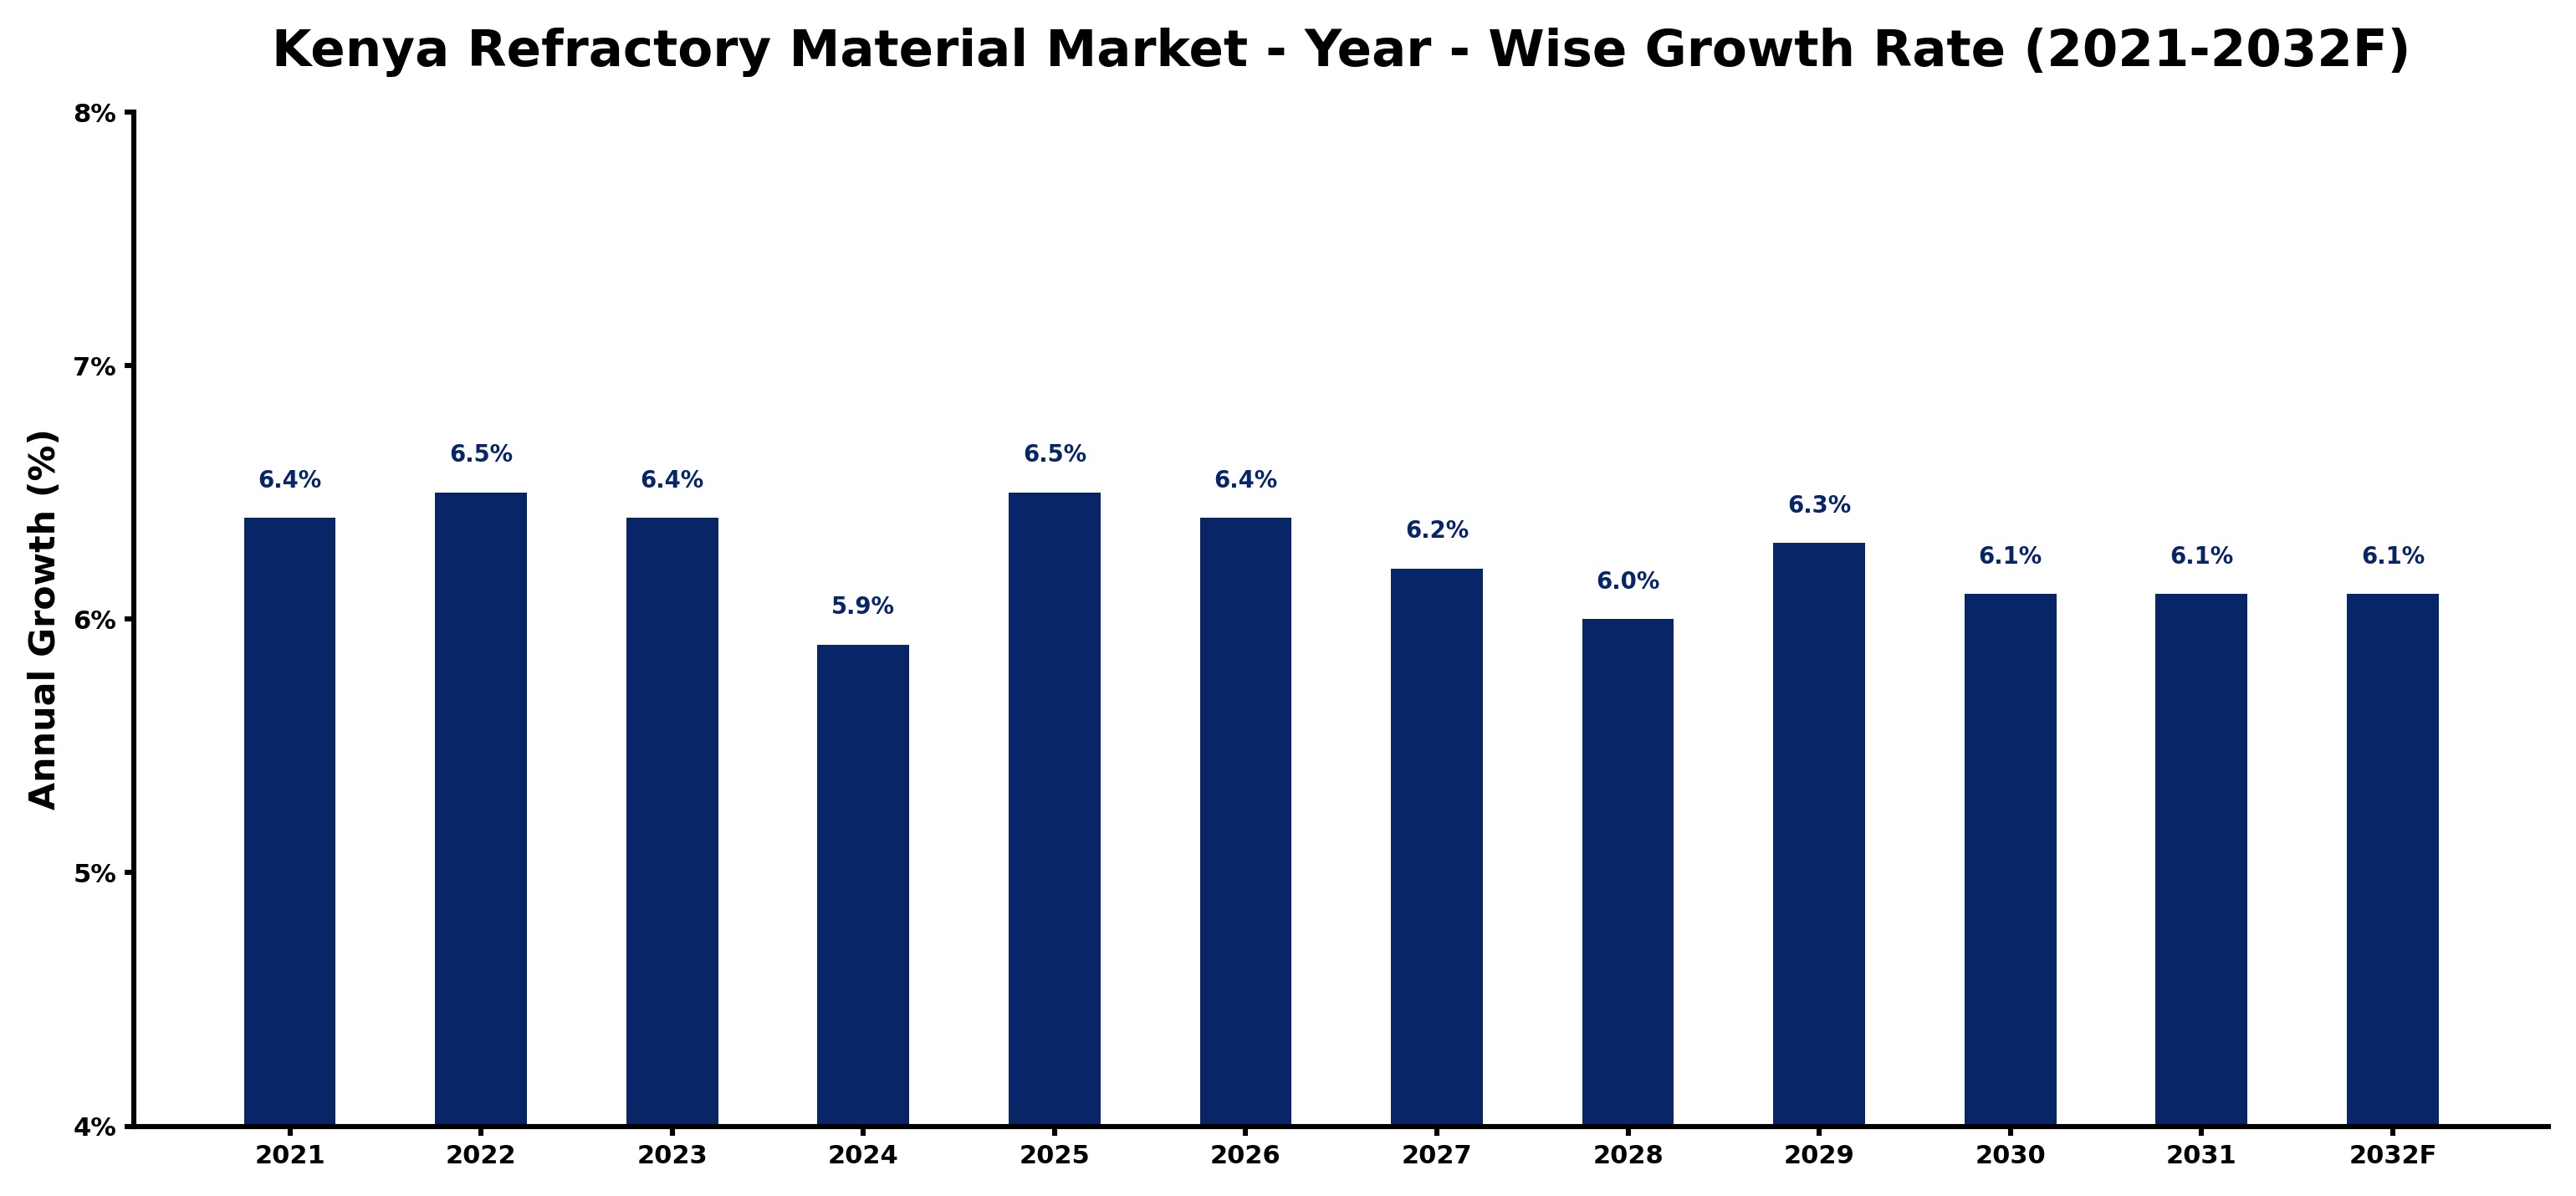
Kenya Refractory Material Market Growth Rate Analysis (2021-2032)
The Kenya refractory material market has shown a stable performance with annual growth rates maintaining a consistent range. In 2021, the market grew by 6.4%, followed by a slight increase to 6.5% in 2022. The growth trajectory persisted into 2023 with a steady 6.4%, attributed to heightened industrial activities, particularly in the metallurgy and cement sectors, which have seen significant investments. However, a modest decline to 5.9% is anticipated in 2024, likely due to external supply chain challenges and fluctuating commodity prices. The market is projected to bounce back in subsequent years, achieving growth rates of 6.5% in 2025 and stabilizing around 6.1% by 2032, driven by ongoing infrastructure development and energy transition initiatives.
Kenya Refractory Material Market Year-wise Growth Rate and Key Drivers
This graph highlights how the Kenya Refractory Material Market has steadily grown over the past five years, supported by major growth factors.
The table below presents the year‑wise growth rates along with the key drivers influencing the market
| Year | Growth Rate | Major Drivers |
| 2021 | 6.4% | Increased industrial production demand |
| 2022 | 6.5% | Infrastructure development projects initiated |
| 2023 | 6.4% | Mining sector growth accelerated usage |
| 2024 | 5.9% | Energy sector investments expanded needs |
| 2025 | 6.5% | Manufacturing capacity enhancements implemented |
| 2026 | 6.4% | Technological advancements improved efficiency |
| 2027 | 6.2% | Construction activities drove material needs |
| 2028 | 6.0% | Export opportunities expanded market reach |
| 2029 | 6.3% | Local sourcing initiatives gained traction |
| 2030 | 6.1% | Sustainability trends influenced material choices |
| 2031 | 6.1% | Regulatory support encouraged industry growth |
| 2032 | 6.1% | Innovation in refractory applications emerged |
Note - Market size estimations and growth projections presented in this report are based on 6Wresearch’s advanced forecasting approach, validated with industry datasets as of June 2026.
Kenya Refractory Material Market Synopsis
Currently, the Kenya refractory material market is benefiting from increased industrial activities across various sectors. The growing recognition of the importance of high-temperature resistance materials has prompted a shift towards advanced refractory solutions. Local manufacturers are beginning to realize the need for innovation to align with international standards and practices.
Moreover, the market is witnessing a notable trend toward sustainability, with many companies exploring eco-friendly materials that comply with stringent environmental regulations. This shift not only caters to consumer preferences but also aligns with government initiatives aimed at reducing carbon emissions within the industrial landscape.
Kenya Refractory Material Market Key Takeaways
- The market is expected to grow steadily, reflecting industrialization and a shift towards advanced materials.
- Sustainability and eco-friendliness are key drivers influencing the adoption of new refractory materials.
- Domestic production capabilities are essential to meet the rising demand and reduce import dependence.
- Technological advancements and R&D are crucial for developing durable and high-performance refractory solutions.
- Collaborations between local and international companies are enhancing product offerings and market reach.
Evaluation of Restraints in Kenya Refractory Material Market
Despite the optimistic outlook, the Kenya refractory material market faces several challenges. A significant restraint is the limited domestic production capacity, which results in high reliance on imports. This dependence not only raises production costs due to fluctuating raw material prices but also affects the quality and availability of products. Moreover, the market struggles with inadequate infrastructure and logistics, which exacerbate delivery times and transportation expenses, further hindering market growth. Awareness about the critical role of high-quality refractory materials remains low among local industries, necessitating targeted educational initiatives.
Kenya Refractory Material Market Trends
The current landscape of the Kenya refractory material market is influenced by several key trends. A pronounced focus on sustainable practices is driving the demand for environmentally friendly materials, as industries increasingly seek to comply with global standards. Furthermore, advanced technological solutions are being developed to enhance the performance characteristics of refractory materials, particularly in high-temperature settings. Collaborative efforts among manufacturers are also on the rise, allowing for innovation in product development and greater market penetration.
Kenya Refractory Material Market Opportunities
The Kenya refractory material market presents ample investment opportunities as industrial sectors such as steel, cement, and glass continue to flourish. Opportunities exist for the production of high-quality refractory materials that can cater to the unique needs of local industries. Additionally, the trend towards sustainability opens avenues for the development of innovative, energy-efficient products. Strategic partnerships with local businesses and the establishment of robust distribution networks for high-quality imports could significantly enhance market presence and profitability.
Government Initiatives in the Kenya Refractory Material Market
The Kenyan government is actively promoting local manufacturing to bolster the refractory material market through policies aimed at reducing reliance on imports. Initiatives like the Buy Kenya Build Kenya policy encourage the use of locally sourced materials in construction and industrial applications. Furthermore, various tax incentives and subsidies are available for local manufacturers, designed to foster domestic production and create employment opportunities. These government efforts underscore a commitment to sustainability and environmental compliance, shaping the future trajectory of the refractory industry.
Future Insights of the Kenya Refractory Material Market
Looking ahead to 2026-2032, the Kenya refractory material market is set to experience significant growth, fueled by ongoing industrialization and infrastructure development. As key sectors evolve, the demand for high-quality, efficient refractory materials will likely increase, driven by an emphasis on modern technologies and environmental stewardship. Anticipated investments in innovative solutions will play a pivotal role in shaping the market landscape, ensuring that Kenya remains competitive in the global refractory materials sphere.
Kenya Refractory Material Market Latest Developments (May 2025 - June 2026)
Recent developments in the Kenya refractory material market indicate a notable shift towards eco-friendly materials. Companies are increasingly investing in R&D to enhance the thermal resistance and durability of their products. Collaborative ventures between local and foreign firms are emerging, aimed at expanding market access and improving product offerings. Furthermore, public discourse around sustainability is influencing the design and marketing of new refractory solutions, aligning business practices with broader environmental goals.
Kenya Refractory Material Market - Key Attractiveness of the Report
- 10 Years of Market Numbers
- Historical Data Starting from 2022 to 2025
- Base Year: 2025
- Forecast Data until 2032
- Key Performance Indicators Impacting the Market
- Major Upcoming Developments and Projects
Key Highlights of the Report:
- Kenya Refractory Material Market Outlook
- Market Size of Kenya Refractory Material Market, 2025
- Forecast of Kenya Refractory Material Market, 2032
- Historical Data and Forecast of Kenya Refractory Material Revenues & Volume for the Period 2022-2032F
- Kenya Refractory Material Market Trend Evolution
- Kenya Refractory Material Market Drivers and Challenges
- Kenya Refractory Material Price Trends
- Kenya Refractory Material Porter's Five Forces
- Kenya Refractory Material Industry Life Cycle
- Historical Data and Forecast of Kenya Refractory Material Market Revenues & Volume By Form for the Period 2022-2032F
- Historical Data and Forecast of Kenya Refractory Material Market Revenues & Volume By Shaped for the Period 2022-2032F
- Historical Data and Forecast of Kenya Refractory Material Market Revenues & Volume By Unshaped for the Period 2022-2032F
- Historical Data and Forecast of Kenya Refractory Material Market Revenues & Volume By Chemical Composition for the Period 2022-2032F
- Historical Data and Forecast of Kenya Refractory Material Market Revenues & Volume By Alumina for the Period 2022-2032F
- Historical Data and Forecast of Kenya Refractory Material Market Revenues & Volume By Silica for the Period 2022-2032F
- Historical Data and Forecast of Kenya Refractory Material Market Revenues & Volume By Magnesia for the Period 2022-2032F
- Historical Data and Forecast of Kenya Refractory Material Market Revenues & Volume By Fireclay for the Period 2022-2032F
- Historical Data and Forecast of Kenya Refractory Material Market Revenues & Volume By Others for the Period 2022-2032F
- Historical Data and Forecast of Kenya Refractory Material Market Revenues & Volume By Chemistry for the Period 2022-2032F
- Historical Data and Forecast of Kenya Refractory Material Market Revenues & Volume By Acidic for the Period 2022-2032F
- Historical Data and Forecast of Kenya Refractory Material Market Revenues & Volume By Basic for the Period 2022-2032F
- Historical Data and Forecast of Kenya Refractory Material Market Revenues & Volume By Neutral for the Period 2022-2032F
- Historical Data and Forecast of Kenya Refractory Material Market Revenues & Volume By End-use for the Period 2022-2032F
- Historical Data and Forecast of Kenya Refractory Material Market Revenues & Volume By Metals & Metallurgy for the Period 2022-2032F
- Historical Data and Forecast of Kenya Refractory Material Market Revenues & Volume By Cement for the Period 2022-2032F
- Historical Data and Forecast of Kenya Refractory Material Market Revenues & Volume By Glass & Ceramics for the Period 2022-2032F
- Historical Data and Forecast of Kenya Refractory Material Market Revenues & Volume By Power Generation for the Period 2022-2032F
- Historical Data and Forecast of Kenya Refractory Material Market Revenues & Volume By Others for the Period 2022-2032F
- Kenya Refractory Material Import Export Trade Statistics
- Market Opportunity Assessment By Form
- Market Opportunity Assessment By Chemical Composition
- Market Opportunity Assessment By Chemistry
- Market Opportunity Assessment By End-use
- Kenya Refractory Material Top Companies Market Share
- Kenya Refractory Material Competitive Benchmarking By Technical and Operational Parameters
- Kenya Refractory Material Company Profiles
- Kenya Refractory Material Key Strategic Recommendations
Kenya Refractory Material Market - Frequently Asked Questions
The Kenya refractory material market is expected to grow at a CAGR of 5.3% from 2026 to 2032, indicating robust growth compared to other regional markets driven by similar industrial expansions.
The key sectors driving demand include cement, steel, glass manufacturing, and petrochemicals, all of which rely on high-performance refractory solutions for their operations.
Local manufacturers grapple with limited production capacity, a lack of awareness regarding the benefits of high-quality refractory materials, and the challenges posed by fluctuating raw material prices.
Yes, there is a growing emphasis on sustainability and the development of eco-friendly refractory materials in response to environmental regulations and market demand for greener options.
Government initiatives, such as the Buy Kenya Build Kenya policy, promote local production and usage of materials, thereby fostering market growth and encouraging domestic investment.
6Wresearch actively monitors the Kenya Refractory Material Market and publishes its comprehensive annual report, highlighting emerging trends, growth drivers, revenue analysis, and forecast outlook. Our insights help businesses to make data-backed strategic decisions with ongoing market dynamics. Our analysts track relevent industries related to the Kenya Refractory Material Market, allowing our clients with actionable intelligence and reliable forecasts tailored to emerging regional needs.
Yes, we provide customisation as per your requirements. To learn more, feel free to contact us on sales@6wresearch.com
1 Executive Summary |
2 Introduction |
2.1 Key Highlights of the Report |
2.2 Report Description |
2.3 Market Scope & Segmentation |
2.4 Research Methodology |
2.5 Assumptions |
3 Kenya Refractory Material Market Overview |
3.1 Kenya Country Macro Economic Indicators |
3.2 Kenya Refractory Material Market Revenues & Volume, 2022 & 2032F |
3.3 Kenya Refractory Material Market - Industry Life Cycle |
3.4 Kenya Refractory Material Market - Porter's Five Forces |
3.5 Kenya Refractory Material Market Revenues & Volume Share, By Form, 2022 & 2032F |
3.6 Kenya Refractory Material Market Revenues & Volume Share, By Chemical Composition, 2022 & 2032F |
3.7 Kenya Refractory Material Market Revenues & Volume Share, By Chemistry, 2022 & 2032F |
3.8 Kenya Refractory Material Market Revenues & Volume Share, By End-use, 2022 & 2032F |
4 Kenya Refractory Material Market Dynamics |
4.1 Impact Analysis |
4.2 Market Drivers |
4.2.1 Growing demand for refractory materials in industries such as steel, cement, and glass due to infrastructure development projects in Kenya. |
4.2.2 Increasing investments in industrial sectors leading to higher demand for refractory materials. |
4.2.3 Technological advancements in manufacturing processes leading to the development of high-performance refractory materials. |
4.3 Market Restraints |
4.3.1 Fluctuating raw material prices impacting the cost of production of refractory materials. |
4.3.2 Competition from alternative materials such as ceramics and composites affecting the market for refractory materials. |
4.3.3 Regulatory challenges and environmental concerns related to the manufacturing and disposal of refractory materials. |
5 Kenya Refractory Material Market Trends |
6 Kenya Refractory Material Market, By Types |
6.1 Kenya Refractory Material Market, By Form |
6.1.1 Overview and Analysis |
6.1.2 Kenya Refractory Material Market Revenues & Volume, By Form, 2022-2032F |
6.1.3 Kenya Refractory Material Market Revenues & Volume, By Shaped, 2022-2032F |
6.1.4 Kenya Refractory Material Market Revenues & Volume, By Unshaped, 2022-2032F |
6.2 Kenya Refractory Material Market, By Chemical Composition |
6.2.1 Overview and Analysis |
6.2.2 Kenya Refractory Material Market Revenues & Volume, By Alumina, 2022-2032F |
6.2.3 Kenya Refractory Material Market Revenues & Volume, By Silica, 2022-2032F |
6.2.4 Kenya Refractory Material Market Revenues & Volume, By Magnesia, 2022-2032F |
6.2.5 Kenya Refractory Material Market Revenues & Volume, By Fireclay, 2022-2032F |
6.2.6 Kenya Refractory Material Market Revenues & Volume, By Others, 2022-2032F |
6.3 Kenya Refractory Material Market, By Chemistry |
6.3.1 Overview and Analysis |
6.3.2 Kenya Refractory Material Market Revenues & Volume, By Acidic, 2022-2032F |
6.3.3 Kenya Refractory Material Market Revenues & Volume, By Basic, 2022-2032F |
6.3.4 Kenya Refractory Material Market Revenues & Volume, By Neutral, 2022-2032F |
6.4 Kenya Refractory Material Market, By End-use |
6.4.1 Overview and Analysis |
6.4.2 Kenya Refractory Material Market Revenues & Volume, By Metals & Metallurgy, 2022-2032F |
6.4.3 Kenya Refractory Material Market Revenues & Volume, By Cement, 2022-2032F |
6.4.4 Kenya Refractory Material Market Revenues & Volume, By Glass & Ceramics, 2022-2032F |
6.4.5 Kenya Refractory Material Market Revenues & Volume, By Power Generation, 2022-2032F |
6.4.6 Kenya Refractory Material Market Revenues & Volume, By Others, 2022-2032F |
7 Kenya Refractory Material Market Import-Export Trade Statistics |
7.1 Kenya Refractory Material Market Export to Major Countries |
7.2 Kenya Refractory Material Market Imports from Major Countries |
8 Kenya Refractory Material Market Key Performance Indicators |
8.1 Percentage increase in demand from key industries using refractory materials in Kenya. |
8.2 Adoption rate of advanced refractory materials in industrial applications. |
8.3 Number of research and development initiatives focused on improving the performance and sustainability of refractory materials in Kenya. |
9 Kenya Refractory Material Market - Opportunity Assessment |
9.1 Kenya Refractory Material Market Opportunity Assessment, By Form, 2022 & 2032F |
9.2 Kenya Refractory Material Market Opportunity Assessment, By Chemical Composition, 2022 & 2032F |
9.3 Kenya Refractory Material Market Opportunity Assessment, By Chemistry, 2022 & 2032F |
9.4 Kenya Refractory Material Market Opportunity Assessment, By End-use, 2022 & 2032F |
10 Kenya Refractory Material Market - Competitive Landscape |
10.1 Kenya Refractory Material Market Revenue Share, By Companies, 2025 |
10.2 Kenya Refractory Material Market Competitive Benchmarking, By Operating and Technical Parameters |
11 Company Profiles |
12 Recommendations |
13 Disclaimer |
Global Go To Market Strategy - 2030
Export potential enables firms to identify high-growth global markets with greater confidence by combining advanced trade intelligence with a structured quantitative methodology. The framework analyzes emerging demand trends and country-level import patterns while integrating macroeconomic and trade datasets such as GDP and population forecasts, bilateral import–export flows, tariff structures, elasticity differentials between developed and developing economies, geographic distance, and import demand projections. Using weighted trade values from 2020–2024 as the base period to project country-to-country export potential for 2030, these inputs are operationalized through calculated drivers such as gravity model parameters, tariff impact factors, and projected GDP per-capita growth. Through an analysis of hidden potentials, demand hotspots, and market conditions that are most favorable to success, this method enables firms to focus on target countries, maximize returns, and global expansion with data, backed by accuracy.
By factoring in the projected importer demand gap that is currently unmet and could be potential opportunity, it identifies the potential for the Exporter (Country) among 190 countries, against the general trade analysis, which identifies the biggest importer or exporter.
To discover high-growth global markets and optimize your business strategy:
Click Here
Pricing
- Single User License$ 1,995
- Department License$ 2,400
- Site License$ 3,120
- Global License$ 3,795

Leadership Perspectives from Industry Events
Search
Thought Leadership and Analyst Meet


Our Clients
6WResearch In News
- India Air Conditioner Market Set for Strong Rebound in 2026 After Weather-Led Correction and GST-Driven Recovery: 6Wresearch
- ADAS in India: How Automatic Emergency Braking, Blind Spot Detection & Driver Monitoring are Transforming Road Safety
- Doha a strategic location for EV manufacturing hub: IPA Qatar
- Demand for luxury TVs surging in the GCC, says Samsung
- Empowering Growth: The Thriving Journey of Bangladesh’s Cable Industry
- Demand for luxury TVs surging in the GCC, says Samsung
Latest Reports
- Poland Fire Protection Systems Market (2026-2032)
- Cape Verde Portable Hand-Thrown Extinguisher Market (2026-2032)
- Canada Portable Hand-Thrown Extinguisher Market (2026-2032)
- Cameroon Portable Hand-Thrown Extinguisher Market (2026-2032)
- Burundi Portable Hand-Thrown Extinguisher Market (2026-2032)
- Burkina Faso Portable Hand-Thrown Extinguisher Market (2026-2032)
- Bulgaria Portable Hand-Thrown Extinguisher Market (2026-2032)
- Brunei Portable Hand-Thrown Extinguisher Market (2026-2032)
- Botswana Portable Hand-Thrown Extinguisher Market (2026-2032)
- Bosnia and Herzegovina Portable Hand-Thrown Extinguisher Market (2026-2032)
Industry Events and Analyst Meet

HIMTEX 2026

India Refining Summit 2026

India EV Show 2026

EV tech India Expo 2026

Auto Tech Asia 2026
Whitepaper
- Middle East & Africa Commercial Security Market Click here to view more.
- Middle East & Africa Fire Safety Systems & Equipment Market Click here to view more.
- GCC Drone Market Click here to view more.
- Middle East Lighting Fixture Market Click here to view more.
- GCC Physical & Perimeter Security Market Click here to view more.