Lebanon Electronics Packaging Market (2026-2032) | Forecast, Size, Revenue, Companies, Outlook, Share, Analysis, Value, COVID-19 IMPACT, Growth, Industry & Trends
Market Forecast By Material Types (Plastic, Metal, Glass, Others), By End-users (Consumer Electronics, Aerospace and Defense, Automotive, Healthcare, Others) And Competitive Landscape
| Product Code: ETC007447 | Publication Date: Jun 2023 | Product Type: Report | ||
| Publisher: 6Wresearch | Author: Ravi Bhandari | No. of Pages: 70 | No. of Figures: 35 | No. of Tables: 5 |
Lebanon Electronics Packaging Market Summary
The lebanon electronics packaging market was estimated at USD 222 Million in 2025 and is projected to reach USD 290 Million by 2032, growing at a CAGR of 4.3% from 2026 to 2032.
Lebanon Electronics Packaging Market Growth Rate Analysis (2021-2032)
The Lebanon Electronics Packaging Market has shown stable growth over the past few years, with growth rates of 4.5% in 2021 and 4.9% in 2022, reflecting a surge in consumer demand driven by the country's increasing reliance on technology and digital solutions. As the market transitions, investments in infrastructure and advancements in packaging technology have bolstered progress, resulting in further growth rates of 4.7% in 2024 and 4.8% by 2029. However, fluctuations exist, as seen in 2025's dip to 4.4%, primarily due to rising costs of materials and potential supply chain challenges. Nonetheless, a steady recovery is anticipated, with consistent growth projected at 4.4% to 4.8% in the following years, underscoring a resilient market.
Lebanon Electronics Packaging Market Year-wise Growth Rate and Key Drivers
This graph highlights how the Lebanon Electronics Packaging Market has steadily grown over the past five years, supported by major growth factors.
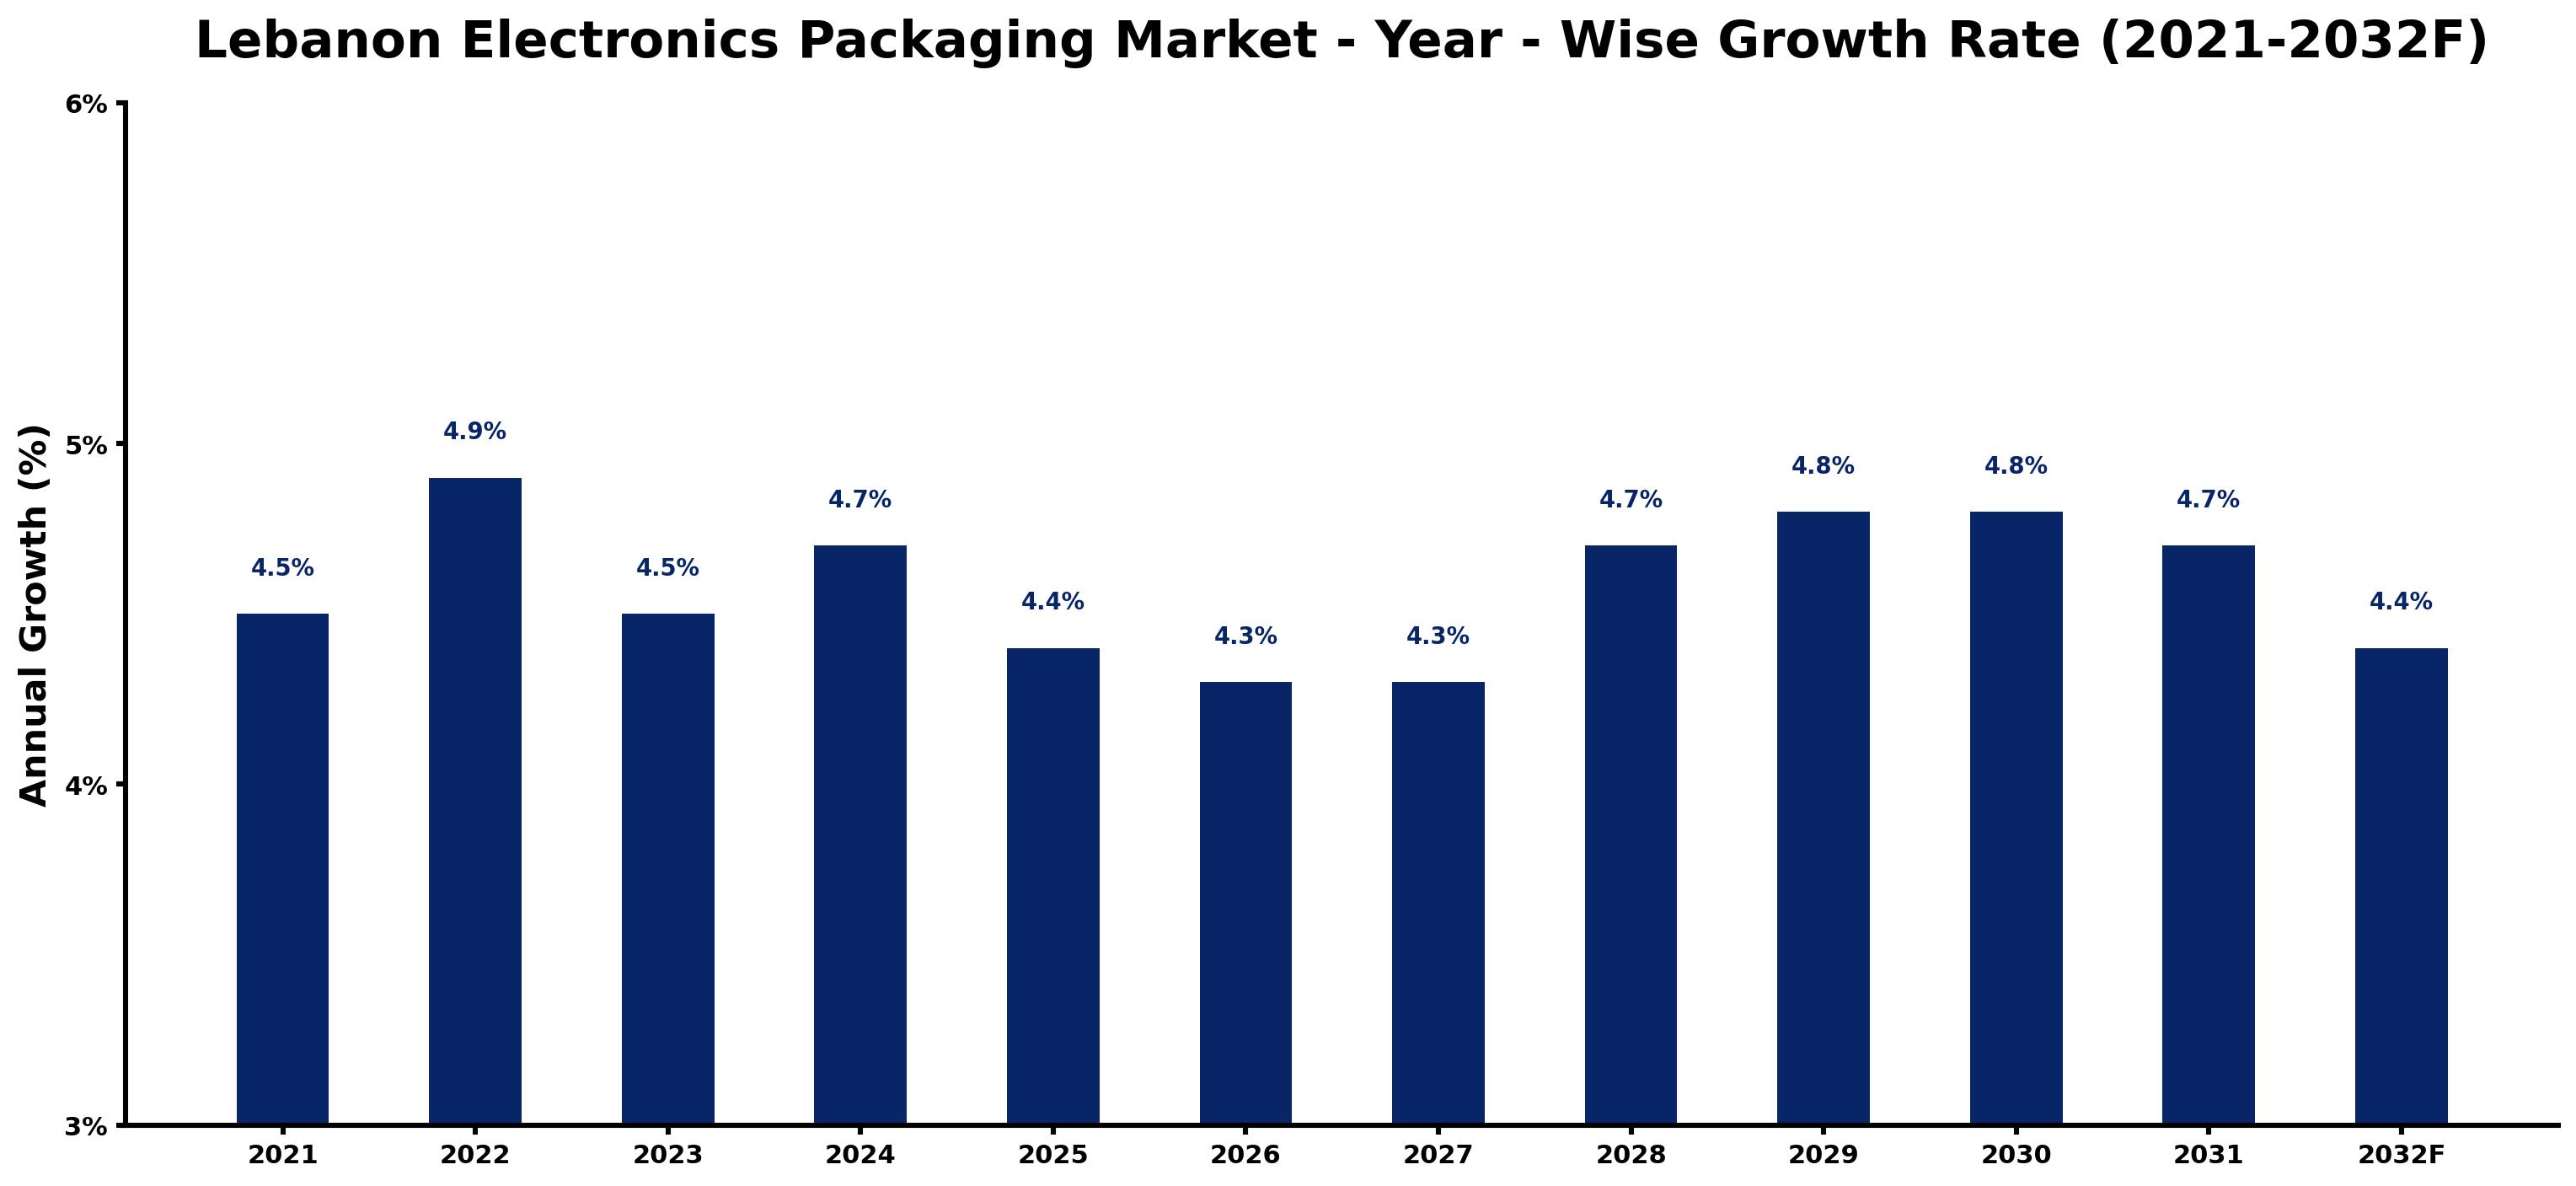
The table below presents the year wise growth rates along with the key drivers influencing the market
| Year | Growth Rate | Major Drivers |
| 2021 | 4.5% | Post-lockdown recovery spurred interest in consumer electronics and packaging solutions. |
| 2022 | 4.9% | Local manufacturers explored sustainable packaging options, engaging environmentally conscious consumers. |
| 2023 | 4.5% | E-commerce growth increased demand for reliable packaging solutions across various sectors. |
| 2024 | 4.7% | Innovative designs emerged as brands sought differentiation in a competitive marketplace. |
| 2025 | 4.4% | Investment in smart technologies reshaped packaging processes, enhancing operational efficiency. |
| 2026 | 4.3% | Global supply chain disruptions highlighted the need for localized packaging production. |
| 2027 | 4.3% | Sustainable material trends pressured manufacturers to adopt eco-friendly packaging alternatives. |
| 2028 | 4.7% | Consumer preferences shifted towards minimalistic designs, impacting packaging aesthetics significantly. |
| 2029 | 4.8% | Increased brand collaborations emphasized unique packaging as a marketing tool. |
| 2030 | 4.8% | Diverse consumer demographics encouraged personalization in electronics packaging strategies. |
| 2031 | 4.7% | Technological integration within packaging processes streamlined logistics and reduced waste. |
| 2032 | 4.4% | Market maturity prompted consolidation among packaging firms, enhancing competitive positioning. |
Note - Market size estimations and growth projections presented in this report are based on 6Wresearch's advanced forecasting approach, validated with industry datasets as of June 2026.
Lebanon Electronics Packaging Market Synopsis
The Lebanon Electronics Packaging Market is projected to reach 4.3% and witness significant growth during the forecast period (2026-2032). The market was valued at US$ 842.7 million in 2020 and is anticipated to rise to US$ 1,094.2 million by 2026, reflecting a compound annual growth rate (CAGR) of 4.5%. This growth trajectory is primarily driven by the increasing demand for electronic products, including mobile phones, personal computers, laptops, tablets, and other consumer electronics, attributed to rising disposable income levels and enhanced purchasing power among Lebanese consumers.
Lebanon Electronics Packaging Market Growth Drivers
In the Lebanon Electronics Packaging Market, several key drivers contribute to the ongoing expansion and evolution of the sector. The following elements play a pivotal role in shaping market dynamics:
- Increased consumer demand for electronic devices related to improved lifestyles and heightened connectivity needs among the population, which encourages higher production rates.
- Foreign investment influx into the Lebanese technology sector, which is driving innovation and enhancing the competitiveness of local manufacturers in the electronics packaging arena.
- The surge in global and domestic manufacturing of electronic products, necessitating advanced and diverse packaging solutions to ensure product safety and integrity during transit.
- Growth in e-commerce and online retail, which has escalated the demand for effective packaging solutions that cater specifically to the logistics of delivering fragile electronic goods.
- Innovations in packaging materials, where companies are increasingly utilizing advanced features like biodegradable options, enhancing sustainability efforts while responding to consumer preferences.
Lebanon Electronics Packaging Market Trends and Opportunities
The Lebanon Electronics Packaging Market is witnessing emerging trends that present substantial opportunities for stakeholders within the sector. Key trends include:
- The rising preference for eco-friendly packaging solutions as consumer awareness regarding environmental impact grows, prompting manufacturers to shift towards sustainable materials.
- Technological advancements in packaging design and functionality that improve usability and product protection, leading to better customer satisfaction and loyalty.
- Utilization of smart packaging technologies to provide consumers with enhanced user experiences, including features such as RFID tags for inventory tracking and product authenticity verification.
- A shift towards customizable packaging solutions that accommodate the unique requirements of various electronic devices and consumer segments, thereby fostering brand differentiation.
- Collaboration among local manufacturers and international partners to leverage expertise in packaging technology, opening up avenues for knowledge transfer and innovation.
Lebanon Electronics Packaging Market Challenges and Restraints
Despite the growth potential, the Lebanon Electronics Packaging Market faces several challenges that may hinder progress. These include:
- Political instability in Lebanon, which may deter foreign investment and disrupt supply chains vital for packaging materials and production processes.
- Fluctuations in raw material prices, particularly in plastics and paper products, which can affect production costs and overall market profitability.
- Regulatory hurdles regarding packaging waste management and environmental sustainability, which may impose additional burdens on manufacturers.
- Competition from cheaper imports in the packaging sector, which may threaten the market share of domestic producers who cannot match pricing strategies.
- Challenges in upgrading existing infrastructure to accommodate more advanced packaging technologies, which can impede the growth of local enterprises seeking modernization.
Lebanon Electronics Packaging Market Government Investment and Initiatives
The Lebanese government has recognized the significance of the electronics sector and its associated packaging services as vital components of the national economy. As such, various initiatives aimed at fostering growth in the Lebanon Electronics Packaging Market include:
- Investment in technology parks and innovation hubs to stimulate research and development in packaging technologies, thereby encouraging local players to innovate.
- Development of strategic partnerships with international bodies to enhance the technical capabilities of domestic manufacturers and improve market competitiveness.
- Incentives for businesses that adopt sustainable practices in packaging, including tax breaks for companies that implement eco-friendly materials.
- Support for training programs aimed at upskilling the workforce in modern packaging techniques and materials, ensuring a skilled labor pool for future market demands.
- Allocation of funds for infrastructure improvements that facilitate better logistics and distribution channels essential for the packaging sector.
Lebanon Electronics Packaging Market Latest Developments (May 2025 - June 2026)
Recent developments in the Lebanon Electronics Packaging Market from May 2025 to June 2026 indicate a landscape of rapid changes and adaptations. Notable shifts include:
- The introduction of new regulatory measures focusing on the minimization of packaging waste, compelling manufacturers to adopt more sustainable practices.
- Increased collaboration between technology firms and packaging providers to innovate high-performance materials that enhance product protection without compromising on environmental standards.
- Growth in consumer electronics sales driven by remote working trends, leading to heightened demand for packaging solutions that cater specifically to fragile tech products.
- Expansion of distribution networks within the e-commerce sector, necessitating the introduction of more resilient and functional packaging designs to ensure product safety during transit.
- Active participation of local businesses in international trade shows, showcasing advances in packaging technology and fostering networking opportunities that could lead to lucrative partnerships.
Lebanon Electronics Packaging Market - Key Attractiveness of the Report
- 10 Years of Market Numbers
- Historical Data Starting from 2022 to 2025
- Base Year: 2025
- Forecast Data until 2032
- Key Performance Indicators Impacting the Market
- Major Upcoming Developments and Projects
Key Highlights of the Report:
- Lebanon Electronics Packaging Market Outlook
- Market Size of Lebanon Electronics Packaging Market, 2025
- Forecast of Lebanon Electronics Packaging Market, 2032F
- Historical Data and Forecast of Lebanon Electronics Packaging Revenues & Volume for the Period 2022-2032F
- Lebanon Electronics Packaging Market Trend Evolution
- Lebanon Electronics Packaging Market Drivers and Challenges
- Lebanon Electronics Packaging Price Trends
- Lebanon Electronics Packaging Porter's Five Forces
- Lebanon Electronics Packaging Industry Life Cycle
- Historical Data and Forecast of Lebanon Electronics Packaging Market Revenues & Volume By Material Types for the Period 2022-2032F
- Historical Data and Forecast of Lebanon Electronics Packaging Market Revenues & Volume By Plastic for the Period 2022-2032F
- Historical Data and Forecast of Lebanon Electronics Packaging Market Revenues & Volume By Metal for the Period 2022-2032F
- Historical Data and Forecast of Lebanon Electronics Packaging Market Revenues & Volume By Glass for the Period 2022-2032F
- Historical Data and Forecast of Lebanon Electronics Packaging Market Revenues & Volume By Others for the Period 2022-2032F
- Historical Data and Forecast of Lebanon Electronics Packaging Market Revenues & Volume By End-users for the Period 2022-2032F
- Historical Data and Forecast of Lebanon Electronics Packaging Market Revenues & Volume By Consumer Electronics for the Period 2022-2032F
- Historical Data and Forecast of Lebanon Electronics Packaging Market Revenues & Volume By Aerospace and Defense for the Period 2022-2032F
- Historical Data and Forecast of Lebanon Electronics Packaging Market Revenues & Volume By Automotive for the Period 2022-2032F
- Historical Data and Forecast of Lebanon Electronics Packaging Market Revenues & Volume By Healthcare for the Period 2022-2032F
- Historical Data and Forecast of Lebanon Electronics Packaging Market Revenues & Volume By Others for the Period 2022-2032F
- Lebanon Electronics Packaging Import Export Trade Statistics
- Market Opportunity Assessment By Material Types
- Market Opportunity Assessment By End-users
- Lebanon Electronics Packaging Top Companies Market Share
- Lebanon Electronics Packaging Competitive Benchmarking By Technical and Operational Parameters
- Lebanon Electronics Packaging Company Profiles
- Lebanon Electronics Packaging Key Strategic Recommendations
Frequently Asked Questions About the Market Study (FAQs):
The growth of the Lebanon Electronics Packaging Market is driven by increased disposable income, rising demand for electronic products, and foreign investments in the technology sector.
Key challenges include political instability, fluctuating raw material prices, and competition from cheaper imports, which may impact local manufacturers.
The government is investing in innovation hubs, providing incentives for sustainable practices, and enhancing infrastructure to support growth in the electronics packaging sector.
Trends include the shift towards eco-friendly packaging solutions, the adoption of smart packaging technologies, and increased demand for customizable packaging options.
6Wresearch actively monitors the Lebanon Electronics Packaging Market and publishes its comprehensive annual report, highlighting emerging trends, growth drivers, revenue analysis, and forecast outlook. Our insights help businesses to make data-backed strategic decisions with ongoing market dynamics. Our analysts track relevent industries related to the Lebanon Electronics Packaging Market, allowing our clients with actionable intelligence and reliable forecasts tailored to emerging regional needs.
Yes, we provide customisation as per your requirements. To learn more, feel free to contact us on sales@6wresearch.com
1 Executive Summary |
2 Introduction |
2.1 Key Highlights of the Report |
2.2 Report Description |
2.3 Market Scope & Segmentation |
2.4 Research Methodology |
2.5 Assumptions |
3 Lebanon Electronics Packaging Market Overview |
3.1 Lebanon Country Macro Economic Indicators |
3.2 Lebanon Electronics Packaging Market Revenues & Volume, 2022 & 2032F |
3.3 Lebanon Electronics Packaging Market - Industry Life Cycle |
3.4 Lebanon Electronics Packaging Market - Porter's Five Forces |
3.5 Lebanon Electronics Packaging Market Revenues & Volume Share, By Material Types, 2022 & 2032F |
3.6 Lebanon Electronics Packaging Market Revenues & Volume Share, By End-users, 2022 & 2032F |
4 Lebanon Electronics Packaging Market Dynamics |
4.1 Impact Analysis |
4.2 Market Drivers |
4.3 Market Restraints |
5 Lebanon Electronics Packaging Market Trends |
6 Lebanon Electronics Packaging Market, By Types |
6.1 Lebanon Electronics Packaging Market, By Material Types |
6.1.1 Overview and Analysis |
6.1.2 Lebanon Electronics Packaging Market Revenues & Volume, By Material Types, 2022-2032F |
6.1.3 Lebanon Electronics Packaging Market Revenues & Volume, By Plastic, 2022-2032F |
6.1.4 Lebanon Electronics Packaging Market Revenues & Volume, By Metal, 2022-2032F |
6.1.5 Lebanon Electronics Packaging Market Revenues & Volume, By Glass, 2022-2032F |
6.1.6 Lebanon Electronics Packaging Market Revenues & Volume, By Others, 2022-2032F |
6.2 Lebanon Electronics Packaging Market, By End-users |
6.2.1 Overview and Analysis |
6.2.2 Lebanon Electronics Packaging Market Revenues & Volume, By Consumer Electronics, 2022-2032F |
6.2.3 Lebanon Electronics Packaging Market Revenues & Volume, By Aerospace and Defense, 2022-2032F |
6.2.4 Lebanon Electronics Packaging Market Revenues & Volume, By Automotive, 2022-2032F |
6.2.5 Lebanon Electronics Packaging Market Revenues & Volume, By Healthcare, 2022-2032F |
6.2.6 Lebanon Electronics Packaging Market Revenues & Volume, By Others, 2022-2032F |
7 Lebanon Electronics Packaging Market Import-Export Trade Statistics |
7.1 Lebanon Electronics Packaging Market Export to Major Countries |
7.2 Lebanon Electronics Packaging Market Imports from Major Countries |
8 Lebanon Electronics Packaging Market Key Performance Indicators |
9 Lebanon Electronics Packaging Market - Opportunity Assessment |
9.1 Lebanon Electronics Packaging Market Opportunity Assessment, By Material Types, 2022 & 2032F |
9.2 Lebanon Electronics Packaging Market Opportunity Assessment, By End-users, 2022 & 2032F |
10 Lebanon Electronics Packaging Market - Competitive Landscape |
10.1 Lebanon Electronics Packaging Market Revenue Share, By Companies, 2025 |
10.2 Lebanon Electronics Packaging Market Competitive Benchmarking, By Operating and Technical Parameters |
11 Company Profiles |
12 Recommendations |
13 Disclaimer |
Global Go To Market Strategy - 2030
Export potential enables firms to identify high-growth global markets with greater confidence by combining advanced trade intelligence with a structured quantitative methodology. The framework analyzes emerging demand trends and country-level import patterns while integrating macroeconomic and trade datasets such as GDP and population forecasts, bilateral import–export flows, tariff structures, elasticity differentials between developed and developing economies, geographic distance, and import demand projections. Using weighted trade values from 2020–2024 as the base period to project country-to-country export potential for 2030, these inputs are operationalized through calculated drivers such as gravity model parameters, tariff impact factors, and projected GDP per-capita growth. Through an analysis of hidden potentials, demand hotspots, and market conditions that are most favorable to success, this method enables firms to focus on target countries, maximize returns, and global expansion with data, backed by accuracy.
By factoring in the projected importer demand gap that is currently unmet and could be potential opportunity, it identifies the potential for the Exporter (Country) among 190 countries, against the general trade analysis, which identifies the biggest importer or exporter.
To discover high-growth global markets and optimize your business strategy:
Click Here
Pricing
- Single User License$ 1,995
- Department License$ 2,400
- Site License$ 3,120
- Global License$ 3,795

Leadership Perspectives from Industry Events
Search
Thought Leadership and Analyst Meet


Our Clients
6WResearch In News
- India Air Conditioner Market Set for Strong Rebound in 2026 After Weather-Led Correction and GST-Driven Recovery: 6Wresearch
- ADAS in India: How Automatic Emergency Braking, Blind Spot Detection & Driver Monitoring are Transforming Road Safety
- Doha a strategic location for EV manufacturing hub: IPA Qatar
- Demand for luxury TVs surging in the GCC, says Samsung
- Empowering Growth: The Thriving Journey of Bangladesh’s Cable Industry
- Demand for luxury TVs surging in the GCC, says Samsung
Latest Reports
- Poland Fire Protection Systems Market (2026-2032)
- Cape Verde Portable Hand-Thrown Extinguisher Market (2026-2032)
- Canada Portable Hand-Thrown Extinguisher Market (2026-2032)
- Cameroon Portable Hand-Thrown Extinguisher Market (2026-2032)
- Burundi Portable Hand-Thrown Extinguisher Market (2026-2032)
- Burkina Faso Portable Hand-Thrown Extinguisher Market (2026-2032)
- Bulgaria Portable Hand-Thrown Extinguisher Market (2026-2032)
- Brunei Portable Hand-Thrown Extinguisher Market (2026-2032)
- Botswana Portable Hand-Thrown Extinguisher Market (2026-2032)
- Bosnia and Herzegovina Portable Hand-Thrown Extinguisher Market (2026-2032)
Industry Events and Analyst Meet

HIMTEX 2026

India Refining Summit 2026

India EV Show 2026

EV tech India Expo 2026

Auto Tech Asia 2026
Whitepaper
- Middle East & Africa Commercial Security Market Click here to view more.
- Middle East & Africa Fire Safety Systems & Equipment Market Click here to view more.
- GCC Drone Market Click here to view more.
- Middle East Lighting Fixture Market Click here to view more.
- GCC Physical & Perimeter Security Market Click here to view more.