Lebanon Wallet Market (2026-2032) | Companies, Outlook, Trends, Industry, Value, Forecast, Share, Analysis, Size, Growth & Revenue
Market Forecast By Product Type (Short Wallet, Long Wallet), By Material (Leather, Fabric), By Gender (Men, Women, Kids), By Distribution Channel (Online, Offline) And Competitive Landscape
| Product Code: ETC011647 | Publication Date: Oct 2020 | Updated Date: Jun 2026 | Product Type: Report | |
| Publisher: 6Wresearch | Author: Ravi Bhandari | No. of Pages: 70 | No. of Figures: 35 | No. of Tables: 5 |
Lebanon Wallet Market Summary
The lebanon wallet market was estimated at USD 965 Million in 2025 and is projected to reach USD 1389 Million by 2032, growing at a CAGR of 6.1% from 2026 to 2032.
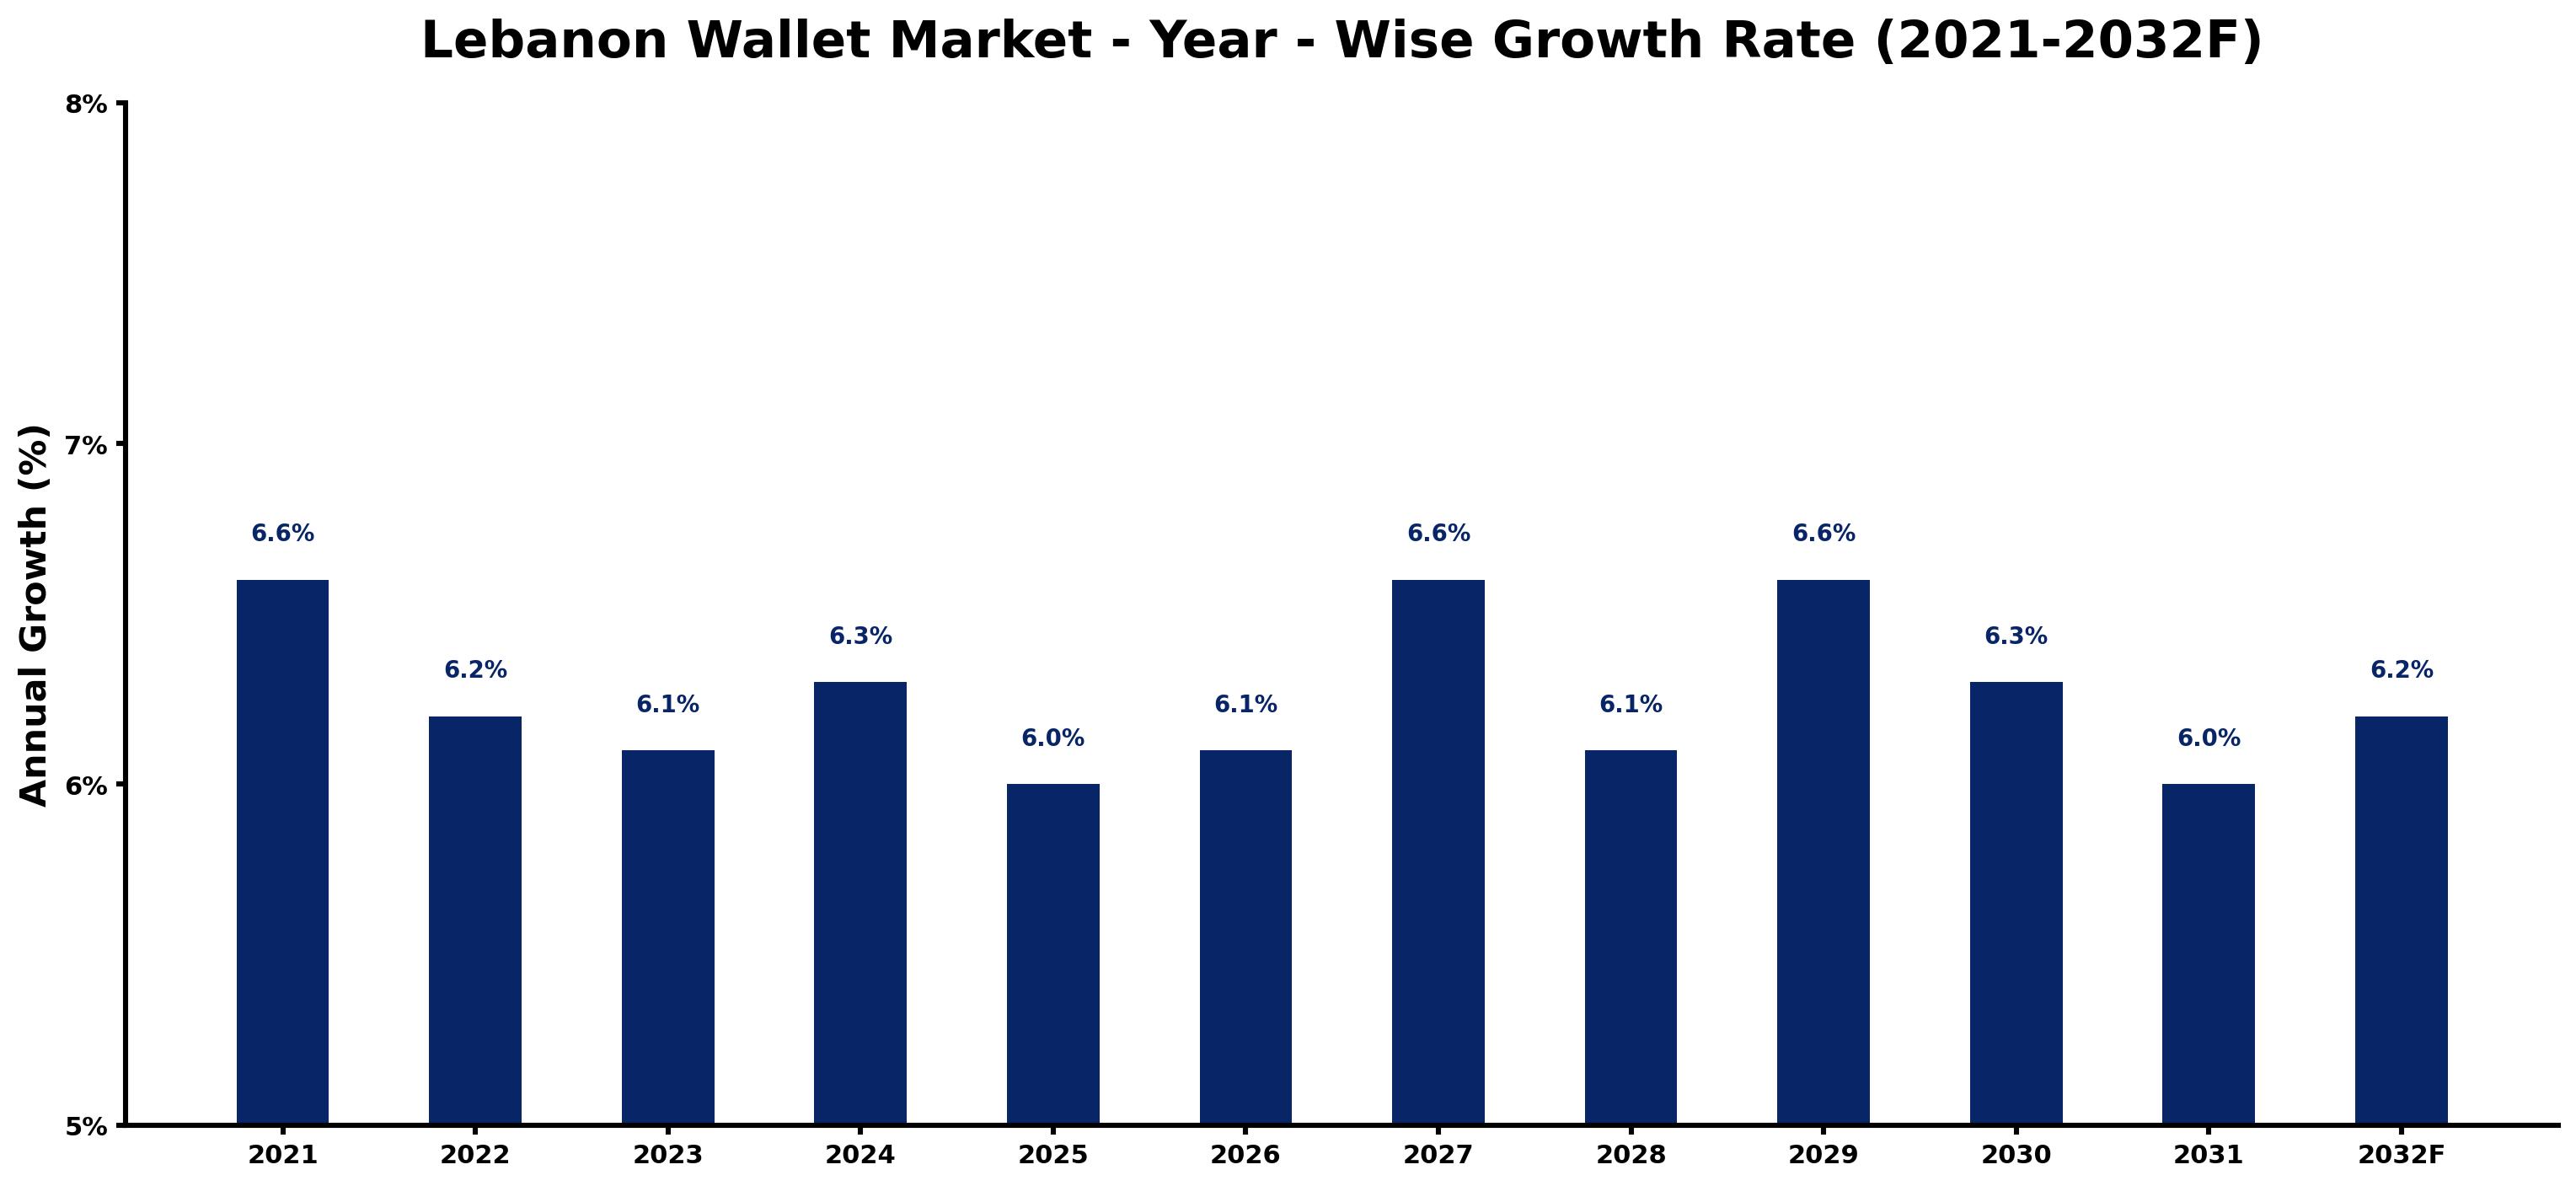
Lebanon Wallet Market Growth Rate Analysis (2021-2032)
The Lebanon Wallet market has shown stable growth, achieving a 6.6% increase in 2021, followed by a slight decline to 6.2% in 2022, and further to 6.1% in 2023. This fluctuation can be attributed to both external economic challenges and shifting consumer preferences. However, a resurgence is anticipated, with projections suggesting a rebound to 6.3% growth in 2024, driven by increased digitalization and enhancements in payment infrastructure. The market continues to benefit from rising consumer demand for convenient transaction solutions, which is expected to sustain growth through 2029, with growth rates stabilizing around 6.1% to 6.6% in successive years.
Lebanon Wallet Market Year-wise Growth Rate and Key Drivers
This graph highlights how the Lebanon Wallet Market has steadily grown over the past five years, supported by major growth factors.
The table below presents the year wise growth rates along with the key drivers influencing the market
| Year | Growth Rate | Major Drivers |
| 2021 | 6.6% | The pandemic prompted rapid digital wallet adoption among Lebanese consumers seeking convenience. |
| 2022 | 6.2% | Local businesses began integrating wallet solutions for smoother transaction experiences and loyalty. |
| 2023 | 6.1% | Increasing smartphone penetration accelerated the shift towards mobile payment systems and wallets. |
| 2024 | 6.3% | E-commerce growth spurred a demand for secure payment solutions and digital wallets. |
| 2025 | 6.0% | Consumer preferences shifted towards cashless transactions, enhancing wallet market opportunities significantly. |
| 2026 | 6.1% | Partnerships between banks and fintech startups diversified wallet functionalities and user engagement. |
| 2027 | 6.6% | International remittances became easier, with wallets offering competitive rates and faster transfers. |
| 2028 | 6.1% | Cryptocurrency integration in wallets attracted a tech-savvy audience seeking modern financial solutions. |
| 2029 | 6.6% | Loyalty programs linked to digital wallets enhanced customer retention and spending patterns. |
| 2030 | 6.3% | Sustainability trends encouraged wallets to adopt eco-friendly practices and digital statements. |
| 2031 | 6.0% | Data privacy concerns led to innovative security solutions, increasing consumer trust in wallets. |
| 2032 | 6.2% | Continuous technological advancements ensured wallets remained relevant, adapting to user needs effortlessly. |
Note - Market size estimations and growth projections presented in this report are based on 6Wresearch's advanced forecasting approach, validated with industry datasets as of June 2026.
Key Highlights of the Report:
- Lebanon Wallet Market Outlook
- Market Size of Lebanon Wallet Market, 2025
- Forecast of Lebanon Wallet Market, 2032F
- Historical Data and Forecast of Lebanon Wallet Revenues & Volume for the Period 2022-2032F
- Lebanon Wallet Market Trend Evolution
- Lebanon Wallet Market Drivers and Challenges
- Lebanon Wallet Price Trends
- Lebanon Wallet Porter's Five Forces
- Lebanon Wallet Industry Life Cycle
- Historical Data and Forecast of Lebanon Wallet Market Revenues & Volume By Product Type for the Period 2022-2032F
- Historical Data and Forecast of Lebanon Wallet Market Revenues & Volume By Short Wallet for the Period 2022-2032F
- Historical Data and Forecast of Lebanon Wallet Market Revenues & Volume By Long Wallet for the Period 2022-2032F
- Historical Data and Forecast of Lebanon Wallet Market Revenues & Volume By Material for the Period 2022-2032F
- Historical Data and Forecast of Lebanon Wallet Market Revenues & Volume By Leather for the Period 2022-2032F
- Historical Data and Forecast of Lebanon Wallet Market Revenues & Volume By Fabric for the Period 2022-2032F
- Historical Data and Forecast of Lebanon Wallet Market Revenues & Volume By Gender for the Period 2022-2032F
- Historical Data and Forecast of Lebanon Wallet Market Revenues & Volume By Men for the Period 2022-2032F
- Historical Data and Forecast of Lebanon Wallet Market Revenues & Volume By Women for the Period 2022-2032F
- Historical Data and Forecast of Lebanon Wallet Market Revenues & Volume By Kids for the Period 2022-2032F
- Historical Data and Forecast of Lebanon Wallet Market Revenues & Volume By Distribution Channel for the Period 2022-2032F
- Historical Data and Forecast of Lebanon Wallet Market Revenues & Volume By Online for the Period 2022-2032F
- Historical Data and Forecast of Lebanon Wallet Market Revenues & Volume By Offline for the Period 2022-2032F
- Lebanon Wallet Import Export Trade Statistics
- Market Opportunity Assessment By Product Type
- Market Opportunity Assessment By Material
- Market Opportunity Assessment By Gender
- Market Opportunity Assessment By Distribution Channel
- Lebanon Wallet Top Companies Market Share
- Lebanon Wallet Competitive Benchmarking By Technical and Operational Parameters
- Lebanon Wallet Company Profiles
- Lebanon Wallet Key Strategic Recommendations
Frequently Asked Questions About the Market Study (FAQs):
6Wresearch actively monitors the Lebanon Wallet Market and publishes its comprehensive annual report, highlighting emerging trends, growth drivers, revenue analysis, and forecast outlook. Our insights help businesses to make data-backed strategic decisions with ongoing market dynamics. Our analysts track relevent industries related to the Lebanon Wallet Market, allowing our clients with actionable intelligence and reliable forecasts tailored to emerging regional needs.
Yes, we provide customisation as per your requirements. To learn more, feel free to contact us on sales@6wresearch.com
1 Executive Summary |
2 Introduction |
2.1 Key Highlights of the Report |
2.2 Report Description |
2.3 Market Scope & Segmentation |
2.4 Research Methodology |
2.5 Assumptions |
3 Lebanon Wallet Market Overview |
3.1 Lebanon Country Macro Economic Indicators |
3.2 Lebanon Wallet Market Revenues & Volume, 2022 & 2032F |
3.3 Lebanon Wallet Market - Industry Life Cycle |
3.4 Lebanon Wallet Market - Porter's Five Forces |
3.5 Lebanon Wallet Market Revenues & Volume Share, By Product Type, 2022 & 2032F |
3.6 Lebanon Wallet Market Revenues & Volume Share, By Material, 2022 & 2032F |
3.7 Lebanon Wallet Market Revenues & Volume Share, By Gender, 2022 & 2032F |
3.8 Lebanon Wallet Market Revenues & Volume Share, By Distribution Channel, 2022 & 2032F |
4 Lebanon Wallet Market Dynamics |
4.1 Impact Analysis |
4.2 Market Drivers |
4.3 Market Restraints |
5 Lebanon Wallet Market Trends |
6 Lebanon Wallet Market, By Types |
6.1 Lebanon Wallet Market, By Product Type |
6.1.1 Overview and Analysis |
6.1.2 Lebanon Wallet Market Revenues & Volume, By Product Type, 2022 - 2032F |
6.1.3 Lebanon Wallet Market Revenues & Volume, By Short Wallet, 2022 - 2032F |
6.1.4 Lebanon Wallet Market Revenues & Volume, By Long Wallet, 2022 - 2032F |
6.2 Lebanon Wallet Market, By Material |
6.2.1 Overview and Analysis |
6.2.2 Lebanon Wallet Market Revenues & Volume, By Leather, 2022 - 2032F |
6.2.3 Lebanon Wallet Market Revenues & Volume, By Fabric, 2022 - 2032F |
6.3 Lebanon Wallet Market, By Gender |
6.3.1 Overview and Analysis |
6.3.2 Lebanon Wallet Market Revenues & Volume, By Men, 2022 - 2032F |
6.3.3 Lebanon Wallet Market Revenues & Volume, By Women, 2022 - 2032F |
6.3.4 Lebanon Wallet Market Revenues & Volume, By Kids, 2022 - 2032F |
6.4 Lebanon Wallet Market, By Distribution Channel |
6.4.1 Overview and Analysis |
6.4.2 Lebanon Wallet Market Revenues & Volume, By Online, 2022 - 2032F |
6.4.3 Lebanon Wallet Market Revenues & Volume, By Offline, 2022 - 2032F |
7 Lebanon Wallet Market Import-Export Trade Statistics |
7.1 Lebanon Wallet Market Export to Major Countries |
7.2 Lebanon Wallet Market Imports from Major Countries |
8 Lebanon Wallet Market Key Performance Indicators |
9 Lebanon Wallet Market - Opportunity Assessment |
9.1 Lebanon Wallet Market Opportunity Assessment, By Product Type, 2022 & 2032F |
9.2 Lebanon Wallet Market Opportunity Assessment, By Material, 2022 & 2032F |
9.3 Lebanon Wallet Market Opportunity Assessment, By Gender, 2022 & 2032F |
9.4 Lebanon Wallet Market Opportunity Assessment, By Distribution Channel, 2022 & 2032F |
10 Lebanon Wallet Market - Competitive Landscape |
10.1 Lebanon Wallet Market Revenue Share, By Companies, 2025 |
10.2 Lebanon Wallet Market Competitive Benchmarking, By Operating and Technical Parameters |
11 Company Profiles |
12 Recommendations |
13 Disclaimer |
Global Go To Market Strategy - 2030
Export potential enables firms to identify high-growth global markets with greater confidence by combining advanced trade intelligence with a structured quantitative methodology. The framework analyzes emerging demand trends and country-level import patterns while integrating macroeconomic and trade datasets such as GDP and population forecasts, bilateral import–export flows, tariff structures, elasticity differentials between developed and developing economies, geographic distance, and import demand projections. Using weighted trade values from 2020–2024 as the base period to project country-to-country export potential for 2030, these inputs are operationalized through calculated drivers such as gravity model parameters, tariff impact factors, and projected GDP per-capita growth. Through an analysis of hidden potentials, demand hotspots, and market conditions that are most favorable to success, this method enables firms to focus on target countries, maximize returns, and global expansion with data, backed by accuracy.
By factoring in the projected importer demand gap that is currently unmet and could be potential opportunity, it identifies the potential for the Exporter (Country) among 190 countries, against the general trade analysis, which identifies the biggest importer or exporter.
To discover high-growth global markets and optimize your business strategy:
Click Here
Pricing
- Single User License$ 1,995
- Department License$ 2,400
- Site License$ 3,120
- Global License$ 3,795

Leadership Perspectives from Industry Events
Search
Thought Leadership and Analyst Meet


Our Clients
6WResearch In News
- India Air Conditioner Market Set for Strong Rebound in 2026 After Weather-Led Correction and GST-Driven Recovery: 6Wresearch
- ADAS in India: How Automatic Emergency Braking, Blind Spot Detection & Driver Monitoring are Transforming Road Safety
- Doha a strategic location for EV manufacturing hub: IPA Qatar
- Demand for luxury TVs surging in the GCC, says Samsung
- Empowering Growth: The Thriving Journey of Bangladesh’s Cable Industry
- Demand for luxury TVs surging in the GCC, says Samsung
Latest Reports
- Poland Fire Protection Systems Market (2026-2032)
- Cape Verde Portable Hand-Thrown Extinguisher Market (2026-2032)
- Canada Portable Hand-Thrown Extinguisher Market (2026-2032)
- Cameroon Portable Hand-Thrown Extinguisher Market (2026-2032)
- Burundi Portable Hand-Thrown Extinguisher Market (2026-2032)
- Burkina Faso Portable Hand-Thrown Extinguisher Market (2026-2032)
- Bulgaria Portable Hand-Thrown Extinguisher Market (2026-2032)
- Brunei Portable Hand-Thrown Extinguisher Market (2026-2032)
- Botswana Portable Hand-Thrown Extinguisher Market (2026-2032)
- Bosnia and Herzegovina Portable Hand-Thrown Extinguisher Market (2026-2032)
Industry Events and Analyst Meet

HIMTEX 2026

India Refining Summit 2026

India EV Show 2026

EV tech India Expo 2026

Auto Tech Asia 2026
Whitepaper
- Middle East & Africa Commercial Security Market Click here to view more.
- Middle East & Africa Fire Safety Systems & Equipment Market Click here to view more.
- GCC Drone Market Click here to view more.
- Middle East Lighting Fixture Market Click here to view more.
- GCC Physical & Perimeter Security Market Click here to view more.