Lithuania Electric Fuse Market (2026-2032) | Share, Forecast, Trends, Value, Size, Segmentation, Companies, Growth, Revenue, Analysis, Outlook & Industry
Market Forecast By Type (Power fuse and fuse links, Distribution cutouts, Cartridge and plug fuses, Others), By Voltage (Low Voltage, Medium Voltage), By End-users (Residential, Commercial, Industrial, Utilities, Transportation) And Competitive Landscape
| Product Code: ETC4800162 | Publication Date: Nov 2023 | Updated Date: Apr 2026 | Product Type: Market Research Report | |
| Publisher: 6Wresearch | Author: Shubham Padhi | No. of Pages: 60 | No. of Figures: 30 | No. of Tables: 5 |
Lithuania Electric Fuse Market Size (2020-2030)
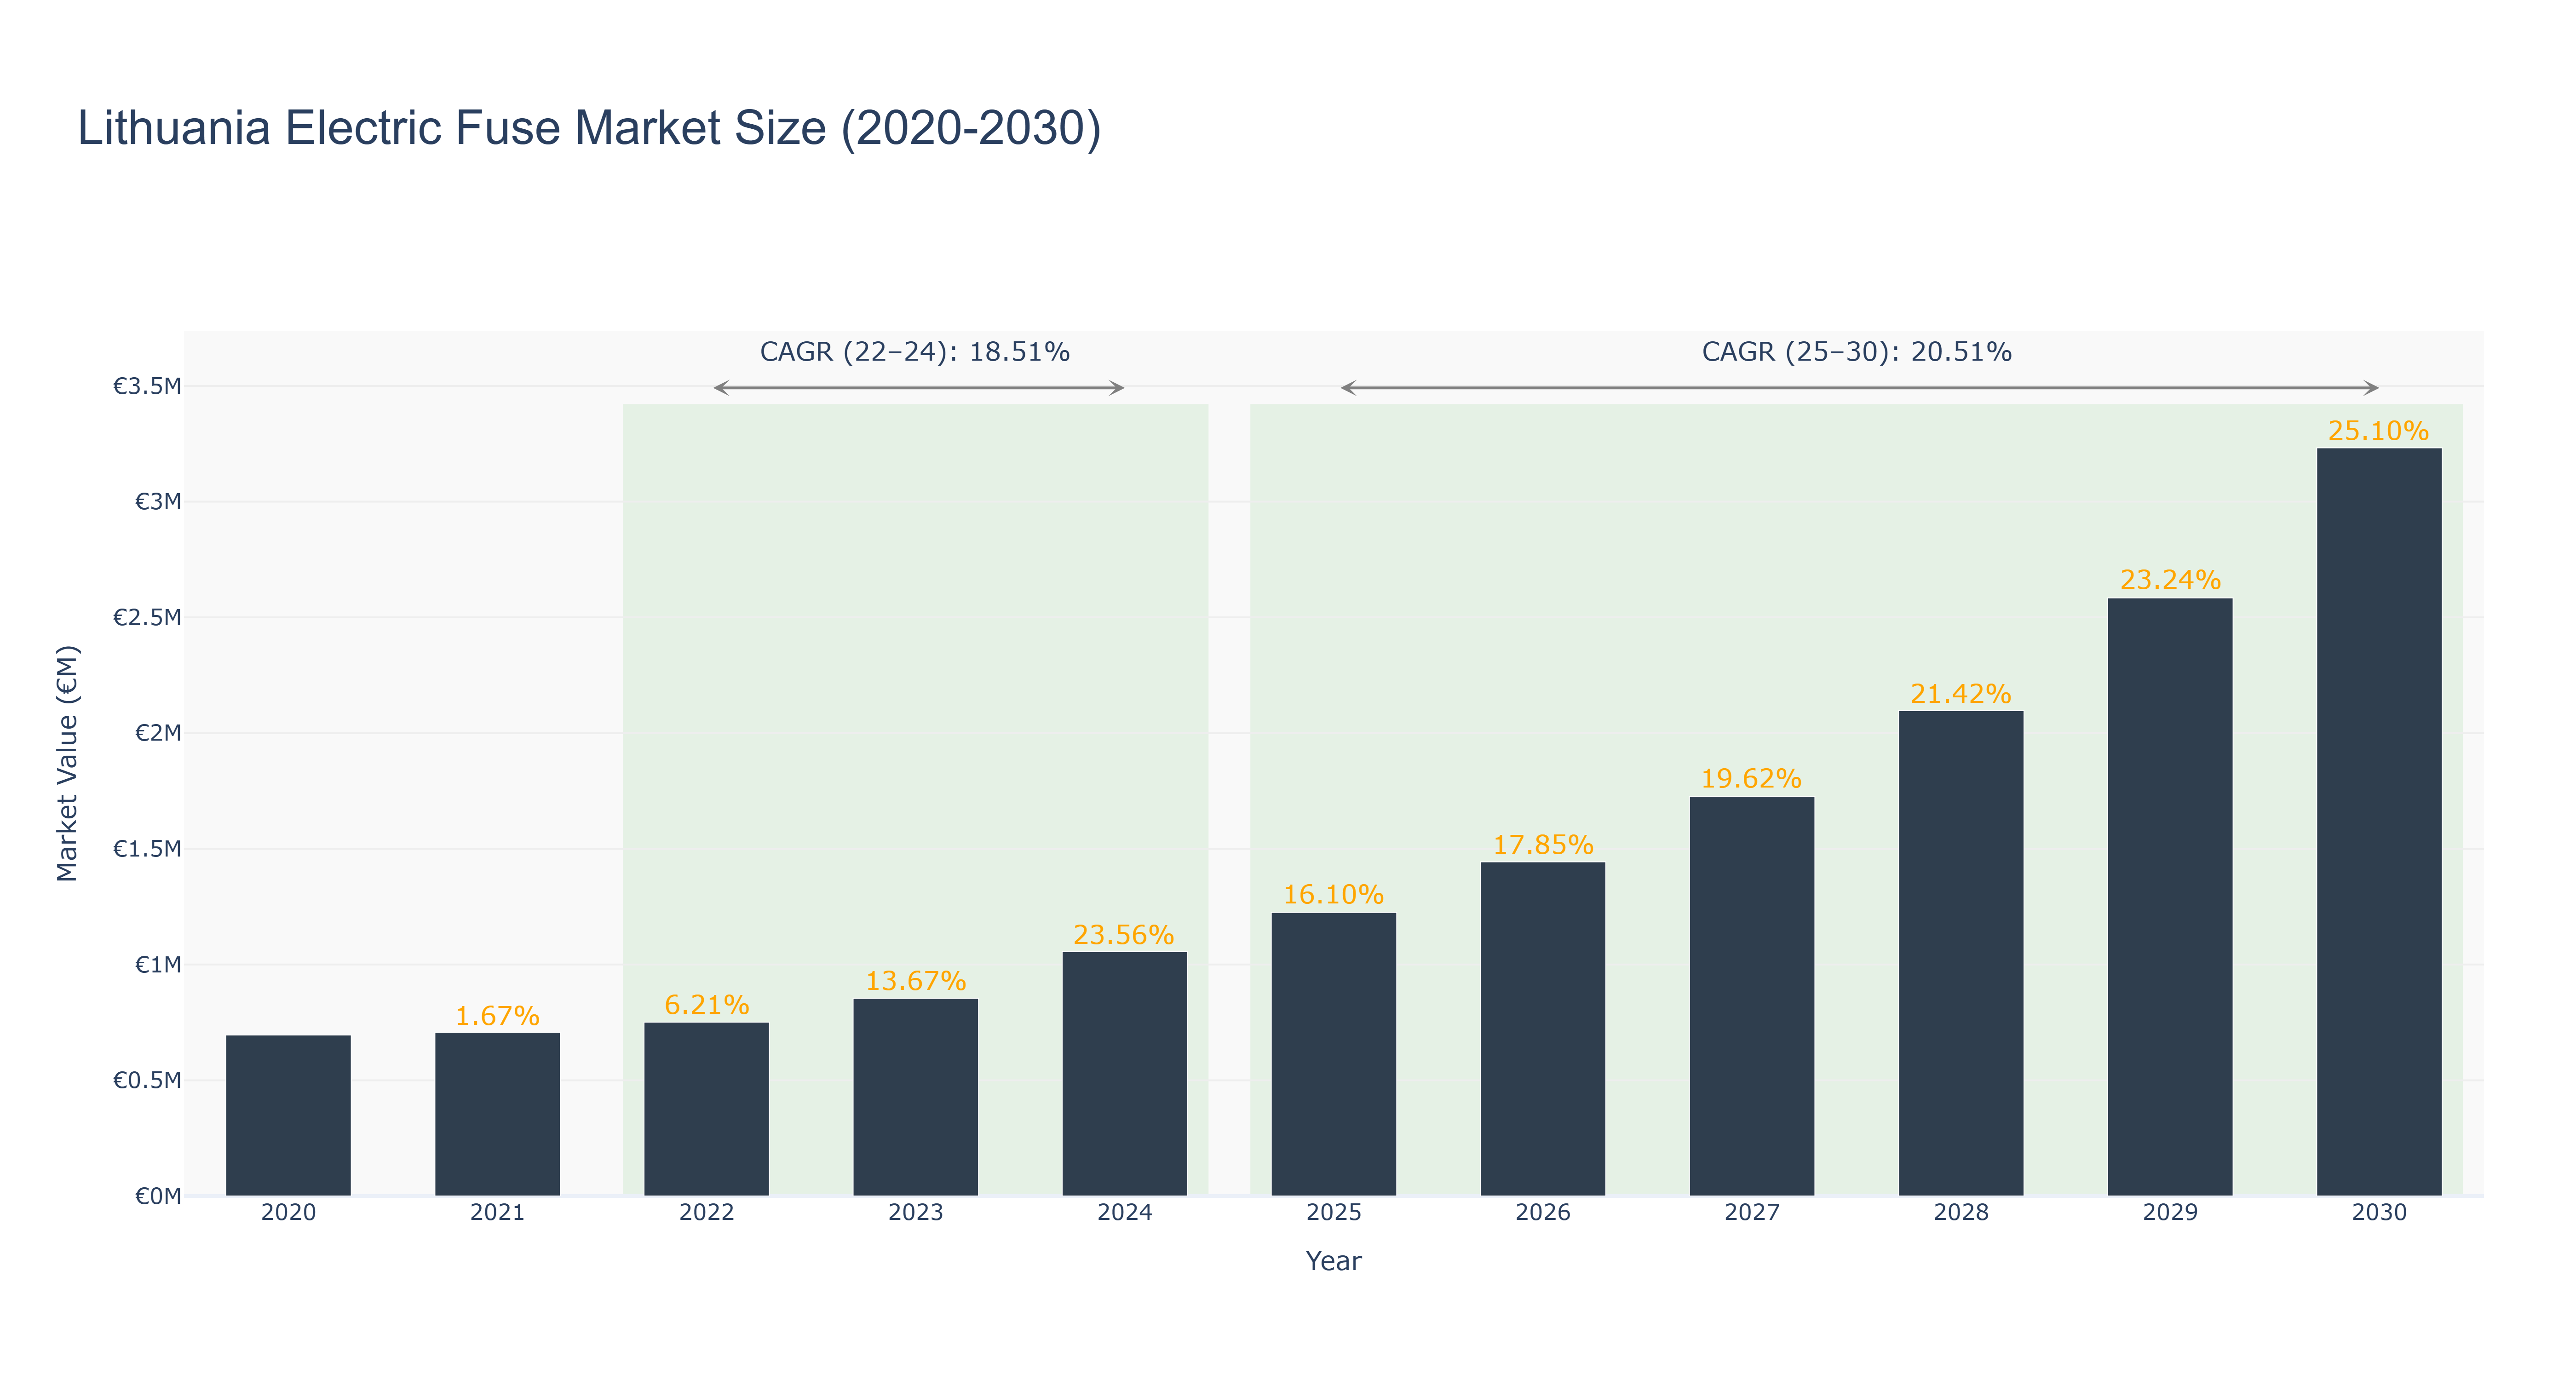
The Lithuania Electric Fuse Market has shown a steady growth trajectory over the years. The market size increased from €0.70 million in 2020 to €3.23 million in 2030, with a notable peak in 2029. The market experienced significant growth from 2020 to 2024, attributed to increasing demand for electric fuses in various industries. The forecasted CAGR for the period 2025-2030 is 20.51%, indicating a promising outlook for the market. The CAGR from 2022-2024 was 18.51%, reflecting a period of strong expansion. Industry drivers such as technological advancements in electrical systems and the rise in industrial automation are expected to fuel further growth. Looking ahead, upcoming infrastructure projects in Lithuania, such as the development of smart cities, are anticipated to drive demand for electric fuses in the market.
Lithuania Electric Fuse Market: Production & Trade Performance (2019-2025)
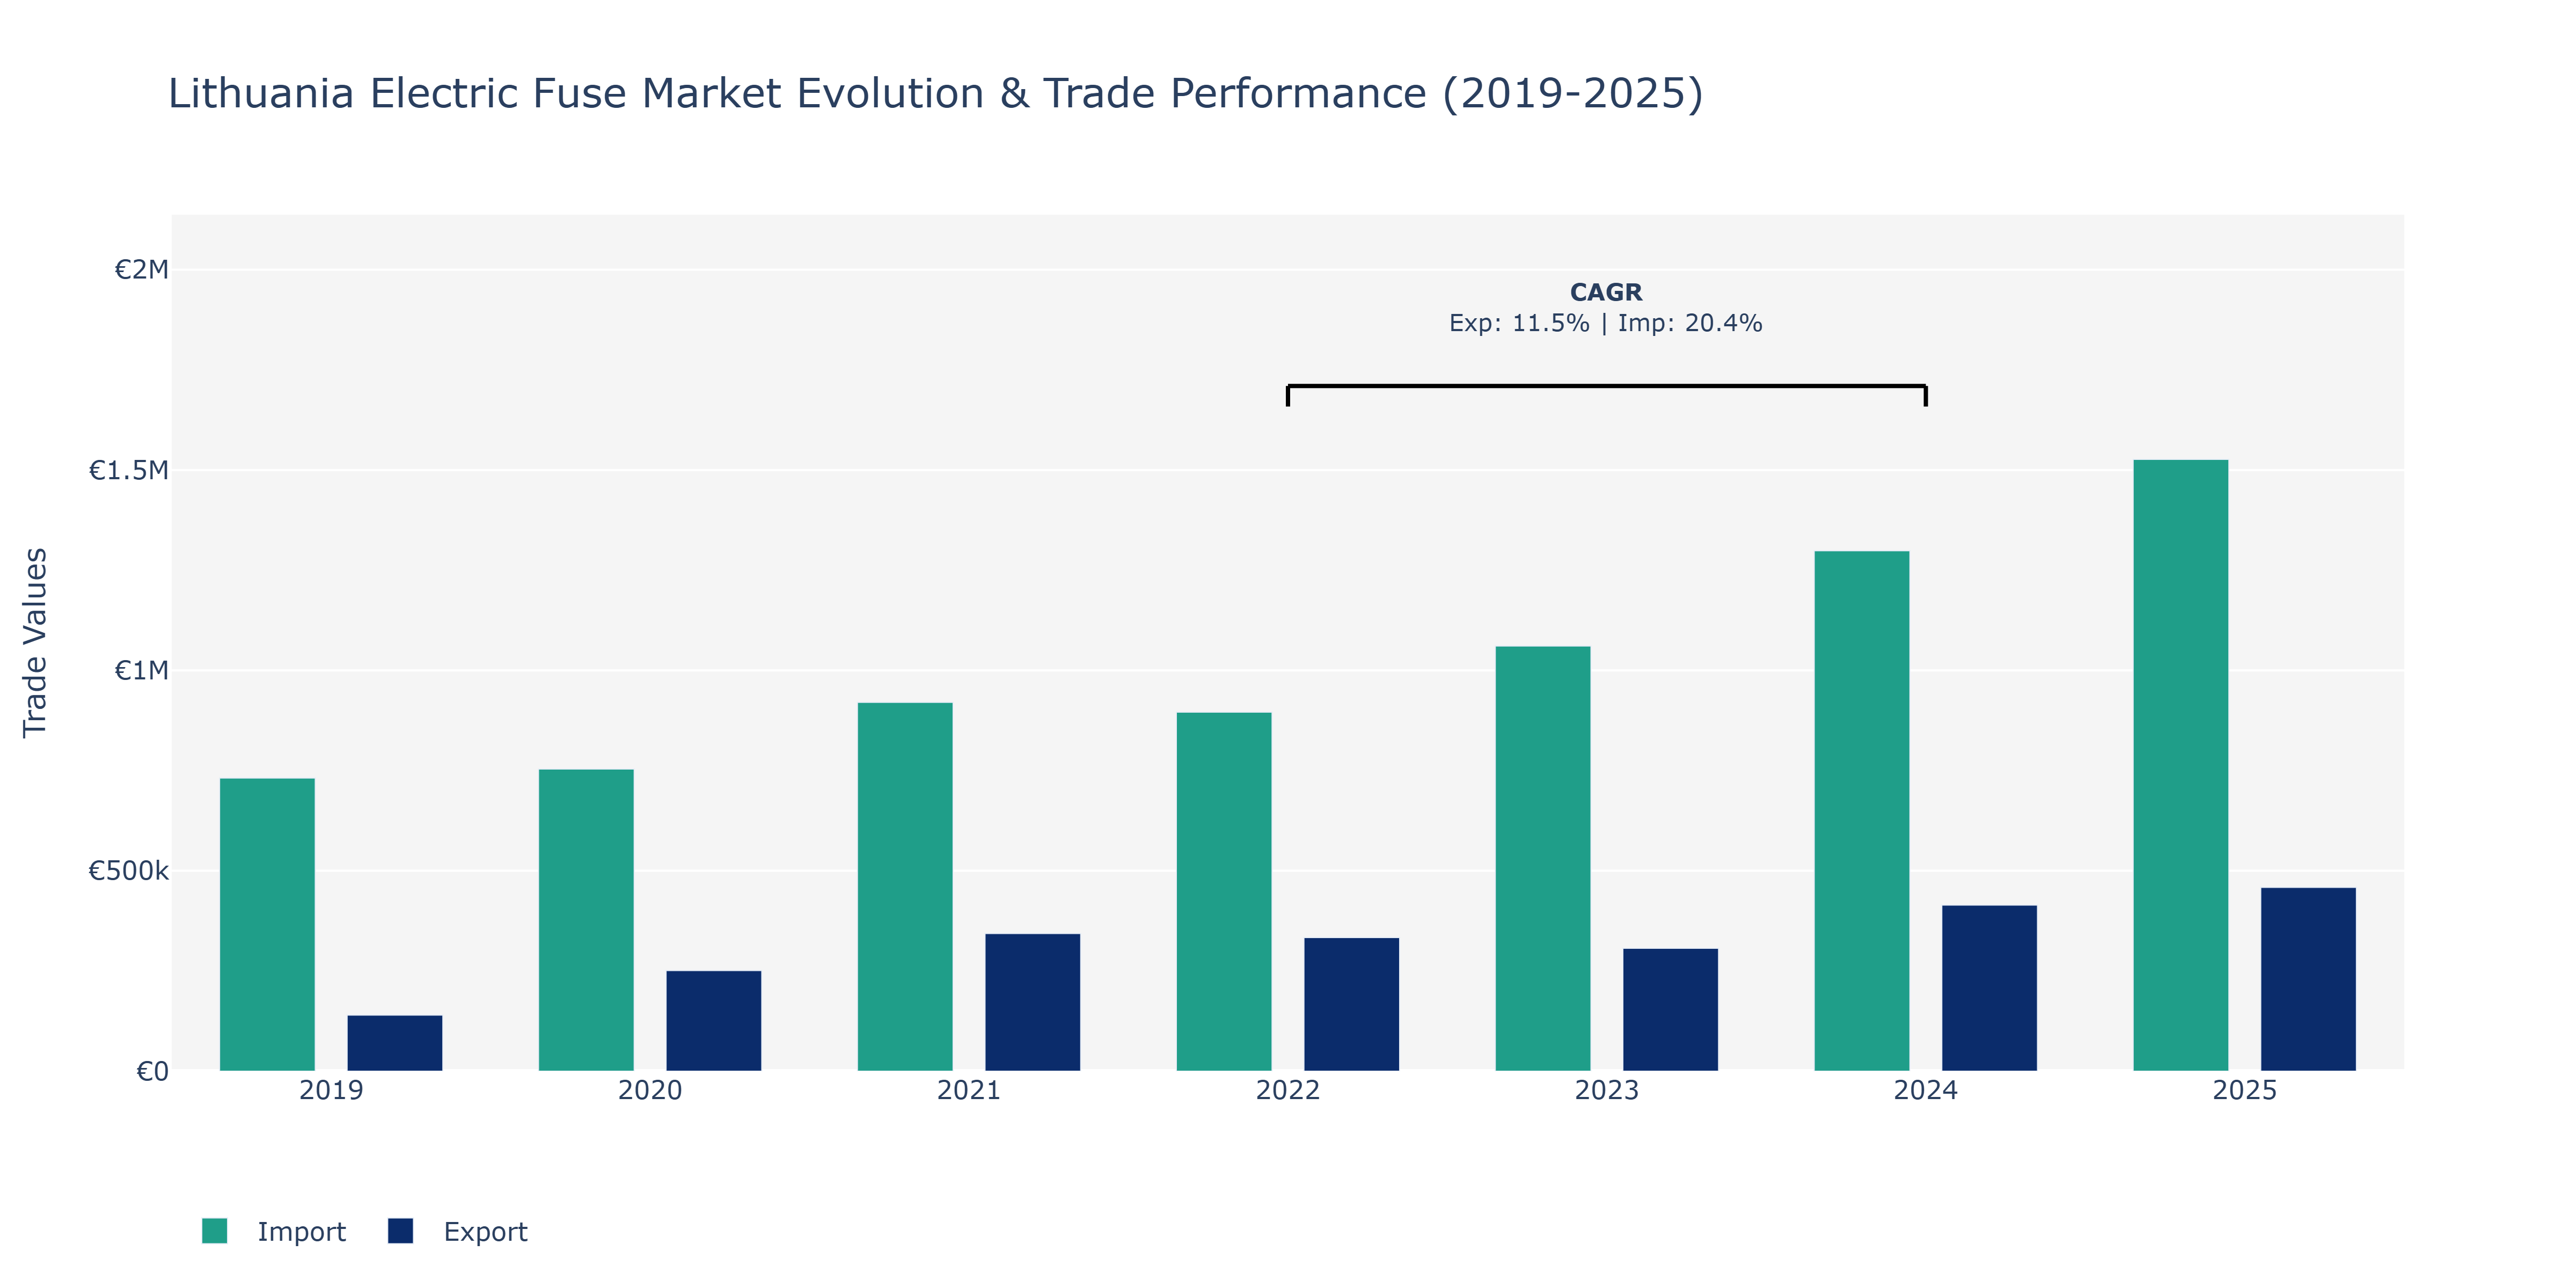
In the Lithuania Electric Fuse Market, exports and imports exhibited distinct trends from 2019 to 2025. Exports saw steady growth throughout the period, starting at €139.99 thousand in 2019 and reaching €458.46 thousand in 2025. This consistent upward trajectory may be attributed to the increasing demand for electric fuses globally, potentially fueled by the rising adoption of renewable energy sources and the expansion of the electrical infrastructure. In contrast, imports also showed a continuous upward trend, growing from €731.51 thousand in 2019 to €1.53 million in 2025. The surge in imports could indicate Lithuania's role as a key player in the electric fuse market, necessitating the need to meet both domestic and international demand. The notable peak in imports in 2025 could be linked to advancements in technology leading to more specialized electric fuses being sourced from abroad to cater to evolving industry requirements.
Key Highlights of the Report:
- Lithuania Electric Fuse Market Outlook
- Market Size of Lithuania Electric Fuse Market, 2025
- Forecast of Lithuania Electric Fuse Market, 2032
- Historical Data and Forecast of Lithuania Electric Fuse Revenues & Volume for the Period 2022 - 2032F
- Lithuania Electric Fuse Market Trend Evolution
- Lithuania Electric Fuse Market Drivers and Challenges
- Lithuania Electric Fuse Price Trends
- Lithuania Electric Fuse Porter`s Five Forces
- Lithuania Electric Fuse Industry Life Cycle
- Historical Data and Forecast of Lithuania Electric Fuse Market Revenues & Volume By Type for the Period 2022 - 2032F
- Historical Data and Forecast of Lithuania Electric Fuse Market Revenues & Volume By Power fuse and fuse links for the Period 2022 - 2032F
- Historical Data and Forecast of Lithuania Electric Fuse Market Revenues & Volume By Distribution cutouts for the Period 2022 - 2032F
- Historical Data and Forecast of Lithuania Electric Fuse Market Revenues & Volume By Cartridge and plug fuses for the Period 2022 - 2032F
- Historical Data and Forecast of Lithuania Electric Fuse Market Revenues & Volume By Others for the Period 2022 - 2032F
- Historical Data and Forecast of Lithuania Electric Fuse Market Revenues & Volume By Voltage for the Period 2022 - 2032F
- Historical Data and Forecast of Lithuania Electric Fuse Market Revenues & Volume By Low Voltage for the Period 2022 - 2032F
- Historical Data and Forecast of Lithuania Electric Fuse Market Revenues & Volume By Medium Voltage for the Period 2022 - 2032F
- Historical Data and Forecast of Lithuania Electric Fuse Market Revenues & Volume By End-users for the Period 2022 - 2032F
- Historical Data and Forecast of Lithuania Electric Fuse Market Revenues & Volume By Residential for the Period 2022 - 2032F
- Historical Data and Forecast of Lithuania Electric Fuse Market Revenues & Volume By Commercial for the Period 2022 - 2032F
- Historical Data and Forecast of Lithuania Electric Fuse Market Revenues & Volume By Industrial for the Period 2022 - 2032F
- Historical Data and Forecast of Lithuania Electric Fuse Market Revenues & Volume By Utilities for the Period 2022 - 2032F
- Historical Data and Forecast of Lithuania Electric Fuse Market Revenues & Volume By Transportation for the Period 2022 - 2032F
- Lithuania Electric Fuse Import Export Trade Statistics
- Market Opportunity Assessment By Type
- Market Opportunity Assessment By Voltage
- Market Opportunity Assessment By End-users
- Lithuania Electric Fuse Top Companies Market Share
- Lithuania Electric Fuse Competitive Benchmarking By Technical and Operational Parameters
- Lithuania Electric Fuse Company Profiles
- Lithuania Electric Fuse Key Strategic Recommendations
Frequently Asked Questions About the Market Study (FAQs):
6Wresearch actively monitors the Lithuania Electric Fuse Market and publishes its comprehensive annual report, highlighting emerging trends, growth drivers, revenue analysis, and forecast outlook. Our insights help businesses to make data-backed strategic decisions with ongoing market dynamics. Our analysts track relevent industries related to the Lithuania Electric Fuse Market, allowing our clients with actionable intelligence and reliable forecasts tailored to emerging regional needs.
Yes, we provide customisation as per your requirements. To learn more, feel free to contact us on sales@6wresearch.com
1 Executive Summary |
2 Introduction |
2.1 Key Highlights of the Report |
2.2 Report Description |
2.3 Market Scope & Segmentation |
2.4 Research Methodology |
2.5 Assumptions |
3 Lithuania Electric Fuse Market Overview |
3.1 Lithuania Country Macro Economic Indicators |
3.2 Lithuania Electric Fuse Market Revenues & Volume, 2022 & 2032F |
3.3 Lithuania Electric Fuse Market - Industry Life Cycle |
3.4 Lithuania Electric Fuse Market - Porter's Five Forces |
3.5 Lithuania Electric Fuse Market Revenues & Volume Share, By Type, 2022 & 2032F |
3.6 Lithuania Electric Fuse Market Revenues & Volume Share, By Voltage, 2022 & 2032F |
3.7 Lithuania Electric Fuse Market Revenues & Volume Share, By End-users, 2022 & 2032F |
4 Lithuania Electric Fuse Market Dynamics |
4.1 Impact Analysis |
4.2 Market Drivers |
4.2.1 Increasing demand for electricity in Lithuania |
4.2.2 Growth in industrial and commercial construction activities |
4.2.3 Emphasis on renewable energy sources leading to the expansion of the electric grid infrastructure |
4.3 Market Restraints |
4.3.1 Price volatility of raw materials used in electric fuse manufacturing |
4.3.2 Competition from alternative technologies like circuit breakers |
4.3.3 Regulatory restrictions on the disposal of electric fuses due to environmental concerns |
5 Lithuania Electric Fuse Market Trends |
6 Lithuania Electric Fuse Market Segmentations |
6.1 Lithuania Electric Fuse Market, By Type |
6.1.1 Overview and Analysis |
6.1.2 Lithuania Electric Fuse Market Revenues & Volume, By Power fuse and fuse links, 2022 - 2032F |
6.1.3 Lithuania Electric Fuse Market Revenues & Volume, By Distribution cutouts, 2022 - 2032F |
6.1.4 Lithuania Electric Fuse Market Revenues & Volume, By Cartridge and plug fuses, 2022 - 2032F |
6.1.5 Lithuania Electric Fuse Market Revenues & Volume, By Others, 2022 - 2032F |
6.2 Lithuania Electric Fuse Market, By Voltage |
6.2.1 Overview and Analysis |
6.2.2 Lithuania Electric Fuse Market Revenues & Volume, By Low Voltage, 2022 - 2032F |
6.2.3 Lithuania Electric Fuse Market Revenues & Volume, By Medium Voltage, 2022 - 2032F |
6.3 Lithuania Electric Fuse Market, By End-users |
6.3.1 Overview and Analysis |
6.3.2 Lithuania Electric Fuse Market Revenues & Volume, By Residential, 2022 - 2032F |
6.3.3 Lithuania Electric Fuse Market Revenues & Volume, By Commercial, 2022 - 2032F |
6.3.4 Lithuania Electric Fuse Market Revenues & Volume, By Industrial, 2022 - 2032F |
6.3.5 Lithuania Electric Fuse Market Revenues & Volume, By Utilities, 2022 - 2032F |
6.3.6 Lithuania Electric Fuse Market Revenues & Volume, By Transportation, 2022 - 2032F |
7 Lithuania Electric Fuse Market Import-Export Trade Statistics |
7.1 Lithuania Electric Fuse Market Export to Major Countries |
7.2 Lithuania Electric Fuse Market Imports from Major Countries |
8 Lithuania Electric Fuse Market Key Performance Indicators |
8.1 Percentage of electricity generated from renewable sources in Lithuania |
8.2 Number of new industrial and commercial construction projects in the country |
8.3 Investment in electric grid infrastructure upgrades and expansion |
9 Lithuania Electric Fuse Market - Opportunity Assessment |
9.1 Lithuania Electric Fuse Market Opportunity Assessment, By Type, 2022 & 2032F |
9.2 Lithuania Electric Fuse Market Opportunity Assessment, By Voltage, 2022 & 2032F |
9.3 Lithuania Electric Fuse Market Opportunity Assessment, By End-users, 2022 & 2032F |
10 Lithuania Electric Fuse Market - Competitive Landscape |
10.1 Lithuania Electric Fuse Market Revenue Share, By Companies, 2025 |
10.2 Lithuania Electric Fuse Market Competitive Benchmarking, By Operating and Technical Parameters |
11 Company Profiles |
12 Recommendations | 13 Disclaimer |
Global Go To Market Strategy - 2030
Export potential enables firms to identify high-growth global markets with greater confidence by combining advanced trade intelligence with a structured quantitative methodology. The framework analyzes emerging demand trends and country-level import patterns while integrating macroeconomic and trade datasets such as GDP and population forecasts, bilateral import–export flows, tariff structures, elasticity differentials between developed and developing economies, geographic distance, and import demand projections. Using weighted trade values from 2020–2024 as the base period to project country-to-country export potential for 2030, these inputs are operationalized through calculated drivers such as gravity model parameters, tariff impact factors, and projected GDP per-capita growth. Through an analysis of hidden potentials, demand hotspots, and market conditions that are most favorable to success, this method enables firms to focus on target countries, maximize returns, and global expansion with data, backed by accuracy.
By factoring in the projected importer demand gap that is currently unmet and could be potential opportunity, it identifies the potential for the Exporter (Country) among 190 countries, against the general trade analysis, which identifies the biggest importer or exporter.
To discover high-growth global markets and optimize your business strategy:
Click Here
Pricing
- Single User License$ 1,995
- Department License$ 2,400
- Site License$ 3,120
- Global License$ 3,795

Leadership Perspectives from Industry Events
Search
Thought Leadership and Analyst Meet


Our Clients
6WResearch In News
- India Air Conditioner Market Set for Strong Rebound in 2026 After Weather-Led Correction and GST-Driven Recovery: 6Wresearch
- ADAS in India: How Automatic Emergency Braking, Blind Spot Detection & Driver Monitoring are Transforming Road Safety
- Doha a strategic location for EV manufacturing hub: IPA Qatar
- Demand for luxury TVs surging in the GCC, says Samsung
- Empowering Growth: The Thriving Journey of Bangladesh’s Cable Industry
- Demand for luxury TVs surging in the GCC, says Samsung
Latest Reports
- Poland Fire Protection Systems Market (2026-2032)
- Cape Verde Portable Hand-Thrown Extinguisher Market (2026-2032)
- Canada Portable Hand-Thrown Extinguisher Market (2026-2032)
- Cameroon Portable Hand-Thrown Extinguisher Market (2026-2032)
- Burundi Portable Hand-Thrown Extinguisher Market (2026-2032)
- Burkina Faso Portable Hand-Thrown Extinguisher Market (2026-2032)
- Bulgaria Portable Hand-Thrown Extinguisher Market (2026-2032)
- Brunei Portable Hand-Thrown Extinguisher Market (2026-2032)
- Botswana Portable Hand-Thrown Extinguisher Market (2026-2032)
- Bosnia and Herzegovina Portable Hand-Thrown Extinguisher Market (2026-2032)
Industry Events and Analyst Meet

HIMTEX 2026

India Refining Summit 2026

India EV Show 2026

EV tech India Expo 2026

Auto Tech Asia 2026
Whitepaper
- Middle East & Africa Commercial Security Market Click here to view more.
- Middle East & Africa Fire Safety Systems & Equipment Market Click here to view more.
- GCC Drone Market Click here to view more.
- Middle East Lighting Fixture Market Click here to view more.
- GCC Physical & Perimeter Security Market Click here to view more.