Lithuania Soup Market (2026-2032) | Analysis, Industry, Value, Forecast, Competitive Landscape, Companies, Outlook, Trends, Segmentation, Size & Revenue, Growth, Share
Market Forecast By Category (Vegetarian Soup, Non-Vegetarian Soup), By Type (Dehydrated, Instant, Canned/Preserved, Chilled, Frozen, UHT, Others), By Packaging (Canned, Pouch, Other), By Distribution Channels (Supermarket/Hypermarkets, Convenience Stores, Online Retail Stores, Others) And Competitive Landscape
| Product Code: ETC8051787 | Publication Date: Sep 2024 | Updated Date: Apr 2026 | Product Type: Market Research Report | |
| Publisher: 6Wresearch | Author: Summon Dutta | No. of Pages: 75 | No. of Figures: 35 | No. of Tables: 20 |
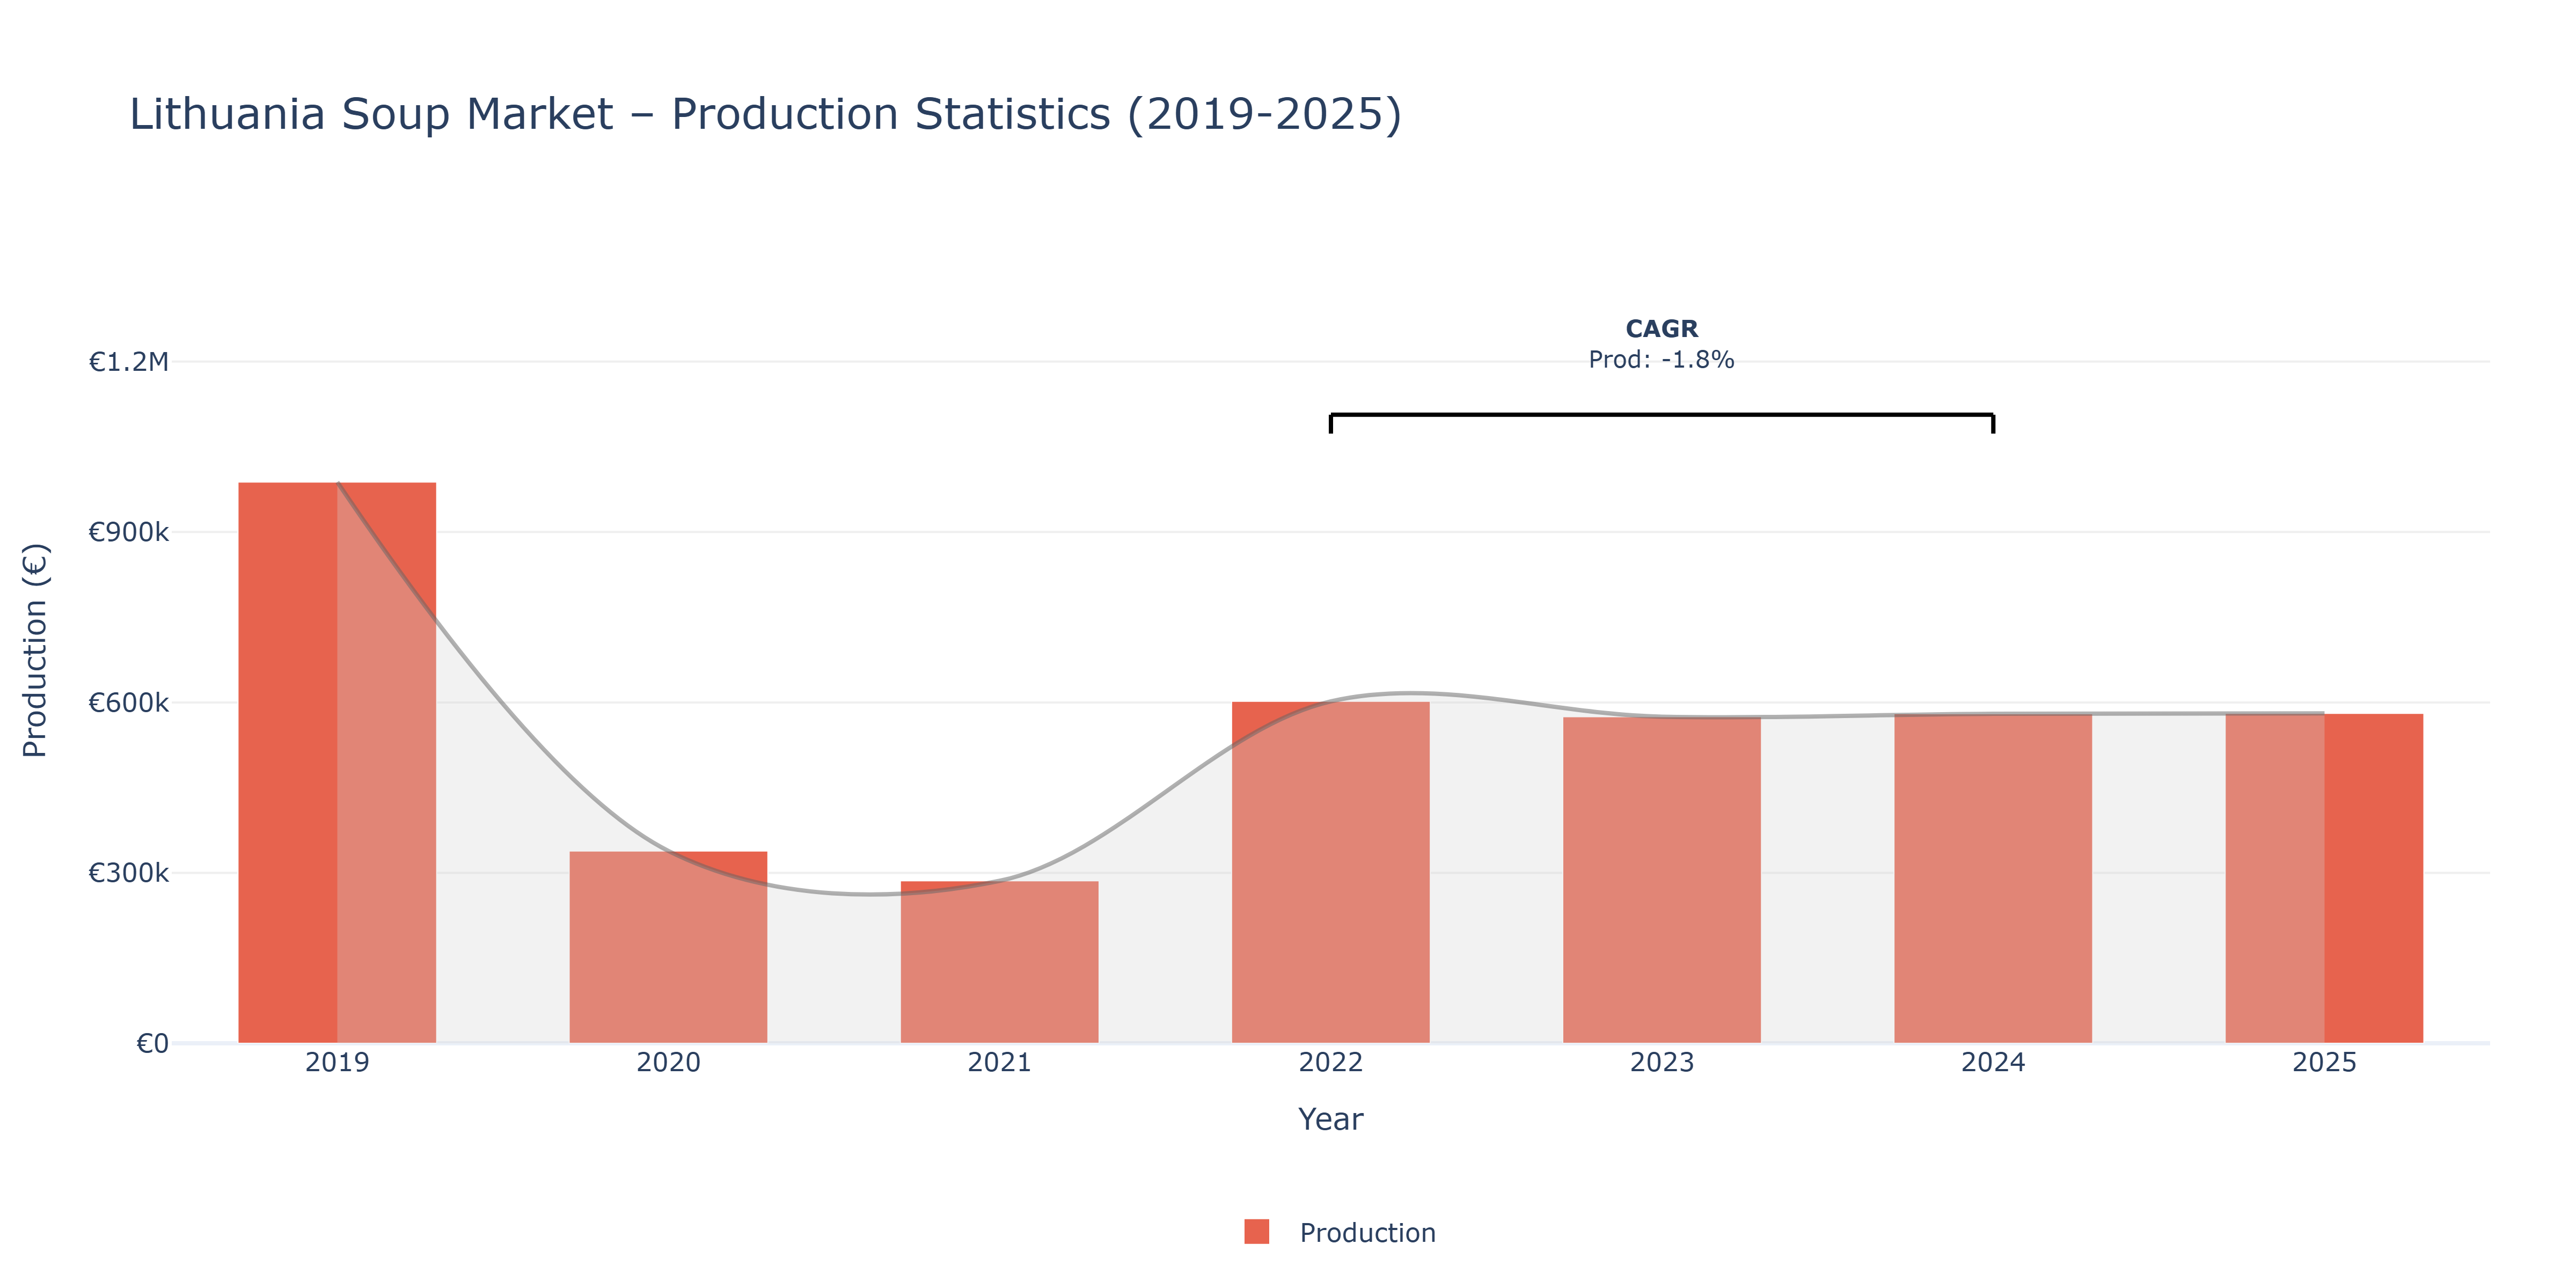
Lithuania Soup - Market Production Statistics (2019-2025)
The production in the Lithuania Soup Market exhibited significant fluctuations over the years, with a notable decrease from €987.95 thousand in 2019 to €286.00 thousand in 2021, followed by a gradual recovery to €580.72 thousand in 2025. The sharp decline from 2019 to 2021 can be attributed to changing consumer preferences, economic uncertainties, and possibly supply chain disruptions. The subsequent increase from 2022 onwards may reflect industry efforts to innovate, introduce new products, or enhance production efficiencies. The calculated Production CAGR of -1.84% from 2022 to 2024 indicates a slight negative growth rate during this period, which aligns with the overall downward trend observed in the market. These fluctuations underscore the market's dynamic nature and the need for market players to adapt to evolving consumer demands and external factors to ensure sustained growth.
Key Highlights of the Report:
- Lithuania Soup Market Outlook
- Market Size of Lithuania Soup Market, 2025
- Forecast of Lithuania Soup Market, 2032
- Historical Data and Forecast of Lithuania Soup Revenues & Volume for the Period 2022 - 2032
- Lithuania Soup Market Trend Evolution
- Lithuania Soup Market Drivers and Challenges
- Lithuania Soup Price Trends
- Lithuania Soup Porter's Five Forces
- Lithuania Soup Industry Life Cycle
- Historical Data and Forecast of Lithuania Soup Market Revenues & Volume By Category for the Period 2022 - 2032
- Historical Data and Forecast of Lithuania Soup Market Revenues & Volume By Vegetarian Soup for the Period 2022 - 2032
- Historical Data and Forecast of Lithuania Soup Market Revenues & Volume By Non-Vegetarian Soup for the Period 2022 - 2032
- Historical Data and Forecast of Lithuania Soup Market Revenues & Volume By Type for the Period 2022 - 2032
- Historical Data and Forecast of Lithuania Soup Market Revenues & Volume By Dehydrated for the Period 2022 - 2032
- Historical Data and Forecast of Lithuania Soup Market Revenues & Volume By Instant for the Period 2022 - 2032
- Historical Data and Forecast of Lithuania Soup Market Revenues & Volume By Canned/Preserved for the Period 2022 - 2032
- Historical Data and Forecast of Lithuania Soup Market Revenues & Volume By Chilled for the Period 2022 - 2032
- Historical Data and Forecast of Lithuania Soup Market Revenues & Volume By Frozen for the Period 2022 - 2032
- Historical Data and Forecast of Lithuania Soup Market Revenues & Volume By UHT for the Period 2022 - 2032
- Historical Data and Forecast of Lithuania Soup Market Revenues & Volume By Others for the Period 2022 - 2032
- Historical Data and Forecast of Lithuania Soup Market Revenues & Volume By Packaging for the Period 2022 - 2032
- Historical Data and Forecast of Lithuania Soup Market Revenues & Volume By Canned for the Period 2022 - 2032
- Historical Data and Forecast of Lithuania Soup Market Revenues & Volume By Pouch for the Period 2022 - 2032
- Historical Data and Forecast of Lithuania Soup Market Revenues & Volume By Other for the Period 2022 - 2032
- Historical Data and Forecast of Lithuania Soup Market Revenues & Volume By Distribution Channels for the Period 2022 - 2032
- Historical Data and Forecast of Lithuania Soup Market Revenues & Volume By Supermarket/Hypermarkets for the Period 2022 - 2032
- Historical Data and Forecast of Lithuania Soup Market Revenues & Volume By Convenience Stores for the Period 2022 - 2032
- Historical Data and Forecast of Lithuania Soup Market Revenues & Volume By Online Retail Stores for the Period 2022 - 2032
- Historical Data and Forecast of Lithuania Soup Market Revenues & Volume By Others for the Period 2022 - 2032
- Lithuania Soup Import Export Trade Statistics
- Market Opportunity Assessment By Category
- Market Opportunity Assessment By Type
- Market Opportunity Assessment By Packaging
- Market Opportunity Assessment By Distribution Channels
- Lithuania Soup Top Companies Market Share
- Lithuania Soup Competitive Benchmarking By Technical and Operational Parameters
- Lithuania Soup Company Profiles
- Lithuania Soup Key Strategic Recommendations
Frequently Asked Questions About the Market Study (FAQs):
6Wresearch actively monitors the Lithuania Soup Market and publishes its comprehensive annual report, highlighting emerging trends, growth drivers, revenue analysis, and forecast outlook. Our insights help businesses to make data-backed strategic decisions with ongoing market dynamics. Our analysts track relevent industries related to the Lithuania Soup Market, allowing our clients with actionable intelligence and reliable forecasts tailored to emerging regional needs.
Yes, we provide customisation as per your requirements. To learn more, feel free to contact us on sales@6wresearch.com
1 Executive Summary |
2 Introduction |
2.1 Key Highlights of the Report |
2.2 Report Description |
2.3 Market Scope & Segmentation |
2.4 Research Methodology |
2.5 Assumptions |
3 Lithuania Soup Market Overview |
3.1 Lithuania Country Macro Economic Indicators |
3.2 Lithuania Soup Market Revenues & Volume, 2022 & 2032F |
3.3 Lithuania Soup Market - Industry Life Cycle |
3.4 Lithuania Soup Market - Porter's Five Forces |
3.5 Lithuania Soup Market Revenues & Volume Share, By Category, 2022 & 2032F |
3.6 Lithuania Soup Market Revenues & Volume Share, By Type, 2022 & 2032F |
3.7 Lithuania Soup Market Revenues & Volume Share, By Packaging, 2022 & 2032F |
3.8 Lithuania Soup Market Revenues & Volume Share, By Distribution Channels, 2022 & 2032F |
4 Lithuania Soup Market Dynamics |
4.1 Impact Analysis |
4.2 Market Drivers |
4.2.1 Increasing consumer awareness about the health benefits of consuming soups as a part of a balanced diet |
4.2.2 Growing demand for convenient and ready-to-eat meal options among busy urban populations |
4.2.3 Rising popularity of ethnic and exotic soup flavors driving product innovation and market expansion |
4.3 Market Restraints |
4.3.1 Seasonality of soup consumption, with higher demand during colder months |
4.3.2 Competition from other ready-to-eat meal options like instant noodles and fast food |
4.3.3 Fluctuating raw material prices impacting production costs and pricing strategies |
5 Lithuania Soup Market Trends |
6 Lithuania Soup Market, By Types |
6.1 Lithuania Soup Market, By Category |
6.1.1 Overview and Analysis |
6.1.2 Lithuania Soup Market Revenues & Volume, By Category, 2022 - 2032F |
6.1.3 Lithuania Soup Market Revenues & Volume, By Vegetarian Soup, 2022 - 2032F |
6.1.4 Lithuania Soup Market Revenues & Volume, By Non-Vegetarian Soup, 2022 - 2032F |
6.2 Lithuania Soup Market, By Type |
6.2.1 Overview and Analysis |
6.2.2 Lithuania Soup Market Revenues & Volume, By Dehydrated, 2022 - 2032F |
6.2.3 Lithuania Soup Market Revenues & Volume, By Instant, 2022 - 2032F |
6.2.4 Lithuania Soup Market Revenues & Volume, By Canned/Preserved, 2022 - 2032F |
6.2.5 Lithuania Soup Market Revenues & Volume, By Chilled, 2022 - 2032F |
6.2.6 Lithuania Soup Market Revenues & Volume, By Frozen, 2022 - 2032F |
6.2.7 Lithuania Soup Market Revenues & Volume, By UHT, 2022 - 2032F |
6.3 Lithuania Soup Market, By Packaging |
6.3.1 Overview and Analysis |
6.3.2 Lithuania Soup Market Revenues & Volume, By Canned, 2022 - 2032F |
6.3.3 Lithuania Soup Market Revenues & Volume, By Pouch, 2022 - 2032F |
6.3.4 Lithuania Soup Market Revenues & Volume, By Other, 2022 - 2032F |
6.4 Lithuania Soup Market, By Distribution Channels |
6.4.1 Overview and Analysis |
6.4.2 Lithuania Soup Market Revenues & Volume, By Supermarket/Hypermarkets, 2022 - 2032F |
6.4.3 Lithuania Soup Market Revenues & Volume, By Convenience Stores, 2022 - 2032F |
6.4.4 Lithuania Soup Market Revenues & Volume, By Online Retail Stores, 2022 - 2032F |
6.4.5 Lithuania Soup Market Revenues & Volume, By Others, 2022 - 2032F |
7 Lithuania Soup Market Import-Export Trade Statistics |
7.1 Lithuania Soup Market Export to Major Countries |
7.2 Lithuania Soup Market Imports from Major Countries |
8 Lithuania Soup Market Key Performance Indicators |
8.1 Average unit price of soup products in the market |
8.2 Number of new product launches and flavor innovations |
8.3 Consumer sentiment and feedback on soup quality and taste |
8.4 Percentage of households that include soup in their weekly meal plans |
8.5 Sustainability initiatives and certifications adopted by soup manufacturers |
9 Lithuania Soup Market - Opportunity Assessment |
9.1 Lithuania Soup Market Opportunity Assessment, By Category, 2022 & 2032F |
9.2 Lithuania Soup Market Opportunity Assessment, By Type, 2022 & 2032F |
9.3 Lithuania Soup Market Opportunity Assessment, By Packaging, 2022 & 2032F |
9.4 Lithuania Soup Market Opportunity Assessment, By Distribution Channels, 2022 & 2032F |
10 Lithuania Soup Market - Competitive Landscape |
10.1 Lithuania Soup Market Revenue Share, By Companies, 2025 |
10.2 Lithuania Soup Market Competitive Benchmarking, By Operating and Technical Parameters |
11 Company Profiles |
12 Recommendations |
13 Disclaimer |
Global Go To Market Strategy - 2030
Export potential enables firms to identify high-growth global markets with greater confidence by combining advanced trade intelligence with a structured quantitative methodology. The framework analyzes emerging demand trends and country-level import patterns while integrating macroeconomic and trade datasets such as GDP and population forecasts, bilateral import–export flows, tariff structures, elasticity differentials between developed and developing economies, geographic distance, and import demand projections. Using weighted trade values from 2020–2024 as the base period to project country-to-country export potential for 2030, these inputs are operationalized through calculated drivers such as gravity model parameters, tariff impact factors, and projected GDP per-capita growth. Through an analysis of hidden potentials, demand hotspots, and market conditions that are most favorable to success, this method enables firms to focus on target countries, maximize returns, and global expansion with data, backed by accuracy.
By factoring in the projected importer demand gap that is currently unmet and could be potential opportunity, it identifies the potential for the Exporter (Country) among 190 countries, against the general trade analysis, which identifies the biggest importer or exporter.
To discover high-growth global markets and optimize your business strategy:
Click Here
Pricing
- Single User License$ 1,995
- Department License$ 2,400
- Site License$ 3,120
- Global License$ 3,795

Leadership Perspectives from Industry Events
Search
Thought Leadership and Analyst Meet


Our Clients
6WResearch In News
- India Air Conditioner Market Set for Strong Rebound in 2026 After Weather-Led Correction and GST-Driven Recovery: 6Wresearch
- ADAS in India: How Automatic Emergency Braking, Blind Spot Detection & Driver Monitoring are Transforming Road Safety
- Doha a strategic location for EV manufacturing hub: IPA Qatar
- Demand for luxury TVs surging in the GCC, says Samsung
- Empowering Growth: The Thriving Journey of Bangladesh’s Cable Industry
- Demand for luxury TVs surging in the GCC, says Samsung
Latest Reports
- Poland Fire Protection Systems Market (2026-2032)
- Cape Verde Portable Hand-Thrown Extinguisher Market (2026-2032)
- Canada Portable Hand-Thrown Extinguisher Market (2026-2032)
- Cameroon Portable Hand-Thrown Extinguisher Market (2026-2032)
- Burundi Portable Hand-Thrown Extinguisher Market (2026-2032)
- Burkina Faso Portable Hand-Thrown Extinguisher Market (2026-2032)
- Bulgaria Portable Hand-Thrown Extinguisher Market (2026-2032)
- Brunei Portable Hand-Thrown Extinguisher Market (2026-2032)
- Botswana Portable Hand-Thrown Extinguisher Market (2026-2032)
- Bosnia and Herzegovina Portable Hand-Thrown Extinguisher Market (2026-2032)
Industry Events and Analyst Meet

HIMTEX 2026

India Refining Summit 2026

India EV Show 2026

EV tech India Expo 2026

Auto Tech Asia 2026
Whitepaper
- Middle East & Africa Commercial Security Market Click here to view more.
- Middle East & Africa Fire Safety Systems & Equipment Market Click here to view more.
- GCC Drone Market Click here to view more.
- Middle East Lighting Fixture Market Click here to view more.
- GCC Physical & Perimeter Security Market Click here to view more.