Mexico Fish Processing Market (2026-2032) | Share, Outlook, Revenue, Analysis, Industry, Trends, Size, Growth, Companies, Value & Forecast
Market Forecast By Source (Marine, Inland, Freshwater), By Application (Food, Feed, Biomedical, Others), By Processing (Frozen, Preserved, Others), By Equipment (Gutting, Scaling, Filleting, Deboning, Skinning, Curing & Smoking, Others) And Competitive Landscape
| Product Code: ETC042583 | Publication Date: Jan 2021 | Updated Date: Jun 2026 | Product Type: Report | |
| Publisher: 6Wresearch | Author: Ravi Bhandari | No. of Pages: 70 | No. of Figures: 35 | No. of Tables: 5 |
Mexico Fish Processing Market Summary
The mexico fish processing market was estimated at USD 207 Million in 2025 and is projected to reach USD 238 Million by 2032, growing at a CAGR of 0.7% from 2026 to 2032.
Mexico Fish Processing Market Growth Rate Analysis (2021-2032)
The Mexico fish processing market has seen a notable rebound following a challenging period, with growth shifting from a decline of 4.0% in 2021 to a robust 6.3% in 2022. This recovery was primarily fueled by rising consumer demand driven by health consciousness and increased seafood consumption. Continuing this upward trend, growth is projected at 4.0% in 2023 and gradually stabilizing to around 2.0%-2.9% by 2032, reflecting a maturing market. Investments in sustainable fishing practices and advancements in processing technology are enhancing efficiency and product quality. Additionally, the government's supportive policies aimed at boosting local production are expected to further stimulate growth, despite some fluctuations such as the slowdown to 0.7% in 2026.
Mexico Fish Processing Market Year-wise Growth Rate and Key Drivers
This graph highlights how the Mexico Fish Processing Market has steadily grown over the past five years, supported by major growth factors.
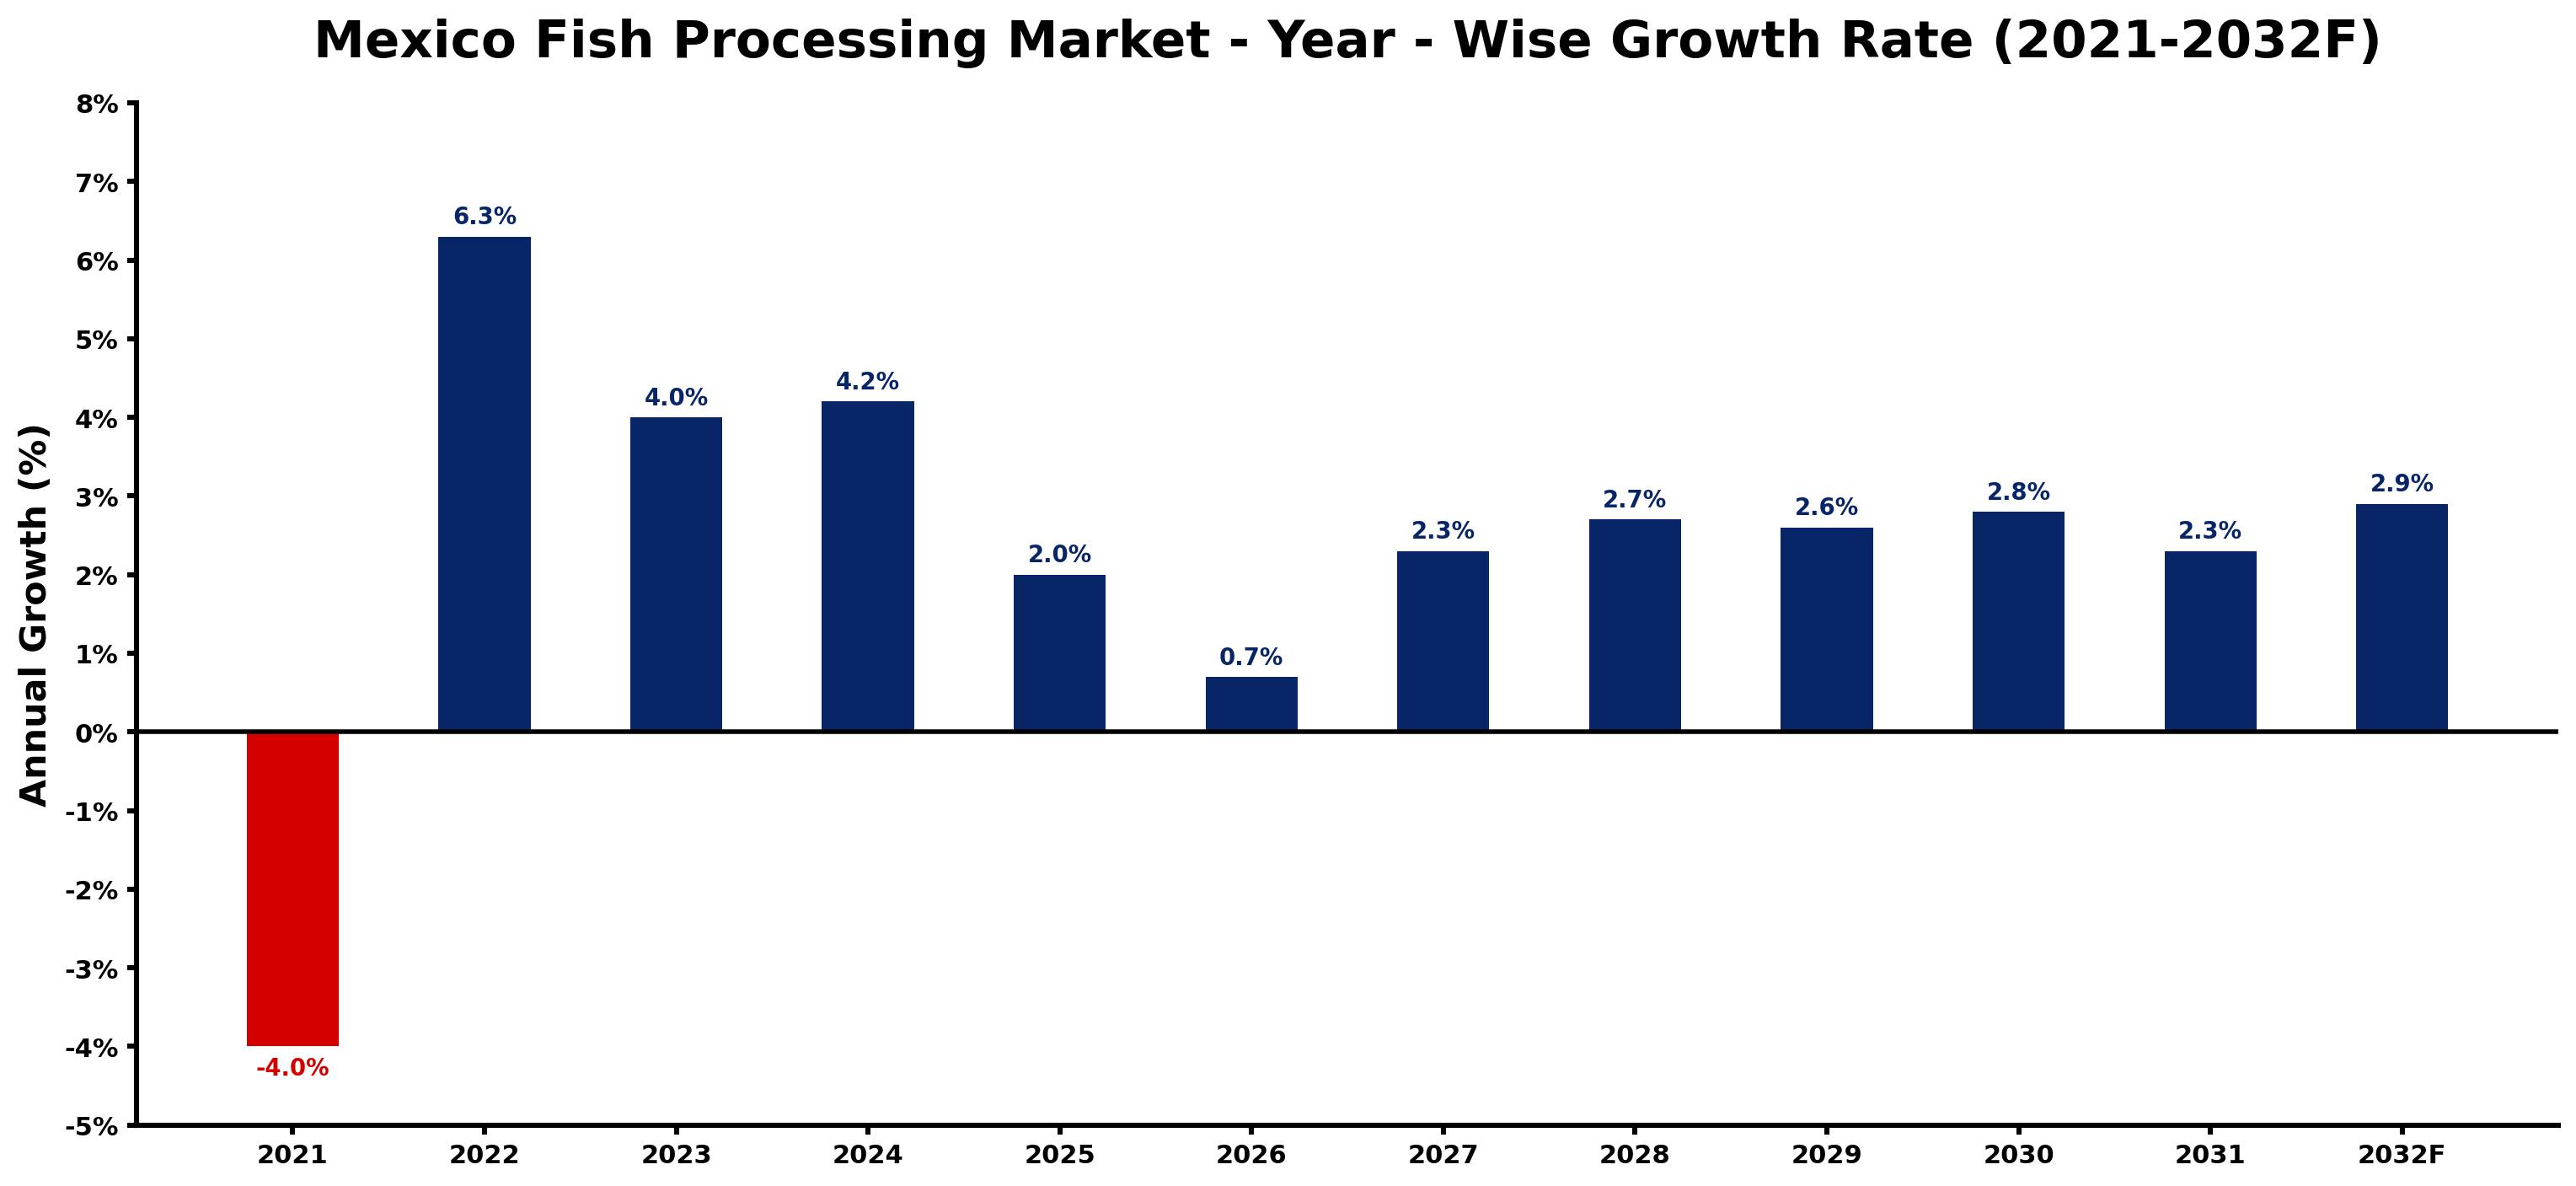
The table below presents the year wise growth rates along with the key drivers influencing the market
| Year | Growth Rate | Major Drivers |
| 2021 | -4.0% | Supply chain disruptions caused by the pandemic hindered fish sourcing and processing capabilities in Mexico. |
| 2022 | 6.3% | Local fisheries will increasingly embrace technology for sustainable fish processing methods. |
| 2023 | 4.0% | Trade agreements with the U.S. will expand export opportunities for processed fish products. |
| 2024 | 4.2% | Rising health consciousness among consumers will boost demand for nutritious seafood options. |
| 2025 | 2.0% | Innovations in freezing technology will preserve fish quality and extend shelf life significantly. |
| 2026 | 0.7% | Collaboration between processors and local fishermen will ensure sustainable sourcing practices. |
| 2027 | 2.3% | E-commerce platforms will simplify access to seafood, enhancing direct sales opportunities. |
| 2028 | 2.7% | Increased investment in cold chain logistics will streamline distribution efficiency across regions. |
| 2029 | 2.6% | Regional culinary trends will diversify product offerings in the fish processing sector. |
| 2030 | 2.8% | Sustainability certifications will influence consumer choices, driving premium products in the market. |
| 2031 | 2.3% | Rural communities will increasingly engage in artisanal fish processing, enriching local economies. |
| 2032 | 2.9% | International culinary events will showcase Mexican seafood, enhancing its global brand recognition. |
Note - Market size estimations and growth projections presented in this report are based on 6Wresearch's advanced forecasting approach, validated with industry datasets as of June 2026.
Mexico Fish Processing Market Synopsis
The Mexico Fish Processing Market is projected to reach 0.7% and witness significant growth during the forecast period (2026-2032). The industry benefits from Mexico's extensive coastline and rich marine biodiversity, positioning the country as a pivotal player in the global fish processing landscape. This market is influenced by escalating seafood consumption trends, prevailing international export demands, and evolving regulatory frameworks aimed at enhancing sustainability and food safety standards.
Mexico Fish Processing Market Growth Drivers
A variety of factors are propelling the Mexico Fish Processing Market forward, including:
- The abundant marine resources offer a wide range of fish species that can be processed, thereby catering to diverse consumer preferences.
- Increasing global demand for processed seafood products, driven by a rise in health consciousness among consumers who view fish as a healthy protein source.
- Technological advancements have improved processing efficiency, product shelf life, and the quality of seafood, driving further market expansion.
- Growing popularity of seafood in Mexican cuisine and global culinary trends enhances domestic consumption levels.
- The expanding food processing sector amplifies the need for quality seafood products, thereby reinforcing growth in fish processing capabilities.
Mexico Fish Processing Market Challenges and Restraints
Despite its robust growth potential, the Mexico Fish Processing Market faces several challenges:
- Environmental concerns and overfishing significantly affect fish populations, prompting the need for sustainable fishing practices.
- Stringent regulations regarding fishing quotas, sustainability certifications, and food safety standards require significant investment and adaptation from market participants.
- Consumer preferences are shifting towards fresh and minimally processed seafood, which poses a challenge for traditional processed fish products.
- Competitive pressure in both domestic and international markets necessitates continuous innovation and improvement in product offerings.
- Global supply chain disruptions, often influenced by geopolitical factors and environmental disasters, can impact raw material availability and processing operations.
Mexico Fish Processing Market Trends and Opportunities
Emerging trends within the Mexico Fish Processing Market point towards several promising opportunities:
- Increased consumer focus on sustainability is pushing companies to adopt eco-friendly practices and seek certifications that improve market appeal.
- The rise of e-commerce platforms enables fish processing firms to reach a broader consumer base directly, enhancing sales opportunities.
- Investment in innovative processing technologies, such as automation and artificial intelligence, is optimizing operational efficiency.
- Expansion into new export markets, particularly in Asia and Europe, provides avenues for growth by tapping into increasing demand for Mexican seafood.
- Development of value-added products, such as pre-marinated and ready-to-cook seafood, caters to changing consumer lifestyles and preferences.
Mexico Fish Processing Market Government Investment and Initiatives
The government plays a critical role in shaping the Mexico Fish Processing Market through various investments and initiatives aimed at enhancing sustainability and industry growth:
- Government policies promoting sustainable fisheries management are designed to protect marine ecosystems while supporting industry competitiveness.
- Investment in modern processing facilities and cold chain logistics has improved the quality of exported seafood, extending its shelf life and marketability.
- Public spending on research and development fosters innovation in aquaculture and processing technologies, ensuring industry players can meet global standards.
- Trade agreements and initiatives aimed at facilitating market access for Mexican seafood products enhance export opportunities for local processors.
- Regulatory frameworks focusing on food safety and quality assurance are tightening, necessitating ongoing compliance efforts from market participants.
Mexico Fish Processing Market Latest Developments (May 2025 - June 2026)
Recent developments in the Mexico Fish Processing Market indicate a shift towards greater innovation and sustainability. Industry stakeholders have increasingly focused on enhancing product quality through the adoption of modern technologies and sustainable practices. Additionally, there has been a noticeable increase in investments aimed at improving infrastructure, particularly in cold chain logistics, enabling better preservation and distribution of processed seafood. Collaborative efforts between public and private sectors have led to initiatives promoting responsible fishing practices, aligning with global sustainability goals. Furthermore, as international trade dynamics evolve, Mexican fish processors are actively exploring new markets, particularly in Asia and Europe, to meet the rising global demand for seafood products.
Mexico Fish Processing Market - Key Attractiveness of the Report
- 10 Years of Market Numbers
- Historical Data Starting from 2022 to 2025
- Base Year: 2025
- Forecast Data until 2032
- Key Performance Indicators Impacting the Market
- Major Upcoming Developments and Projects
Key Highlights of the Report:
- Mexico Fish Processing Market Outlook
- Market Size of Mexico Fish Processing Market, 2025
- Forecast of Mexico Fish Processing Market, 2032
- Historical Data and Forecast of Mexico Fish Processing Revenues & Volume for the Period 2022-2032F
- Mexico Fish Processing Market Trend Evolution
- Mexico Fish Processing Market Drivers and Challenges
- Mexico Fish Processing Price Trends
- Mexico Fish Processing Porter's Five Forces
- Mexico Fish Processing Industry Life Cycle
- Historical Data and Forecast of Mexico Fish Processing Market Revenues & Volume By Source for the Period 2022-2032F
- Historical Data and Forecast of Mexico Fish Processing Market Revenues & Volume By Marine for the Period 2022-2032F
- Historical Data and Forecast of Mexico Fish Processing Market Revenues & Volume By Inland for the Period 2022-2032F
- Historical Data and Forecast of Mexico Fish Processing Market Revenues & Volume By Freshwater for the Period 2022-2032F
- Historical Data and Forecast of Mexico Fish Processing Market Revenues & Volume By Application for the Period 2022-2032F
- Historical Data and Forecast of Mexico Fish Processing Market Revenues & Volume By Food for the Period 2022-2032F
- Historical Data and Forecast of Mexico Fish Processing Market Revenues & Volume By Feed for the Period 2022-2032F
- Historical Data and Forecast of Mexico Fish Processing Market Revenues & Volume By Biomedical for the Period 2022-2032F
- Historical Data and Forecast of Mexico Fish Processing Market Revenues & Volume By Others for the Period 2022-2032F
- Historical Data and Forecast of Mexico Fish Processing Market Revenues & Volume By Processing for the Period 2022-2032F
- Historical Data and Forecast of Mexico Fish Processing Market Revenues & Volume By Frozen for the Period 2022-2032F
- Historical Data and Forecast of Mexico Fish Processing Market Revenues & Volume By Preserved for the Period 2022-2032F
- Historical Data and Forecast of Mexico Fish Processing Market Revenues & Volume By Others for the Period 2022-2032F
- Historical Data and Forecast of Mexico Fish Processing Market Revenues & Volume By Equipment for the Period 2022-2032F
- Historical Data and Forecast of Mexico Fish Processing Market Revenues & Volume By Gutting for the Period 2022-2032F
- Historical Data and Forecast of Mexico Fish Processing Market Revenues & Volume By Scaling for the Period 2022-2032F
- Historical Data and Forecast of Mexico Fish Processing Market Revenues & Volume By Filleting for the Period 2022-2032F
- Historical Data and Forecast of Mexico Fish Processing Market Revenues & Volume By Deboning for the Period 2022-2032F
- Historical Data and Forecast of Mexico Fish Processing Market Revenues & Volume By Skinning for the Period 2022-2032F
- Historical Data and Forecast of Mexico Fish Processing Market Revenues & Volume By Curing & Smoking for the Period 2022-2032F
- Historical Data and Forecast of Mexico Fish Processing Market Revenues & Volume By Others for the Period 2022-2032F
- Mexico Fish Processing Import Export Trade Statistics
- Market Opportunity Assessment By Source
- Market Opportunity Assessment By Application
- Market Opportunity Assessment By Processing
- Market Opportunity Assessment By Equipment
- Mexico Fish Processing Top Companies Market Share
- Mexico Fish Processing Competitive Benchmarking By Technical and Operational Parameters
- Mexico Fish Processing Company Profiles
- Mexico Fish Processing Key Strategic Recommendations
Frequently Asked Questions About the Market Study (FAQs):
The growth in the Mexico Fish Processing Market is driven by increasing global seafood demand, technological advancements in processing methods, and a rise in domestic consumption due to changing dietary preferences.
The market faces significant challenges such as environmental concerns linked to overfishing, stringent regulatory requirements, and shifting consumer preferences towards fresher seafood options.
The government supports the fish processing industry through policies that promote sustainable practices, investments in modern processing facilities, and initiatives that improve trade access for Mexican seafood products.
Recent trends include a focus on sustainability, advancements in processing technology, and the development of value-added seafood products to cater to evolving consumer demands.
6Wresearch actively monitors the Mexico Fish Processing Market and publishes its comprehensive annual report, highlighting emerging trends, growth drivers, revenue analysis, and forecast outlook. Our insights help businesses to make data-backed strategic decisions with ongoing market dynamics. Our analysts track relevent industries related to the Mexico Fish Processing Market, allowing our clients with actionable intelligence and reliable forecasts tailored to emerging regional needs.
Yes, we provide customisation as per your requirements. To learn more, feel free to contact us on sales@6wresearch.com
1 Executive Summary |
2 Introduction |
2.1 Key Highlights of the Report |
2.2 Report Description |
2.3 Market Scope & Segmentation |
2.4 Research Methodology |
2.5 Assumptions |
3 Mexico Fish Processing Market Overview |
3.1 Mexico Country Macro Economic Indicators |
3.2 Mexico Fish Processing Market Revenues & Volume, 2022 & 2032F |
3.3 Mexico Fish Processing Market - Industry Life Cycle |
3.4 Mexico Fish Processing Market - Porter's Five Forces |
3.5 Mexico Fish Processing Market Revenues & Volume Share, By Source, 2022 & 2032F |
3.6 Mexico Fish Processing Market Revenues & Volume Share, By Application, 2022 & 2032F |
3.7 Mexico Fish Processing Market Revenues & Volume Share, By Processing, 2022 & 2032F |
3.8 Mexico Fish Processing Market Revenues & Volume Share, By Equipment, 2022 & 2032F |
4 Mexico Fish Processing Market Dynamics |
4.1 Impact Analysis |
4.2 Market Drivers |
4.2.1 Increasing demand for processed fish products due to changing consumer preferences and dietary habits |
4.2.2 Growing awareness about the health benefits of consuming fish products |
4.2.3 Technological advancements in fish processing methods leading to improved efficiency and quality |
4.3 Market Restraints |
4.3.1 Fluctuating raw material prices impacting profitability |
4.3.2 Stringent regulations and compliance requirements in the seafood industry |
4.3.3 Competition from alternative protein sources affecting market growth |
5 Mexico Fish Processing Market Trends |
6 Mexico Fish Processing Market, By Types |
6.1 Mexico Fish Processing Market, By Source |
6.1.1 Overview and Analysis |
6.1.2 Mexico Fish Processing Market Revenues & Volume, By Source, 2022-2032F |
6.1.3 Mexico Fish Processing Market Revenues & Volume, By Marine, 2022-2032F |
6.1.4 Mexico Fish Processing Market Revenues & Volume, By Inland, 2022-2032F |
6.1.5 Mexico Fish Processing Market Revenues & Volume, By Freshwater, 2022-2032F |
6.2 Mexico Fish Processing Market, By Application |
6.2.1 Overview and Analysis |
6.2.2 Mexico Fish Processing Market Revenues & Volume, By Food, 2022-2032F |
6.2.3 Mexico Fish Processing Market Revenues & Volume, By Feed, 2022-2032F |
6.2.4 Mexico Fish Processing Market Revenues & Volume, By Biomedical, 2022-2032F |
6.2.5 Mexico Fish Processing Market Revenues & Volume, By Others, 2022-2032F |
6.3 Mexico Fish Processing Market, By Processing |
6.3.1 Overview and Analysis |
6.3.2 Mexico Fish Processing Market Revenues & Volume, By Frozen, 2022-2032F |
6.3.3 Mexico Fish Processing Market Revenues & Volume, By Preserved, 2022-2032F |
6.3.4 Mexico Fish Processing Market Revenues & Volume, By Others, 2022-2032F |
6.4 Mexico Fish Processing Market, By Equipment |
6.4.1 Overview and Analysis |
6.4.2 Mexico Fish Processing Market Revenues & Volume, By Gutting, 2022-2032F |
6.4.3 Mexico Fish Processing Market Revenues & Volume, By Scaling, 2022-2032F |
6.4.4 Mexico Fish Processing Market Revenues & Volume, By Filleting, 2022-2032F |
6.4.5 Mexico Fish Processing Market Revenues & Volume, By Deboning, 2022-2032F |
6.4.6 Mexico Fish Processing Market Revenues & Volume, By Skinning, 2022-2032F |
6.4.7 Mexico Fish Processing Market Revenues & Volume, By Curing & Smoking, 2022-2032F |
7 Mexico Fish Processing Market Import-Export Trade Statistics |
7.1 Mexico Fish Processing Market Export to Major Countries |
7.2 Mexico Fish Processing Market Imports from Major Countries |
8 Mexico Fish Processing Market Key Performance Indicators |
8.1 Percentage increase in adoption of sustainable fish processing practices |
8.2 Average processing time per unit of fish product |
8.3 Number of new product innovations introduced in the market |
8.4 Percentage of repeat customers in the fish processing industry |
8.5 Reduction in waste generated during fish processing operations |
9 Mexico Fish Processing Market - Opportunity Assessment |
9.1 Mexico Fish Processing Market Opportunity Assessment, By Source, 2022 & 2032F |
9.2 Mexico Fish Processing Market Opportunity Assessment, By Application, 2022 & 2032F |
9.3 Mexico Fish Processing Market Opportunity Assessment, By Processing, 2022 & 2032F |
9.4 Mexico Fish Processing Market Opportunity Assessment, By Equipment, 2022 & 2032F |
10 Mexico Fish Processing Market - Competitive Landscape |
10.1 Mexico Fish Processing Market Revenue Share, By Companies, 2025 |
10.2 Mexico Fish Processing Market Competitive Benchmarking, By Operating and Technical Parameters |
11 Company Profiles |
12 Recommendations |
13 Disclaimer |
Global Go To Market Strategy - 2030
Export potential enables firms to identify high-growth global markets with greater confidence by combining advanced trade intelligence with a structured quantitative methodology. The framework analyzes emerging demand trends and country-level import patterns while integrating macroeconomic and trade datasets such as GDP and population forecasts, bilateral import–export flows, tariff structures, elasticity differentials between developed and developing economies, geographic distance, and import demand projections. Using weighted trade values from 2020–2024 as the base period to project country-to-country export potential for 2030, these inputs are operationalized through calculated drivers such as gravity model parameters, tariff impact factors, and projected GDP per-capita growth. Through an analysis of hidden potentials, demand hotspots, and market conditions that are most favorable to success, this method enables firms to focus on target countries, maximize returns, and global expansion with data, backed by accuracy.
By factoring in the projected importer demand gap that is currently unmet and could be potential opportunity, it identifies the potential for the Exporter (Country) among 190 countries, against the general trade analysis, which identifies the biggest importer or exporter.
To discover high-growth global markets and optimize your business strategy:
Click Here
Pricing
- Single User License$ 1,995
- Department License$ 2,400
- Site License$ 3,120
- Global License$ 3,795

Leadership Perspectives from Industry Events
Search
Thought Leadership and Analyst Meet


Our Clients
6WResearch In News
- India Air Conditioner Market Set for Strong Rebound in 2026 After Weather-Led Correction and GST-Driven Recovery: 6Wresearch
- ADAS in India: How Automatic Emergency Braking, Blind Spot Detection & Driver Monitoring are Transforming Road Safety
- Doha a strategic location for EV manufacturing hub: IPA Qatar
- Demand for luxury TVs surging in the GCC, says Samsung
- Empowering Growth: The Thriving Journey of Bangladesh’s Cable Industry
- Demand for luxury TVs surging in the GCC, says Samsung
Latest Reports
- Poland Fire Protection Systems Market (2026-2032)
- Cape Verde Portable Hand-Thrown Extinguisher Market (2026-2032)
- Canada Portable Hand-Thrown Extinguisher Market (2026-2032)
- Cameroon Portable Hand-Thrown Extinguisher Market (2026-2032)
- Burundi Portable Hand-Thrown Extinguisher Market (2026-2032)
- Burkina Faso Portable Hand-Thrown Extinguisher Market (2026-2032)
- Bulgaria Portable Hand-Thrown Extinguisher Market (2026-2032)
- Brunei Portable Hand-Thrown Extinguisher Market (2026-2032)
- Botswana Portable Hand-Thrown Extinguisher Market (2026-2032)
- Bosnia and Herzegovina Portable Hand-Thrown Extinguisher Market (2026-2032)
Industry Events and Analyst Meet

HIMTEX 2026

India Refining Summit 2026

India EV Show 2026

EV tech India Expo 2026

Auto Tech Asia 2026
Whitepaper
- Middle East & Africa Commercial Security Market Click here to view more.
- Middle East & Africa Fire Safety Systems & Equipment Market Click here to view more.
- GCC Drone Market Click here to view more.
- Middle East Lighting Fixture Market Click here to view more.
- GCC Physical & Perimeter Security Market Click here to view more.