Micronesia Electric Motor Market (2025-2031) | Forecast, Value, Share, Trends, Outlook, Companies, Revenue, Size, Industry, Segmentation, Analysis & Growth
Market Forecast By Motor Type (Alternate Current (AC) Motor, Direct Current (DC) Motor, Hermetic Motor), By Output Power, By Voltage Range (9 V & Below, 10-20 V, 21-60 V, 60 V & Above), By Application (Industrial machinery, Motor vehicles, Heating, ventilating, and cooling (HVAC) equipment, Aerospace & transportation, Household appliances, Other), By Speed (RPM) (Low-Speed Electric Motors (Less Than 1,000 RPM), Medium-Speed Electric Motors (1,001-25,000 RPM), High-Speed Electric Motors (25,001-75,000 RPM), Ultrahigh-Speed Electric Motors (Greater Than 75,001 RPM)) And Competitive Landscape
| Product Code: ETC5516624 | Publication Date: Nov 2023 | Updated Date: Oct 2025 | Product Type: Market Research Report | |
| Publisher: 6Wresearch | Author: Ravi Bhandari | No. of Pages: 60 | No. of Figures: 30 | No. of Tables: 5 |
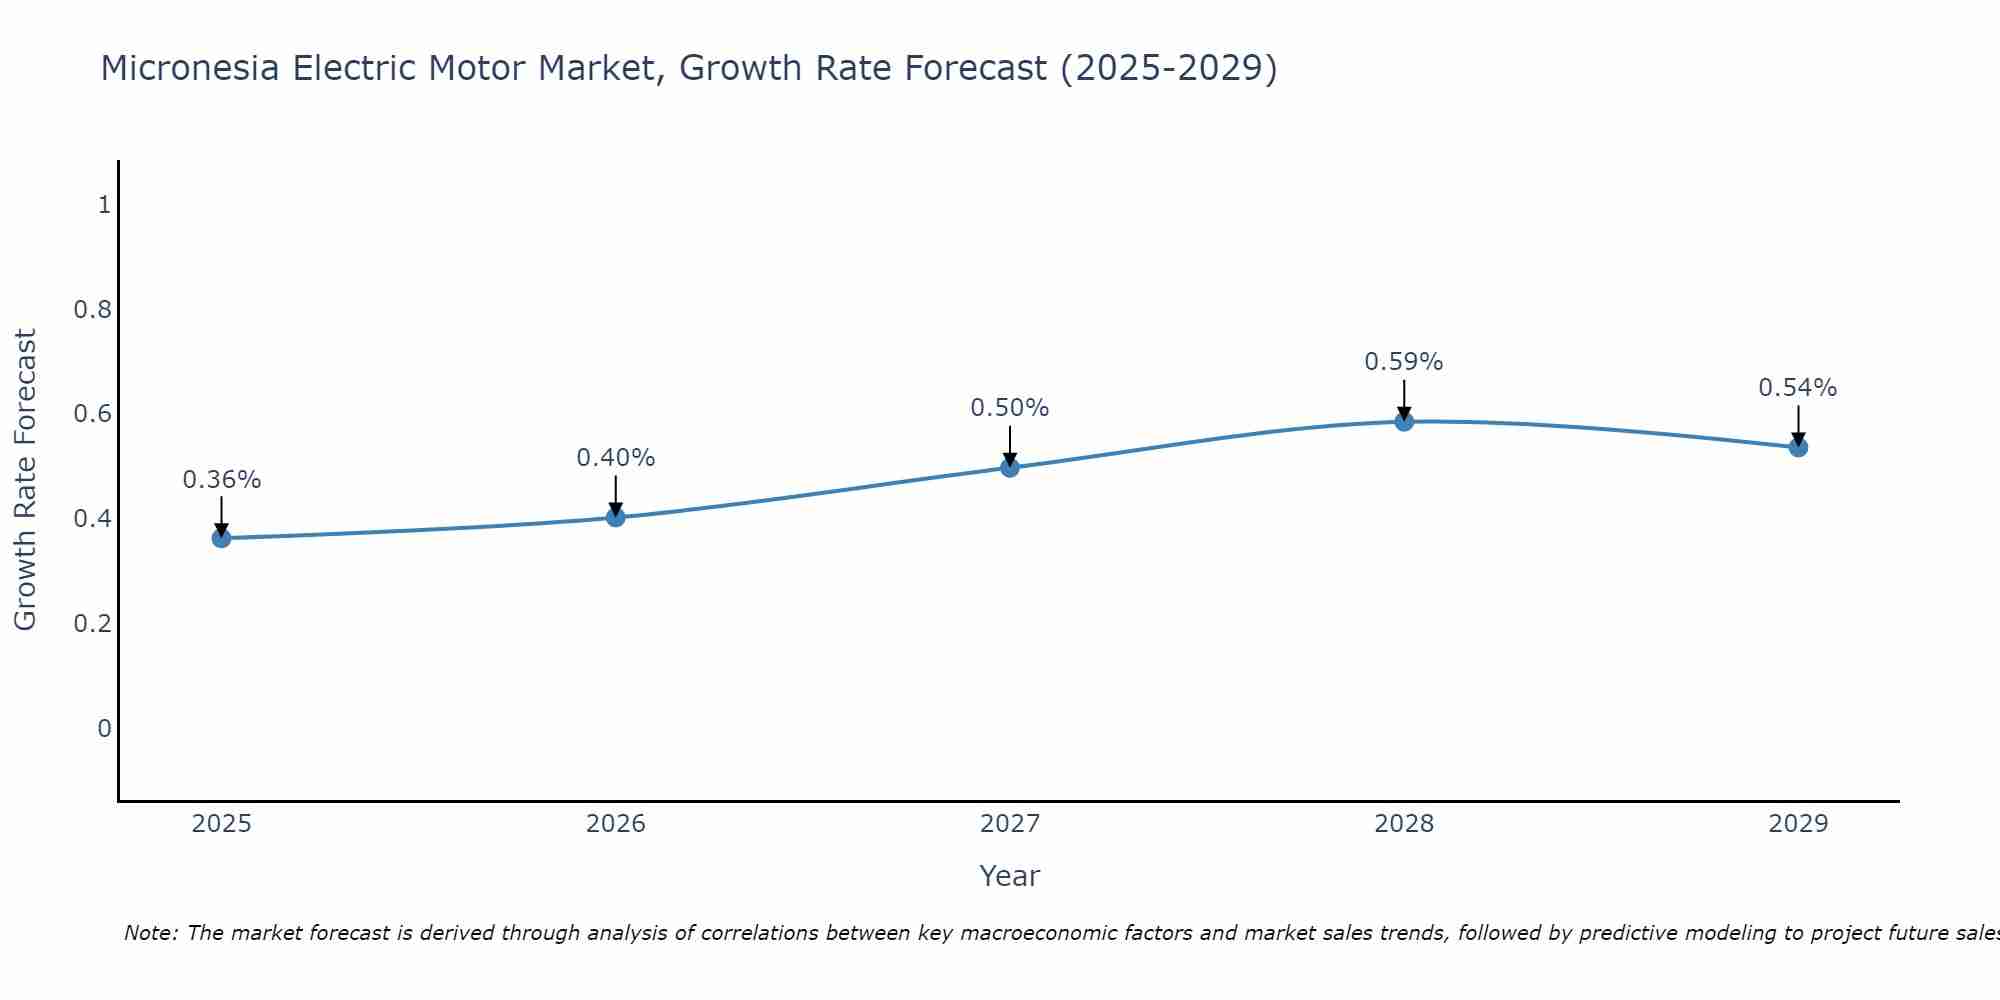
Micronesia Electric Motor Market Size Growth Rate
The Micronesia Electric Motor Market is projected to witness mixed growth rate patterns during 2025 to 2029. Growth accelerates to 0.59% in 2028, following an initial rate of 0.36%, before easing to 0.54% at the end of the period.
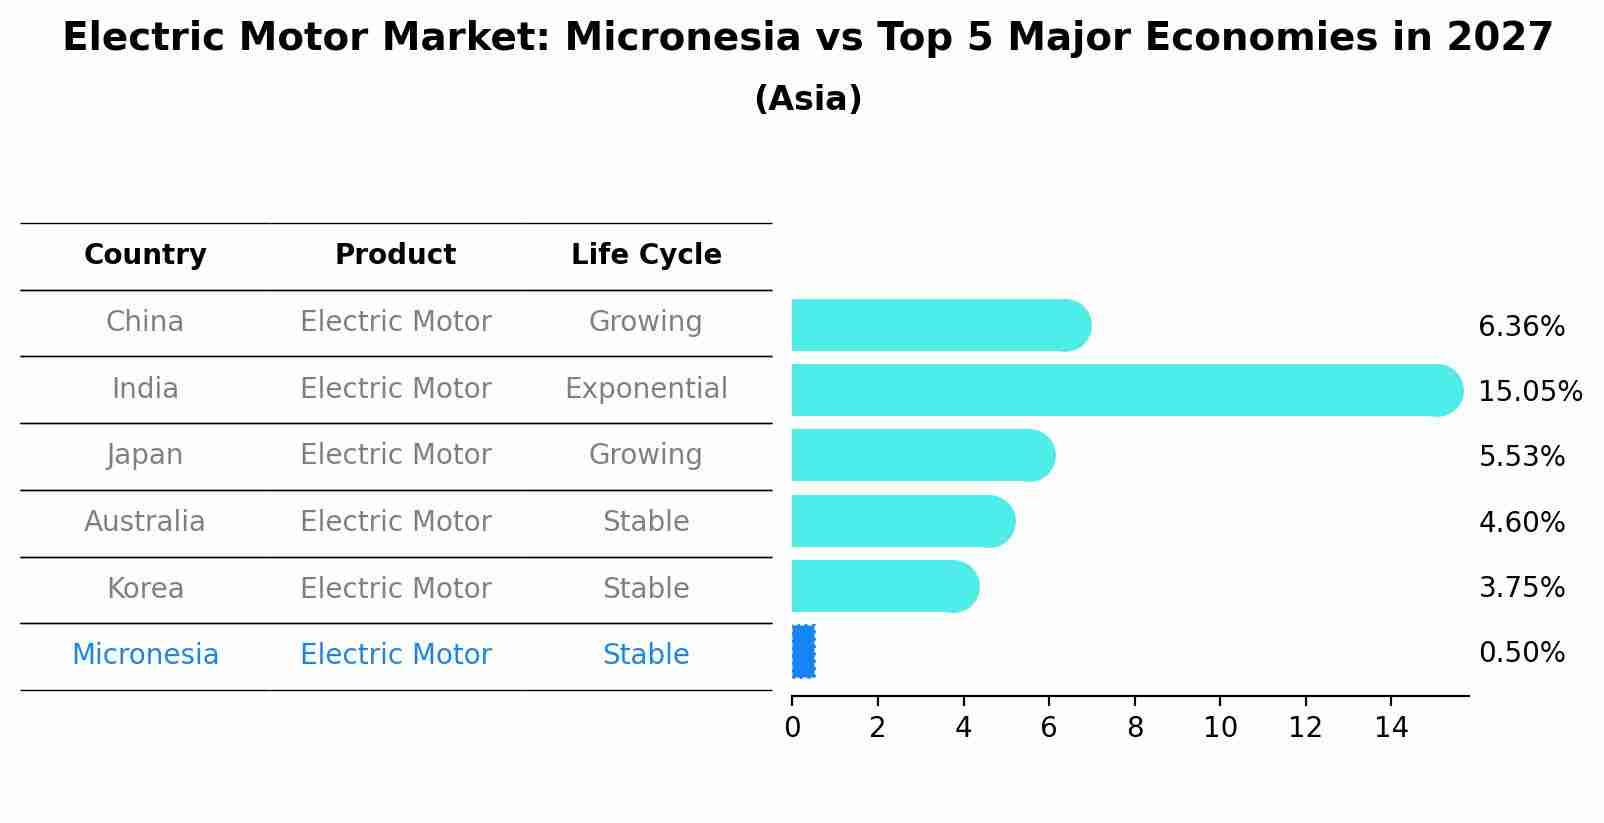
Electric Motor Market: Micronesia vs Top 5 Major Economies in 2027 (Asia)
In the Asia region, the Electric Motor market in Micronesia is projected to expand at a stable growth rate of 0.50% by 2027. The largest economy is China, followed by India, Japan, Australia and South Korea.
Key Highlights of the Report:
- Micronesia Electric Motor Market Outlook
- Market Size of Micronesia Electric Motor Market, 2024
- Forecast of Micronesia Electric Motor Market, 2031
- Historical Data and Forecast of Micronesia Electric Motor Revenues & Volume for the Period 2021-2031
- Micronesia Electric Motor Market Trend Evolution
- Micronesia Electric Motor Market Drivers and Challenges
- Micronesia Electric Motor Price Trends
- Micronesia Electric Motor Porter`s Five Forces
- Micronesia Electric Motor Industry Life Cycle
- Historical Data and Forecast of Micronesia Electric Motor Market Revenues & Volume By Motor Type for the Period 2021-2031
- Historical Data and Forecast of Micronesia Electric Motor Market Revenues & Volume By Alternate Current (AC) Motor for the Period 2021-2031
- Historical Data and Forecast of Micronesia Electric Motor Market Revenues & Volume By Direct Current (DC) Motor for the Period 2021-2031
- Historical Data and Forecast of Micronesia Electric Motor Market Revenues & Volume By Hermetic Motor for the Period 2021-2031
- Historical Data and Forecast of Micronesia Electric Motor Market Revenues & Volume By Output Power for the Period 2021-2031
- Historical Data and Forecast of Micronesia Electric Motor Market Revenues & Volume By Voltage Range for the Period 2021-2031
- Historical Data and Forecast of Micronesia Electric Motor Market Revenues & Volume By 9 V & Below for the Period 2021-2031
- Historical Data and Forecast of Micronesia Electric Motor Market Revenues & Volume By 10-20 V for the Period 2021-2031
- Historical Data and Forecast of Micronesia Electric Motor Market Revenues & Volume By 21-60 V for the Period 2021-2031
- Historical Data and Forecast of Micronesia Electric Motor Market Revenues & Volume By 60 V & Above for the Period 2021-2031
- Historical Data and Forecast of Micronesia Electric Motor Market Revenues & Volume By Application for the Period 2021-2031
- Historical Data and Forecast of Micronesia Electric Motor Market Revenues & Volume By Industrial machinery for the Period 2021-2031
- Historical Data and Forecast of Micronesia Electric Motor Market Revenues & Volume By Motor vehicles for the Period 2021-2031
- Historical Data and Forecast of Micronesia Electric Motor Market Revenues & Volume By Heating, ventilating, and cooling (HVAC) equipment for the Period 2021-2031
- Historical Data and Forecast of Micronesia Electric Motor Market Revenues & Volume By Aerospace & transportation for the Period 2021-2031
- Historical Data and Forecast of Micronesia Electric Motor Market Revenues & Volume By Household appliances for the Period 2021-2031
- Historical Data and Forecast of Micronesia Electric Motor Market Revenues & Volume By Other for the Period 2021-2031
- Historical Data and Forecast of Micronesia Electric Motor Market Revenues & Volume By Speed (RPM) for the Period 2021-2031
- Historical Data and Forecast of Micronesia Electric Motor Market Revenues & Volume By Low-Speed Electric Motors (Less Than 1,000 RPM) for the Period 2021-2031
- Historical Data and Forecast of Micronesia Electric Motor Market Revenues & Volume By Medium-Speed Electric Motors (1,001-25,000 RPM) for the Period 2021-2031
- Historical Data and Forecast of Micronesia Electric Motor Market Revenues & Volume By High-Speed Electric Motors (25,001-75,000 RPM) for the Period 2021-2031
- Historical Data and Forecast of Micronesia Electric Motor Market Revenues & Volume By Ultrahigh-Speed Electric Motors (Greater Than 75,001 RPM) for the Period 2021-2031
- Micronesia Electric Motor Import Export Trade Statistics
- Market Opportunity Assessment By Motor Type
- Market Opportunity Assessment By Output Power
- Market Opportunity Assessment By Voltage Range
- Market Opportunity Assessment By Application
- Market Opportunity Assessment By Speed (RPM)
- Micronesia Electric Motor Top Companies Market Share
- Micronesia Electric Motor Competitive Benchmarking By Technical and Operational Parameters
- Micronesia Electric Motor Company Profiles
- Micronesia Electric Motor Key Strategic Recommendations
Frequently Asked Questions About the Market Study (FAQs):
6Wresearch actively monitors the Micronesia Electric Motor Market and publishes its comprehensive annual report, highlighting emerging trends, growth drivers, revenue analysis, and forecast outlook. Our insights help businesses to make data-backed strategic decisions with ongoing market dynamics. Our analysts track relevent industries related to the Micronesia Electric Motor Market, allowing our clients with actionable intelligence and reliable forecasts tailored to emerging regional needs.
Yes, we provide customisation as per your requirements. To learn more, feel free to contact us on sales@6wresearch.com
1 Executive Summary |
2 Introduction |
2.1 Key Highlights of the Report |
2.2 Report Description |
2.3 Market Scope & Segmentation |
2.4 Research Methodology |
2.5 Assumptions |
3 Micronesia Electric Motor Market Overview |
3.1 Micronesia Country Macro Economic Indicators |
3.2 Micronesia Electric Motor Market Revenues & Volume, 2021 & 2031F |
3.3 Micronesia Electric Motor Market - Industry Life Cycle |
3.4 Micronesia Electric Motor Market - Porter's Five Forces |
3.5 Micronesia Electric Motor Market Revenues & Volume Share, By Motor Type, 2021 & 2031F |
3.6 Micronesia Electric Motor Market Revenues & Volume Share, By Output Power, 2021 & 2031F |
3.7 Micronesia Electric Motor Market Revenues & Volume Share, By Voltage Range, 2021 & 2031F |
3.8 Micronesia Electric Motor Market Revenues & Volume Share, By Application, 2021 & 2031F |
3.9 Micronesia Electric Motor Market Revenues & Volume Share, By Speed (RPM), 2021 & 2031F |
4 Micronesia Electric Motor Market Dynamics |
4.1 Impact Analysis |
4.2 Market Drivers |
4.2.1 Increasing demand for energy-efficient electric motors in Micronesia |
4.2.2 Growth in industrial automation leading to higher adoption of electric motors |
4.2.3 Government initiatives promoting the use of electric motors for sustainability and environmental reasons |
4.3 Market Restraints |
4.3.1 High initial investment cost for electric motors impacting adoption rates |
4.3.2 Limited availability of skilled labor for maintenance and repair of electric motors in Micronesia |
5 Micronesia Electric Motor Market Trends |
6 Micronesia Electric Motor Market Segmentations |
6.1 Micronesia Electric Motor Market, By Motor Type |
6.1.1 Overview and Analysis |
6.1.2 Micronesia Electric Motor Market Revenues & Volume, By Alternate Current (AC) Motor, 2021-2031F |
6.1.3 Micronesia Electric Motor Market Revenues & Volume, By Direct Current (DC) Motor, 2021-2031F |
6.1.4 Micronesia Electric Motor Market Revenues & Volume, By Hermetic Motor, 2021-2031F |
6.2 Micronesia Electric Motor Market, By Output Power |
6.2.1 Overview and Analysis |
6.3 Micronesia Electric Motor Market, By Voltage Range |
6.3.1 Overview and Analysis |
6.3.2 Micronesia Electric Motor Market Revenues & Volume, By 9 V & Below, 2021-2031F |
6.3.3 Micronesia Electric Motor Market Revenues & Volume, By 10-20 V, 2021-2031F |
6.3.4 Micronesia Electric Motor Market Revenues & Volume, By 21-60 V, 2021-2031F |
6.3.5 Micronesia Electric Motor Market Revenues & Volume, By 60 V & Above, 2021-2031F |
6.4 Micronesia Electric Motor Market, By Application |
6.4.1 Overview and Analysis |
6.4.2 Micronesia Electric Motor Market Revenues & Volume, By Industrial machinery, 2021-2031F |
6.4.3 Micronesia Electric Motor Market Revenues & Volume, By Motor vehicles, 2021-2031F |
6.4.4 Micronesia Electric Motor Market Revenues & Volume, By Heating, ventilating, and cooling (HVAC) equipment, 2021-2031F |
6.4.5 Micronesia Electric Motor Market Revenues & Volume, By Aerospace & transportation, 2021-2031F |
6.4.6 Micronesia Electric Motor Market Revenues & Volume, By Household appliances, 2021-2031F |
6.4.7 Micronesia Electric Motor Market Revenues & Volume, By Other, 2021-2031F |
6.5 Micronesia Electric Motor Market, By Speed (RPM) |
6.5.1 Overview and Analysis |
6.5.2 Micronesia Electric Motor Market Revenues & Volume, By Low-Speed Electric Motors (Less Than 1,000 RPM), 2021-2031F |
6.5.3 Micronesia Electric Motor Market Revenues & Volume, By Medium-Speed Electric Motors (1,001-25,000 RPM), 2021-2031F |
6.5.4 Micronesia Electric Motor Market Revenues & Volume, By High-Speed Electric Motors (25,001-75,000 RPM), 2021-2031F |
6.5.5 Micronesia Electric Motor Market Revenues & Volume, By Ultrahigh-Speed Electric Motors (Greater Than 75,001 RPM), 2021-2031F |
7 Micronesia Electric Motor Market Import-Export Trade Statistics |
7.1 Micronesia Electric Motor Market Export to Major Countries |
7.2 Micronesia Electric Motor Market Imports from Major Countries |
8 Micronesia Electric Motor Market Key Performance Indicators |
8.1 Energy efficiency improvements in electric motor technology |
8.2 Adoption rate of electric motors in key industries in Micronesia |
8.3 Number of government policies and incentives supporting the use of electric motors |
9 Micronesia Electric Motor Market - Opportunity Assessment |
9.1 Micronesia Electric Motor Market Opportunity Assessment, By Motor Type, 2021 & 2031F |
9.2 Micronesia Electric Motor Market Opportunity Assessment, By Output Power, 2021 & 2031F |
9.3 Micronesia Electric Motor Market Opportunity Assessment, By Voltage Range, 2021 & 2031F |
9.4 Micronesia Electric Motor Market Opportunity Assessment, By Application, 2021 & 2031F |
9.5 Micronesia Electric Motor Market Opportunity Assessment, By Speed (RPM), 2021 & 2031F |
10 Micronesia Electric Motor Market - Competitive Landscape |
10.1 Micronesia Electric Motor Market Revenue Share, By Companies, 2024 |
10.2 Micronesia Electric Motor Market Competitive Benchmarking, By Operating and Technical Parameters |
11 Company Profiles |
12 Recommendations | 13 Disclaimer |
Global Go To Market Strategy - 2030
Export potential enables firms to identify high-growth global markets with greater confidence by combining advanced trade intelligence with a structured quantitative methodology. The framework analyzes emerging demand trends and country-level import patterns while integrating macroeconomic and trade datasets such as GDP and population forecasts, bilateral import–export flows, tariff structures, elasticity differentials between developed and developing economies, geographic distance, and import demand projections. Using weighted trade values from 2020–2024 as the base period to project country-to-country export potential for 2030, these inputs are operationalized through calculated drivers such as gravity model parameters, tariff impact factors, and projected GDP per-capita growth. Through an analysis of hidden potentials, demand hotspots, and market conditions that are most favorable to success, this method enables firms to focus on target countries, maximize returns, and global expansion with data, backed by accuracy.
By factoring in the projected importer demand gap that is currently unmet and could be potential opportunity, it identifies the potential for the Exporter (Country) among 190 countries, against the general trade analysis, which identifies the biggest importer or exporter.
To discover high-growth global markets and optimize your business strategy:
Click Here
Pricing
- Single User License$ 1,995
- Department License$ 2,400
- Site License$ 3,120
- Global License$ 3,795

Leadership Perspectives from Industry Events
Search
Thought Leadership and Analyst Meet


Our Clients
6WResearch In News
- India Air Conditioner Market Set for Strong Rebound in 2026 After Weather-Led Correction and GST-Driven Recovery: 6Wresearch
- ADAS in India: How Automatic Emergency Braking, Blind Spot Detection & Driver Monitoring are Transforming Road Safety
- Doha a strategic location for EV manufacturing hub: IPA Qatar
- Demand for luxury TVs surging in the GCC, says Samsung
- Empowering Growth: The Thriving Journey of Bangladesh’s Cable Industry
- Demand for luxury TVs surging in the GCC, says Samsung
Latest Reports
- Poland Fire Protection Systems Market (2026-2032)
- Cape Verde Portable Hand-Thrown Extinguisher Market (2026-2032)
- Canada Portable Hand-Thrown Extinguisher Market (2026-2032)
- Cameroon Portable Hand-Thrown Extinguisher Market (2026-2032)
- Burundi Portable Hand-Thrown Extinguisher Market (2026-2032)
- Burkina Faso Portable Hand-Thrown Extinguisher Market (2026-2032)
- Bulgaria Portable Hand-Thrown Extinguisher Market (2026-2032)
- Brunei Portable Hand-Thrown Extinguisher Market (2026-2032)
- Botswana Portable Hand-Thrown Extinguisher Market (2026-2032)
- Bosnia and Herzegovina Portable Hand-Thrown Extinguisher Market (2026-2032)
Industry Events and Analyst Meet

HIMTEX 2026

India Refining Summit 2026

India EV Show 2026

EV tech India Expo 2026

Auto Tech Asia 2026
Whitepaper
- Middle East & Africa Commercial Security Market Click here to view more.
- Middle East & Africa Fire Safety Systems & Equipment Market Click here to view more.
- GCC Drone Market Click here to view more.
- Middle East Lighting Fixture Market Click here to view more.
- GCC Physical & Perimeter Security Market Click here to view more.