Myanmar Neon Gas Market (2026-2032) Outlook | Companies, Forecast, Trends, Revenue, Share, Industry, Value, Growth, Analysis & Size
Market Forecast By Type (Low, High, Ultra High), By Application (Semiconductor, LCD, Imaging and Lighting, Refrigerator, Laser, Medical, Others) And Competitive Landscape
| Product Code: ETC094853 | Publication Date: Jun 2021 | Updated Date: Jun 2026 | Product Type: Report | |
| Publisher: 6Wresearch | Author: Vasudha | No. of Pages: 70 | No. of Figures: 35 | No. of Tables: 5 |
Myanmar Neon Gas Market Size, Share & Growth Rate
The Myanmar Neon Gas Market was estimated at USD 497 Million in 2025 and is projected to reach USD 729 Million by 2032, growing at a CAGR of 5.6% from 2026 to 2032. This robust growth trajectory is fueled by the rising demand across key sectors such as electronics and healthcare, alongside an expanding automotive industry. As industries increasingly recognize the unique properties and applications of neon gas, its utilization in lighting and specialized technologies will likely drive further market expansion.
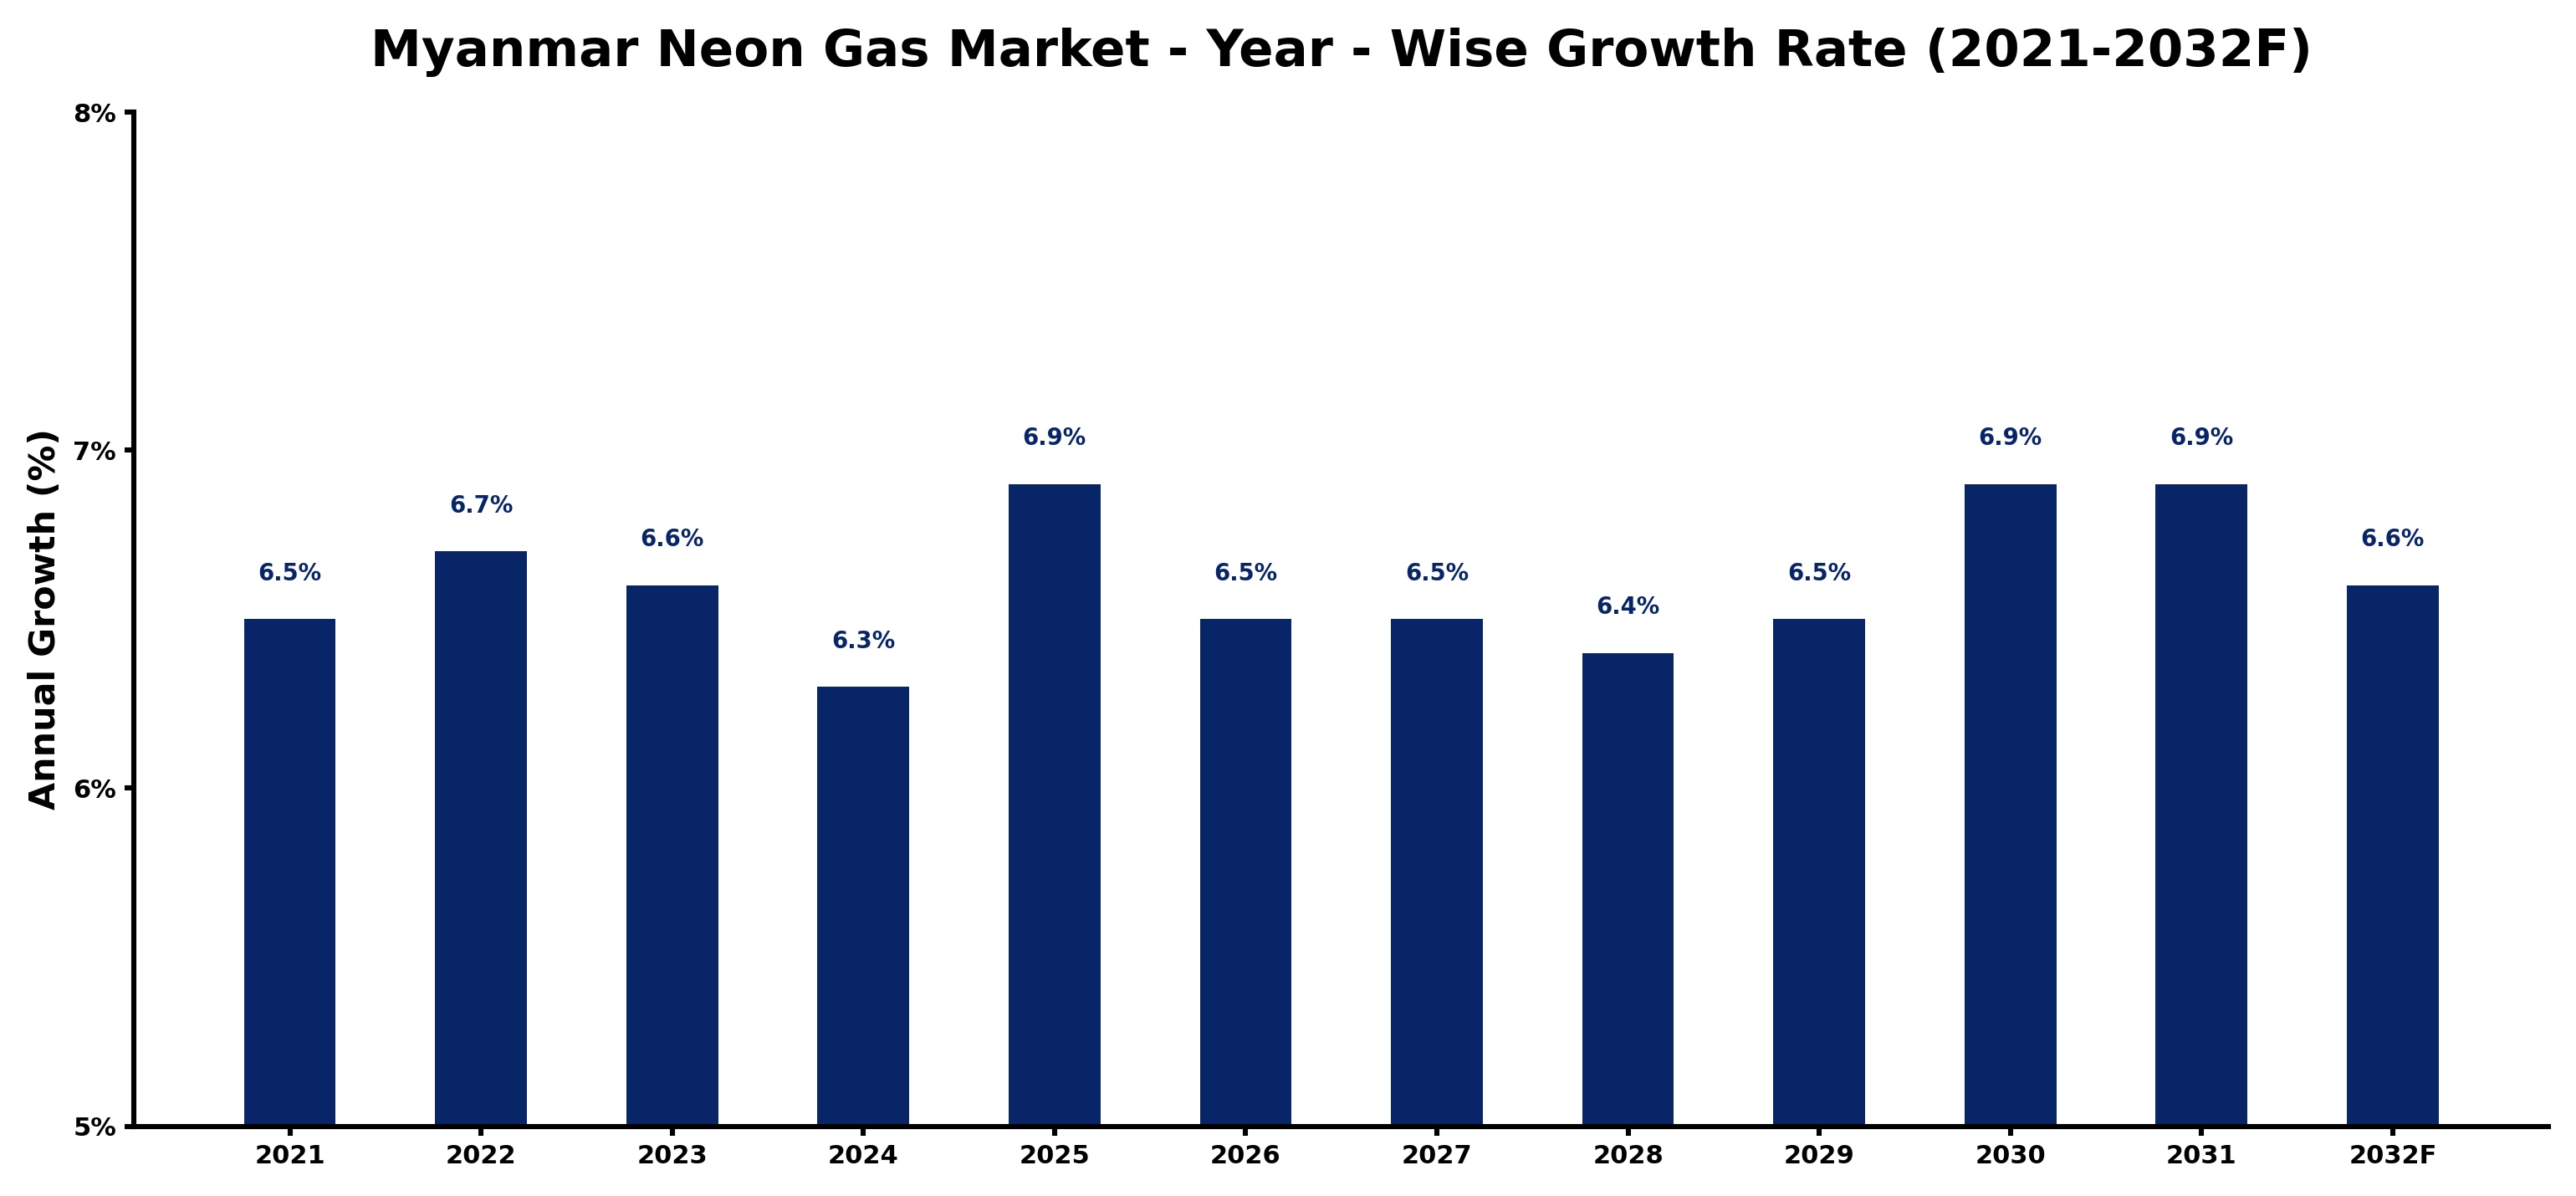
Myanmar Neon Gas Market Growth Rate Analysis (2021-2032)
The Myanmar neon gas market has exhibited stable growth, with annual increases averaging around 6.6% from 2021 to 2032. Notably, growth peaked at 6.9% in both 2025 and 2030, driven by rising demand from sectors like electronics and automotive manufacturing, which are embracing advanced technologies that necessitate high-purity neon. However, slight fluctuations, such as the dip to 6.3% in 2024, can be attributed to temporary supply chain disruptions and global market conditions. Meanwhile, the government's focus on infrastructure development and energy transition initiatives is likely to sustain this momentum. By 2032, growth is projected to remain robust at 6.6%, reflecting continued investments and consumer demand.
Myanmar Neon Gas Market Year-wise Growth Rate and Key Drivers
This graph highlights how the Myanmar Neon Gas Market has steadily grown over the past five years, supported by major growth factors.
The table below presents the year‑wise growth rates along with the key drivers influencing the market
| Year | Growth Rate | Major Drivers |
| 2021 | 6.5% | Strategic investments in manufacturing infrastructure boosted neon gas production |
| 2022 | 6.7% | New manufacturing plants boost local neon gas supply chains |
| 2023 | 6.6% | New production facilities boost local neon gas supply capacity |
| 2024 | 6.3% | Local neon gas suppliers enhance production capacity through automation |
| 2025 | 6.9% | Export driven electronics manufacturing growth boosted neon gas consumption |
| 2026 | 6.5% | Manufacturing facility upgrades boosted neon gas production efficiency |
| 2027 | 6.5% | Regional infrastructure upgrades boost demand for neon gas production |
| 2028 | 6.4% | Local manufacturing investments boosted Myanmar's neon gas production capacity |
| 2029 | 6.5% | Manufacturing upgrades in neon production facilities boosted output capacity |
| 2030 | 6.9% | Technological upgrades in neon gas production enhanced manufacturing efficiency |
| 2031 | 6.9% | New processing plant enhances Myanmar's neon gas production capacity |
| 2032 | 6.6% | Foreign manufacturing investments boosted local neon gas production capacity |
Note - Market size estimations and growth projections presented in this report are based on 6Wresearch’s advanced forecasting approach, validated with industry datasets as of June 2026.
Myanmar Neon Gas Market Synopsis
Demand for neon gas in Myanmar is notably spurred by the healthcare sector, particularly in neonatal care. This presents a significant opportunity for growth, especially as the country focuses on improving its healthcare infrastructure. Additionally, the popularity of neon signage in retail and entertainment sectors is further enhancing the market landscape.
Moreover, the growth of the electronics manufacturing sector in Myanmar is becoming a crucial driver. Neon gas plays a vital role in producing plasma displays and semiconductor devices, thus solidifying its importance in modern technology applications. This convergence of demand across sectors highlights the strategic importance of neon gas in Myanmar's industrial fabric.
Myanmar Neon Gas Market Key Takeaways
- Significant growth in healthcare, automotive, and electronics sectors drives demand for neon gas.
- Technological advancements are enhancing production efficiency and cost-effectiveness in the neon gas market.
- Government regulations are focused on safety and environmental standards, influencing market dynamics.
- Investment opportunities are emerging as industries look to leverage neon gas for innovative applications.
- The expanding automotive industry is increasingly adopting neon gas for lighting and safety systems.
Evaluation of Restraints in Myanmar Neon Gas Market
Despite the optimistic outlook for the Myanmar Neon Gas Market, several obstacles remain. Limited awareness among potential end users regarding the benefits and applications of neon gas restricts market penetration. Furthermore, inadequate infrastructure for production and distribution poses a challenge, affecting supply consistency and quality. Coupled with the reliance on imports due to limited domestic production capacity, these factors create vulnerabilities within the market. Navigating the regulatory landscape also adds complexity, potentially deterring long-term investment and innovation.
Myanmar Neon Gas Market Trends
Current trends in the Myanmar Neon Gas Market reveal a growing integration of advanced technologies in neon gas production. Innovations aimed at increasing efficiency and reducing costs are becoming prevalent, allowing manufacturers to offer competitive pricing. Additionally, the healthcare industry’s increasing adoption of neon gas for neonatal care applications demonstrates a trend towards specialized uses of this gas. The entertainment sector continues to embrace neon signage, further solidifying its appeal across diverse applications.
Myanmar Neon Gas Market Opportunities
The Myanmar Neon Gas Market offers compelling investment prospects, particularly in production and distribution channels. As demand surges from both the electronics and healthcare sectors, investors are encouraged to explore partnerships with local businesses to ensure a strong foothold. Additionally, the strategic location of Myanmar within Asia provides an opportunity to tap into regional markets, making it an attractive hub for neon gas supply. Strengthening local production capabilities could significantly enhance market stability and growth.
Government Initiatives in the Myanmar Neon Gas Market
The government of Myanmar is actively regulating the neon gas market to ensure compliance with safety and environmental standards. The Ministry of Natural Resources and Environmental Conservation plays a pivotal role in overseeing licensing for production and distribution firms. Policies are also in place to limit neon gas exports, promoting domestic availability for critical sectors such as healthcare and manufacturing. These initiatives aim to foster a sustainable market that prioritizes local needs while addressing environmental concerns.
Future Insights of the Myanmar Neon Gas Market
Looking ahead to 2026-2032, the Myanmar Neon Gas Market is positioned for continued growth, driven by technological advancements and increasing demand across multiple sectors. The rising importance of neon gas in niche applications, such as laser technologies and specialty lighting, further augments its market potential. However, stakeholders must navigate challenges related to regulatory frameworks and competition from alternative gases to fully capitalize on these opportunities.
Myanmar Neon Gas Market Latest Developments (May 2025 - June 2026)
In recent months, the Myanmar Neon Gas Market has seen notable developments as manufacturers adopt new technologies to enhance production capabilities. Efforts are underway to improve local distribution networks, ensuring a more stable supply of neon gas across industries. The government continues to evaluate regulatory measures aimed at fostering market growth while ensuring environmental compliance, shaping the direction of the market heading into 2026.
Myanmar Neon Gas Market - Key Attractiveness of the Report
- 10 Years of Market Numbers
- Historical Data Starting from 2022 to 2025
- Base Year: 2025
- Forecast Data until 2032
- Key Performance Indicators Impacting the Market
- Major Upcoming Developments and Projects
Key Highlights of the Report:
- Myanmar Neon Gas Market Outlook
- Market Size of Myanmar Neon Gas Market, 2025
- Forecast of Myanmar Neon Gas Market, 2032
- Historical Data and Forecast of Myanmar Neon Gas Revenues & Volume for the Period 2022-2032F
- Myanmar Neon Gas Market Trend Evolution
- Myanmar Neon Gas Market Drivers and Challenges
- Myanmar Neon Gas Price Trends
- Myanmar Neon Gas Porter's Five Forces
- Myanmar Neon Gas Industry Life Cycle
- Historical Data and Forecast of Myanmar Neon Gas Market Revenues & Volume By Type for the Period 2022-2032F
- Historical Data and Forecast of Myanmar Neon Gas Market Revenues & Volume By Low for the Period 2022-2032F
- Historical Data and Forecast of Myanmar Neon Gas Market Revenues & Volume By High for the Period 2022-2032F
- Historical Data and Forecast of Myanmar Neon Gas Market Revenues & Volume By Ultra High for the Period 2022-2032F
- Historical Data and Forecast of Myanmar Neon Gas Market Revenues & Volume By Application for the Period 2022-2032F
- Historical Data and Forecast of Myanmar Neon Gas Market Revenues & Volume By Semiconductor for the Period 2022-2032F
- Historical Data and Forecast of Myanmar Neon Gas Market Revenues & Volume By LCD for the Period 2022-2032F
- Historical Data and Forecast of Myanmar Neon Gas Market Revenues & Volume By Imaging and Lighting for the Period 2022-2032F
- Historical Data and Forecast of Myanmar Neon Gas Market Revenues & Volume By Refrigerator for the Period 2022-2032F
- Historical Data and Forecast of Myanmar Neon Gas Market Revenues & Volume By Laser for the Period 2022-2032F
- Historical Data and Forecast of Myanmar Neon Gas Market Revenues & Volume By Medical for the Period 2022-2032F
- Historical Data and Forecast of Myanmar Neon Gas Market Revenues & Volume By Others for the Period 2022-2032F
- Myanmar Neon Gas Import Export Trade Statistics
- Market Opportunity Assessment By Type
- Market Opportunity Assessment By Application
- Myanmar Neon Gas Top Companies Market Share
- Myanmar Neon Gas Competitive Benchmarking By Technical and Operational Parameters
- Myanmar Neon Gas Company Profiles
- Myanmar Neon Gas Key Strategic Recommendations
Myanmar Neon Gas Market - Frequently Asked Questions
The Myanmar Neon Gas Market is projected to reach USD 729 Million by 2032, with an estimated value of USD 497 Million in 2025.
The healthcare industry, especially in neonatal care, significantly influences the demand for neon gas, promoting its application in medical facilities.
The automotive industry is adopting neon gas for applications such as automotive lighting and airbag systems, contributing to the market's growth.
Producers face challenges including limited infrastructure, reliance on imports, and regulatory complexities that could hinder market growth.
Yes, as industries grow, there are numerous investment opportunities in production and distribution, especially in response to rising local demand.
The future of the Myanmar Neon Gas Market appears promising, with steady growth anticipated as demand from healthcare, electronics, and automotive sectors continues to rise.
6Wresearch actively monitors the Myanmar Neon Gas Market and publishes its comprehensive annual report, highlighting emerging trends, growth drivers, revenue analysis, and forecast outlook. Our insights help businesses to make data-backed strategic decisions with ongoing market dynamics. Our analysts track relevent industries related to the Myanmar Neon Gas Market, allowing our clients with actionable intelligence and reliable forecasts tailored to emerging regional needs.
Yes, we provide customisation as per your requirements. To learn more, feel free to contact us on sales@6wresearch.com
1 Executive Summary |
2 Introduction |
2.1 Key Highlights of the Report |
2.2 Report Description |
2.3 Market Scope & Segmentation |
2.4 Research Methodology |
2.5 Assumptions |
3 Myanmar Neon Gas Market Overview |
3.1 Myanmar Country Macro Economic Indicators |
3.2 Myanmar Neon Gas Market Revenues & Volume, 2022 & 2032F |
3.3 Myanmar Neon Gas Market - Industry Life Cycle |
3.4 Myanmar Neon Gas Market - Porter's Five Forces |
3.5 Myanmar Neon Gas Market Revenues & Volume Share, By Type, 2022 & 2032F |
3.6 Myanmar Neon Gas Market Revenues & Volume Share, By Form, 2022 & 2032F |
4 Myanmar Neon Gas Market Dynamics |
4.1 Impact Analysis |
4.2 Market Drivers |
4.3 Market Restraints |
5 Myanmar Neon Gas Market Trends |
6 Myanmar Neon Gas Market, By Types |
6.1 Myanmar Neon Gas Market, By Type |
6.1.1 Overview and Analysis |
6.1.2 Myanmar Neon Gas Market Revenues & Volume, By Type, 2022-2032F |
6.1.3 Myanmar Neon Gas Market Revenues & Volume, By Low, 2022-2032F |
6.1.4 Myanmar Neon Gas Market Revenues & Volume, By High, 2022-2032F |
6.1.5 Myanmar Neon Gas Market Revenues & Volume, By Ultra High, 2022-2032F |
6.2 Myanmar Neon Gas Market, By Application |
6.2.1 Overview and Analysis |
6.2.2 Myanmar Neon Gas Market Revenues & Volume, By Semiconductor, 2022-2032F |
6.2.3 Myanmar Neon Gas Market Revenues & Volume, By LCD, 2022-2032F |
6.2.4 Myanmar Neon Gas Market Revenues & Volume, By Imaging and Lighting, 2022-2032F |
6.2.5 Myanmar Neon Gas Market Revenues & Volume, By Refrigerator, 2022-2032F |
6.2.6 Myanmar Neon Gas Market Revenues & Volume, By Laser, 2022-2032F |
6.2.7 Myanmar Neon Gas Market Revenues & Volume, By Medical, 2022-2032F |
7 Myanmar Neon Gas Market Import-Export Trade Statistics |
7.1 Myanmar Neon Gas Market Export to Major Countries |
7.2 Myanmar Neon Gas Market Imports from Major Countries |
8 Myanmar Neon Gas Market Key Performance Indicators |
9 Myanmar Neon Gas Market - Opportunity Assessment |
9.1 Myanmar Neon Gas Market Opportunity Assessment, By Type, 2022 & 2032F |
9.2 Myanmar Neon Gas Market Opportunity Assessment, By Application, 2022 & 2032F |
10 Myanmar Neon Gas Market - Competitive Landscape |
10.1 Myanmar Neon Gas Market Revenue Share, By Companies, 2025 |
10.2 Myanmar Neon Gas Market Competitive Benchmarking, By Operating and Technical Parameters |
11 Company Profiles |
12 Recommendations |
13 Disclaimer |
Global Go To Market Strategy - 2030
Export potential enables firms to identify high-growth global markets with greater confidence by combining advanced trade intelligence with a structured quantitative methodology. The framework analyzes emerging demand trends and country-level import patterns while integrating macroeconomic and trade datasets such as GDP and population forecasts, bilateral import–export flows, tariff structures, elasticity differentials between developed and developing economies, geographic distance, and import demand projections. Using weighted trade values from 2020–2024 as the base period to project country-to-country export potential for 2030, these inputs are operationalized through calculated drivers such as gravity model parameters, tariff impact factors, and projected GDP per-capita growth. Through an analysis of hidden potentials, demand hotspots, and market conditions that are most favorable to success, this method enables firms to focus on target countries, maximize returns, and global expansion with data, backed by accuracy.
By factoring in the projected importer demand gap that is currently unmet and could be potential opportunity, it identifies the potential for the Exporter (Country) among 190 countries, against the general trade analysis, which identifies the biggest importer or exporter.
To discover high-growth global markets and optimize your business strategy:
Click Here
Pricing
- Single User License$ 1,995
- Department License$ 2,400
- Site License$ 3,120
- Global License$ 3,795

Leadership Perspectives from Industry Events
Search
Thought Leadership and Analyst Meet


Our Clients
6WResearch In News
- India Air Conditioner Market Set for Strong Rebound in 2026 After Weather-Led Correction and GST-Driven Recovery: 6Wresearch
- ADAS in India: How Automatic Emergency Braking, Blind Spot Detection & Driver Monitoring are Transforming Road Safety
- Doha a strategic location for EV manufacturing hub: IPA Qatar
- Demand for luxury TVs surging in the GCC, says Samsung
- Empowering Growth: The Thriving Journey of Bangladesh’s Cable Industry
- Demand for luxury TVs surging in the GCC, says Samsung
Latest Reports
- Poland Fire Protection Systems Market (2026-2032)
- Cape Verde Portable Hand-Thrown Extinguisher Market (2026-2032)
- Canada Portable Hand-Thrown Extinguisher Market (2026-2032)
- Cameroon Portable Hand-Thrown Extinguisher Market (2026-2032)
- Burundi Portable Hand-Thrown Extinguisher Market (2026-2032)
- Burkina Faso Portable Hand-Thrown Extinguisher Market (2026-2032)
- Bulgaria Portable Hand-Thrown Extinguisher Market (2026-2032)
- Brunei Portable Hand-Thrown Extinguisher Market (2026-2032)
- Botswana Portable Hand-Thrown Extinguisher Market (2026-2032)
- Bosnia and Herzegovina Portable Hand-Thrown Extinguisher Market (2026-2032)
Industry Events and Analyst Meet

HIMTEX 2026

India Refining Summit 2026

India EV Show 2026

EV tech India Expo 2026

Auto Tech Asia 2026
Whitepaper
- Middle East & Africa Commercial Security Market Click here to view more.
- Middle East & Africa Fire Safety Systems & Equipment Market Click here to view more.
- GCC Drone Market Click here to view more.
- Middle East Lighting Fixture Market Click here to view more.
- GCC Physical & Perimeter Security Market Click here to view more.