Nepal Power Supply Market (2026-2032) | Analysis, Industry, Outlook, Forecast, Trends, Size, Share, Companies, Revenue, Value & Growth
Market Forecast By Output Power (Power Supply With Low Output (500 W and Below), Power Supply With Medium Output (500–1,000 W), Power Supply With High Output (More Than 1,000 W)), By Type (AC-DC Power Supply, DC-DC Power Supply), By Vertical (Medical & Healthcare, Military & Aerospace, Telecommunications, Consumer Electronics, Transportation, Lighting, Food & Beverages, Industrial) And Competitive Landscape
| Product Code: ETC014216 | Publication Date: Oct 2020 | Updated Date: Jun 2026 | Product Type: Report | |
| Publisher: 6Wresearch | Author: Bhawna Singh | No. of Pages: 70 | No. of Figures: 35 | No. of Tables: 5 |
Nepal Power Supply Market Summary
The nepal power supply market was estimated at USD 266 Million in 2025 and is projected to reach USD 358 Million by 2032, growing at a CAGR of 4.9% from 2026 to 2032.
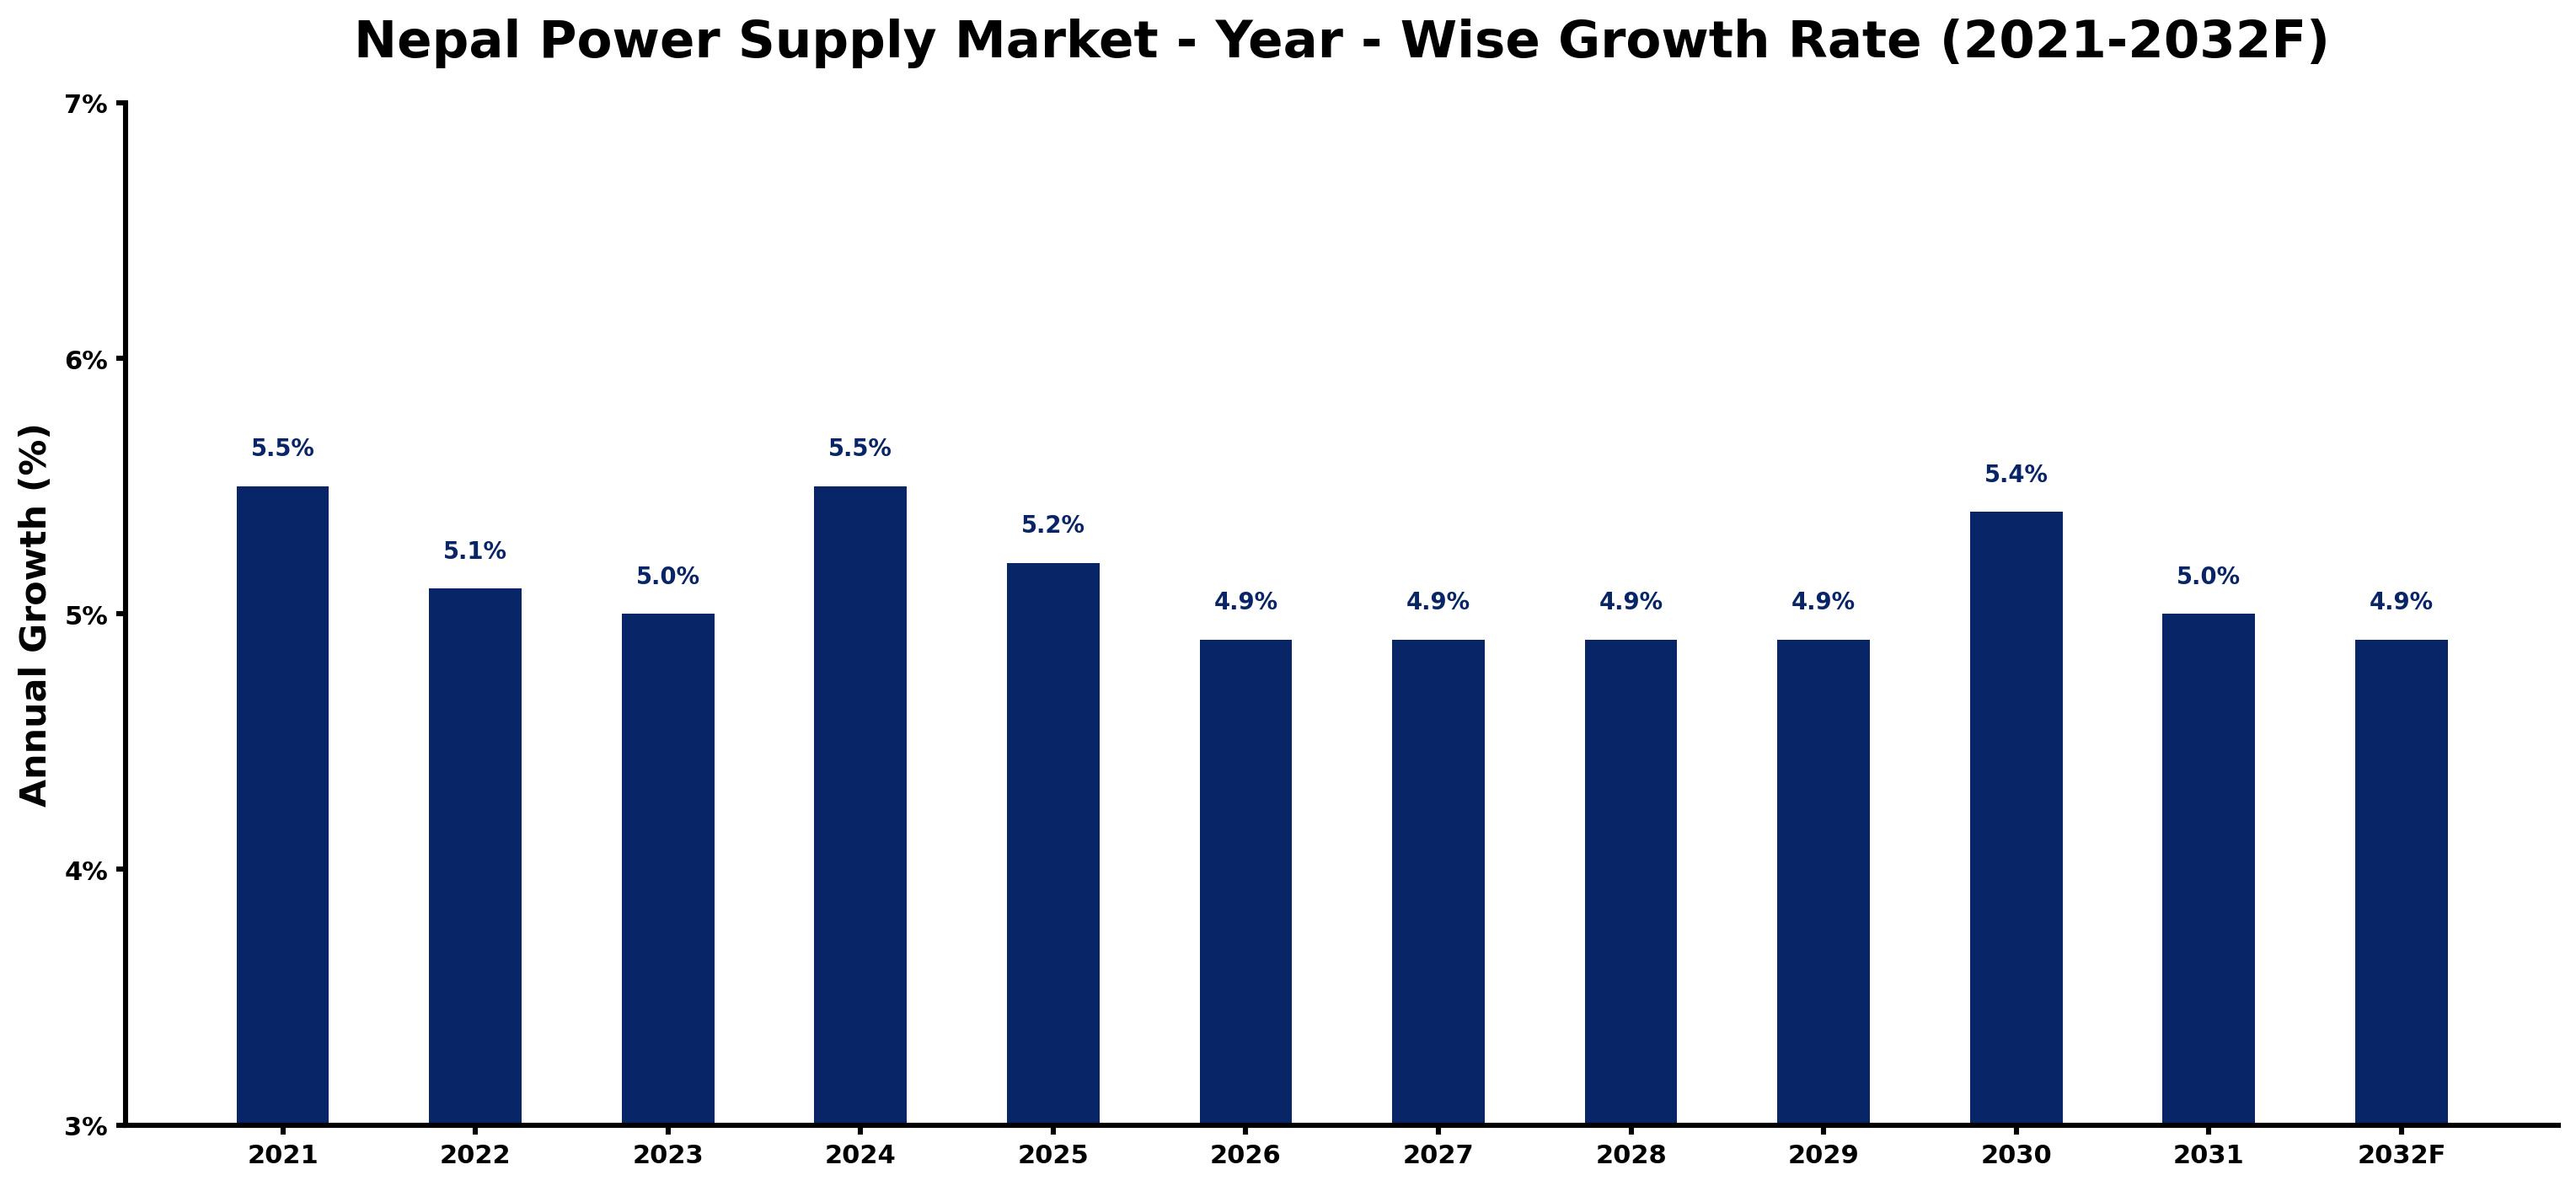
Nepal Power Supply Market Growth Rate Analysis (2021-2032)
The Nepal Power Supply market has shown a stable growth pattern, with yearly growth rates fluctuating slightly from 5.5% in 2021 down to 5.0% in 2023, before recovering to 5.5% in 2024. This stability is attributed to increased industrial demand and a push for infrastructural developments, which align with government policies aimed at enhancing energy access. Notably, the trend remains robust through to 2032, with projected rates hovering around 4.9% going into the latter years, reflecting ongoing investments in renewable energy and digital infrastructure. Consumer demand also stays strong, driven by an expanding urban populace, even as growth rates moderate slightly due to external economic pressures and changing policy landscapes.
Nepal Power Supply Market Year-wise Growth Rate and Key Drivers
This graph highlights how the Nepal Power Supply Market has steadily grown over the past five years, supported by major growth factors.
The table below presents the year wise growth rates along with the key drivers influencing the market
| Year | Growth Rate | Major Drivers |
| 2021 | 5.5% | Nepal's energy sector faced challenges due to aging infrastructure and frequent outages. |
| 2022 | 5.1% | Increased investments in hydropower projects aimed at enhancing supply reliability. |
| 2023 | 5.0% | The demand for electricity surged as urbanization accelerated in key regions. |
| 2024 | 5.5% | Partnerships with international firms helped modernize aging transmission systems significantly. |
| 2025 | 5.2% | Nepal's commitment to sustainable development attracted foreign investments in renewable energy. |
| 2026 | 4.9% | Rural electrification programs expanded access, stimulating economic activities across remote areas. |
| 2027 | 4.9% | Smart grid technologies began to improve efficiency and reduce losses in distribution. |
| 2028 | 4.9% | The growing industrial sector increased demand for consistent power supply availability. |
| 2029 | 4.9% | Emerging solar energy projects diversified Nepal's energy mix, reducing dependency on hydropower. |
| 2030 | 5.4% | Increased focus on energy efficiency measures led to reduced consumption rates nationwide. |
| 2031 | 5.0% | Technological innovations in battery storage began to address intermittent supply issues. |
| 2032 | 4.9% | Consumer awareness about clean energy solutions stimulated market growth in green technologies. |
Note - Market size estimations and growth projections presented in this report are based on 6Wresearch's advanced forecasting approach, validated with industry datasets as of June 2026.
Nepal Power Supply Market Synopsis
The Nepal Power Supply Market is projected to reach 4.9% and witness significant growth during the forecast period (2026-2032). This market is primarily driven by the country's abundant hydropower resources, coupled with increasing demand for electricity as urbanization accelerates. The government's commitment to promoting renewable energy sources positions Nepal as a crucial player in the region's power landscape. As challenges such as inadequate infrastructure and seasonal variations in hydropower output continue to impede growth, strategic investments and policy reforms will be essential for the sector's advancement.
Nepal Power Supply Market Growth Drivers
The Nepal Power Supply Market is influenced by several key growth drivers that have created a conducive environment for development. Firstly, the vast untapped hydropower potential provides a significant opportunity for expanding generation capacity, leading to increased reliability in electricity supply. Additionally, the nation's strategy to diversify its energy mix by integrating solar and wind power enhances energy security and reduces reliance on imported fuels.
- The increasing electricity demand from urban zones and industrial sectors necessitates enhanced infrastructure that can support expansion activities in power generation and distribution.
- Government initiatives aimed at improving energy efficiency have instigated the adoption of modern technologies, such as smart grids and energy storage systems, further driving growth.
- Regional cooperation initiatives, particularly with neighboring countries, are fostering cross-border power trade, which can optimize resource utilization.
- The ongoing privatization trends within the power sector are inviting private sector investments, promoting competitiveness and innovation among service providers.
- Socioeconomic development projects aimed at rural electrification are expanding the reach of electricity access, increasing the overall market size and customer base.
Nepal Power Supply Market Trends and Opportunities
In the evolving Nepal Power Supply Market, several trends and opportunities are shaping the landscape. The ongoing shift towards renewable energy is prominent, with the government actively incentivizing hydroelectric, solar, and wind projects. This push is part of a broader strategy to enhance energy self-sufficiency and security, aligning with global sustainability goals.
- The integration of smart technologies into the power supply chain is enhancing the operational efficiency and reliability of electricity distribution networks.
- Investment in cleaner technologies is being encouraged, creating a robust market for energy-efficient appliances and systems.
- Public-private partnerships are becoming increasingly common, allowing the government to leverage private expertise and capital for large-scale projects.
- With urbanization driving power consumption, opportunities for distributed generation solutions, such as community solar projects, are gaining traction.
- As the appetite for green energy grows globally, Nepal's commitment to developing renewable resources positions it favorably for foreign investment and collaboration.
Nepal Power Supply Market Challenges and Restraints
Despite the growth potential, the Nepal Power Supply Market faces significant challenges that must be addressed for sustainable development. One of the foremost issues is the inadequate transmission and distribution infrastructure, which results in high energy losses and unreliable service delivery. Coupled with geographical challenges, maintaining consistent power output becomes difficult, particularly during dry seasons.
- Political instability has historically deterred investments, as regulatory uncertainties create a challenging environment for both domestic and foreign stakeholders.
- The reliance on hydropower is a double-edged sword; fluctuations in water availability can lead to power shortages and disrupt supply chains.
- Limited financial resources for extensive network upgrades impede the ability to meet growing electricity demands efficiently.
- Resistance from local communities regarding land acquisition for new projects can delay implementation timelines and increase costs.
- The need for skilled labor and technical expertise in emerging energy technologies poses additional hurdles to the market's advancement.
Nepal Power Supply Market Investment Opportunities
Investment opportunities within the Nepal Power Supply Market are robust, particularly in renewable energy sectors. Hydropower remains a focal point for investors due to its significant potential and established infrastructure. Moreover, the government's proactive stance in promoting various energy projects through fiscal incentives and policies creates a favorable investment climate.
- Solar energy projects are becoming increasingly appealing, supported by government initiatives that promote decentralized power generation.
- Investors are encouraged to explore opportunities in energy storage solutions, which are critical for balancing supply and demand variability.
- Developing wind energy can diversify the energy mix and provide additional resources to meet increasing electricity needs.
- Upgrading existing energy infrastructure presents an attractive opportunity for investments, with a focus on modernization and efficiency improvements.
- Collaborative ventures in technology transfer and capacity building initiatives can enhance the skill set within the local sector, leading to sustained growth.
Nepal Power Supply Market Government Investment and Initiatives
The government plays a pivotal role in shaping the Nepal Power Supply Market through various investment initiatives and regulatory frameworks. Managed by the Nepal Electricity Authority (NEA), the government has implemented policies aimed at increasing energy self-sufficiency, particularly focusing on renewable energy sources. Furthermore, public spending on infrastructure development is gradually increasing, targeting enhancements in both generation and distribution capabilities.
- The government has established guidelines to encourage private sector participation via public-private partnerships and independent power producer models, which facilitate smoother project financing.
- Incentives for renewable energy projects, including tax breaks and grants, have been introduced to stimulate investment in clean energy technologies.
- Strategic plans for rural electrification aim to ensure equitable access to power across the nation, thereby supporting economic development.
- Measures for addressing electricity theft and enhancing overall operational efficiencies are regularly being assessed and improved.
- Consolidated efforts towards grid modernization aim to address infrastructural deficiencies and boost reliability in electricity delivery across Nepal.
Nepal Power Supply Market Latest Developments (May 2025 - June 2026)
Recent developments in the Nepal Power Supply Market reflect an evolving landscape, as the government accelerates efforts to bolster energy generation and infrastructure. Initiatives focusing on renewable energy projects have gained momentum, with several regional collaborations underway to address cross-border electricity trade. The regulatory framework has seen adjustments aimed at attracting foreign investment, fostering a more competitive environment in power generation.
- New policies addressing energy efficiency and sustainability have been implemented, further solidifying the government's commitment to renewable energy diversification.
- The NEA has reported improvements in transmission and distribution efficiency through ongoing infrastructure upgrades, which have reduced energy losses.
- Community involvement in renewable projects has increased, facilitating both local buy-in and the development of tailored energy solutions.
- Recent public-private partnerships have successfully launched pilot projects integrating smart grid technology, showcasing advancements in grid reliability.
- Ongoing international cooperation has led to knowledge transfer in renewable energy technologies, signaling a proactive approach towards modernization.
Nepal Power Supply Market - Key Attractiveness of the Report
- 10 Years of Market Numbers
- Historical Data Starting from 2022 to 2025
- Base Year: 2025
- Forecast Data until 2032
- Key Performance Indicators Impacting the Market
- Major Upcoming Developments and Projects
Key Highlights of the Report:
- Nepal Power Supply Market Outlook
- Market Size of Nepal Power Supply Market, 2025
- Forecast of Nepal Power Supply Market, 2032F
- Historical Data and Forecast of Nepal Power Supply Revenues & Volume for the Period 2022-2032F
- Nepal Power Supply Market Trend Evolution
- Nepal Power Supply Market Drivers and Challenges
- Nepal Power Supply Price Trends
- Nepal Power Supply Porter's Five Forces
- Nepal Power Supply Industry Life Cycle
- Historical Data and Forecast of Nepal Power Supply Market Revenues & Volume By Output Power for the Period 2022-2032F
- Historical Data and Forecast of Nepal Power Supply Market Revenues & Volume By Power Supply With Low Output (500 W and Below) for the Period 2022-2032F
- Historical Data and Forecast of Nepal Power Supply Market Revenues & Volume By Power Supply With Medium Output (500?1,000 W) for the Period 2022-2032F
- Historical Data and Forecast of Nepal Power Supply Market Revenues & Volume By Power Supply With High Output (More Than 1,000 W) for the Period 2022-2032F
- Historical Data and Forecast of Nepal Power Supply Market Revenues & Volume By Type for the Period 2022-2032F
- Historical Data and Forecast of Nepal Power Supply Market Revenues & Volume By AC-DC Power Supply for the Period 2022-2032F
- Historical Data and Forecast of Nepal Power Supply Market Revenues & Volume By DC-DC Power Supply for the Period 2022-2032F
- Historical Data and Forecast of Nepal Power Supply Market Revenues & Volume By Vertical for the Period 2022-2032F
- Historical Data and Forecast of Nepal Power Supply Market Revenues & Volume By Medical & Healthcare for the Period 2022-2032F
- Historical Data and Forecast of Nepal Power Supply Market Revenues & Volume By Military & Aerospace for the Period 2022-2032F
- Historical Data and Forecast of Nepal Power Supply Market Revenues & Volume By Telecommunications for the Period 2022-2032F
- Historical Data and Forecast of Nepal Power Supply Market Revenues & Volume By Consumer Electronics for the Period 2022-2032F
- Historical Data and Forecast of Nepal Power Supply Market Revenues & Volume By Transportation for the Period 2022-2032F
- Historical Data and Forecast of Nepal Power Supply Market Revenues & Volume By Lighting for the Period 2022-2032F
- Historical Data and Forecast of Nepal Power Supply Market Revenues & Volume By Food & Beverages for the Period 2022-2032F
- Historical Data and Forecast of Nepal Power Supply Market Revenues & Volume By Industrial for the Period 2022-2032F
- Nepal Power Supply Import Export Trade Statistics
- Market Opportunity Assessment By Output Power
- Market Opportunity Assessment By Type
- Market Opportunity Assessment By Vertical
- Nepal Power Supply Top Companies Market Share
- Nepal Power Supply Competitive Benchmarking By Technical and Operational Parameters
- Nepal Power Supply Company Profiles
- Nepal Power Supply Key Strategic Recommendations
Frequently Asked Questions About the Market Study (FAQs):
The primary source of electricity generation in Nepal is hydropower, supplemented by thermal power and an increasing share of renewable energy technologies such as solar and wind.
The government is promoting renewable energy projects, improving grid infrastructure, and encouraging private sector participation to enhance energy security and reduce dependency on imported fuels.
Challenges include inadequate infrastructure, political instability, seasonal variations in hydropower generation, and high transmission losses, which all hinder growth potential.
Investment opportunities lie in renewable energy projects, infrastructure upgrades, smart grid technologies, and community-based energy initiatives, supported by favorable government policies.
6Wresearch actively monitors the Nepal Power Supply Market and publishes its comprehensive annual report, highlighting emerging trends, growth drivers, revenue analysis, and forecast outlook. Our insights help businesses to make data-backed strategic decisions with ongoing market dynamics. Our analysts track relevent industries related to the Nepal Power Supply Market, allowing our clients with actionable intelligence and reliable forecasts tailored to emerging regional needs.
Yes, we provide customisation as per your requirements. To learn more, feel free to contact us on sales@6wresearch.com
1 Executive Summary |
2 Introduction |
2.1 Key Highlights of the Report |
2.2 Report Description |
2.3 Market Scope & Segmentation |
2.4 Research Methodology |
2.5 Assumptions |
3 Nepal Power Supply Market Overview |
3.1 Nepal Country Macro Economic Indicators |
3.2 Nepal Power Supply Market Revenues & Volume, 2022 & 2032F |
3.3 Nepal Power Supply Market - Industry Life Cycle |
3.4 Nepal Power Supply Market - Porter's Five Forces |
3.5 Nepal Power Supply Market Revenues & Volume Share, By Output Power, 2022 & 2032F |
3.6 Nepal Power Supply Market Revenues & Volume Share, By Type, 2022 & 2032F |
3.7 Nepal Power Supply Market Revenues & Volume Share, By Vertical, 2022 & 2032F |
4 Nepal Power Supply Market Dynamics |
4.1 Impact Analysis |
4.2 Market Drivers |
4.3 Market Restraints |
5 Nepal Power Supply Market Trends |
6 Nepal Power Supply Market, By Types |
6.1 Nepal Power Supply Market, By Output Power |
6.1.1 Overview and Analysis |
6.1.2 Nepal Power Supply Market Revenues & Volume, By Output Power, 2022-2032F |
6.1.3 Nepal Power Supply Market Revenues & Volume, By Power Supply With Low Output (500 W and Below), 2022-2032F |
6.1.4 Nepal Power Supply Market Revenues & Volume, By Power Supply With Medium Output (500?1,000 W), 2022-2032F |
6.1.5 Nepal Power Supply Market Revenues & Volume, By Power Supply With High Output (More Than 1,000 W), 2022-2032F |
6.2 Nepal Power Supply Market, By Type |
6.2.1 Overview and Analysis |
6.2.2 Nepal Power Supply Market Revenues & Volume, By AC-DC Power Supply, 2022-2032F |
6.2.3 Nepal Power Supply Market Revenues & Volume, By DC-DC Power Supply, 2022-2032F |
6.3 Nepal Power Supply Market, By Vertical |
6.3.1 Overview and Analysis |
6.3.2 Nepal Power Supply Market Revenues & Volume, By Medical & Healthcare, 2022-2032F |
6.3.3 Nepal Power Supply Market Revenues & Volume, By Military & Aerospace, 2022-2032F |
6.3.4 Nepal Power Supply Market Revenues & Volume, By Telecommunications, 2022-2032F |
6.3.5 Nepal Power Supply Market Revenues & Volume, By Consumer Electronics, 2022-2032F |
6.3.6 Nepal Power Supply Market Revenues & Volume, By Transportation, 2022-2032F |
6.3.7 Nepal Power Supply Market Revenues & Volume, By Lighting, 2022-2032F |
6.3.8 Nepal Power Supply Market Revenues & Volume, By Industrial, 2022-2032F |
6.3.9 Nepal Power Supply Market Revenues & Volume, By Industrial, 2022-2032F |
7 Nepal Power Supply Market Import-Export Trade Statistics |
7.1 Nepal Power Supply Market Export to Major Countries |
7.2 Nepal Power Supply Market Imports from Major Countries |
8 Nepal Power Supply Market Key Performance Indicators |
9 Nepal Power Supply Market - Opportunity Assessment |
9.1 Nepal Power Supply Market Opportunity Assessment, By Output Power, 2022 & 2032F |
9.2 Nepal Power Supply Market Opportunity Assessment, By Type, 2022 & 2032F |
9.3 Nepal Power Supply Market Opportunity Assessment, By Vertical, 2022 & 2032F |
10 Nepal Power Supply Market - Competitive Landscape |
10.1 Nepal Power Supply Market Revenue Share, By Companies, 2025 |
10.2 Nepal Power Supply Market Competitive Benchmarking, By Operating and Technical Parameters |
11 Company Profiles |
12 Recommendations |
13 Disclaimer |
Global Go To Market Strategy - 2030
Export potential enables firms to identify high-growth global markets with greater confidence by combining advanced trade intelligence with a structured quantitative methodology. The framework analyzes emerging demand trends and country-level import patterns while integrating macroeconomic and trade datasets such as GDP and population forecasts, bilateral import–export flows, tariff structures, elasticity differentials between developed and developing economies, geographic distance, and import demand projections. Using weighted trade values from 2020–2024 as the base period to project country-to-country export potential for 2030, these inputs are operationalized through calculated drivers such as gravity model parameters, tariff impact factors, and projected GDP per-capita growth. Through an analysis of hidden potentials, demand hotspots, and market conditions that are most favorable to success, this method enables firms to focus on target countries, maximize returns, and global expansion with data, backed by accuracy.
By factoring in the projected importer demand gap that is currently unmet and could be potential opportunity, it identifies the potential for the Exporter (Country) among 190 countries, against the general trade analysis, which identifies the biggest importer or exporter.
To discover high-growth global markets and optimize your business strategy:
Click Here
Pricing
- Single User License$ 1,995
- Department License$ 2,400
- Site License$ 3,120
- Global License$ 3,795

Leadership Perspectives from Industry Events
Search
Thought Leadership and Analyst Meet


Our Clients
6WResearch In News
- India Air Conditioner Market Set for Strong Rebound in 2026 After Weather-Led Correction and GST-Driven Recovery: 6Wresearch
- ADAS in India: How Automatic Emergency Braking, Blind Spot Detection & Driver Monitoring are Transforming Road Safety
- Doha a strategic location for EV manufacturing hub: IPA Qatar
- Demand for luxury TVs surging in the GCC, says Samsung
- Empowering Growth: The Thriving Journey of Bangladesh’s Cable Industry
- Demand for luxury TVs surging in the GCC, says Samsung
Latest Reports
- Poland Fire Protection Systems Market (2026-2032)
- Cape Verde Portable Hand-Thrown Extinguisher Market (2026-2032)
- Canada Portable Hand-Thrown Extinguisher Market (2026-2032)
- Cameroon Portable Hand-Thrown Extinguisher Market (2026-2032)
- Burundi Portable Hand-Thrown Extinguisher Market (2026-2032)
- Burkina Faso Portable Hand-Thrown Extinguisher Market (2026-2032)
- Bulgaria Portable Hand-Thrown Extinguisher Market (2026-2032)
- Brunei Portable Hand-Thrown Extinguisher Market (2026-2032)
- Botswana Portable Hand-Thrown Extinguisher Market (2026-2032)
- Bosnia and Herzegovina Portable Hand-Thrown Extinguisher Market (2026-2032)
Industry Events and Analyst Meet

HIMTEX 2026

India Refining Summit 2026

India EV Show 2026

EV tech India Expo 2026

Auto Tech Asia 2026
Whitepaper
- Middle East & Africa Commercial Security Market Click here to view more.
- Middle East & Africa Fire Safety Systems & Equipment Market Click here to view more.
- GCC Drone Market Click here to view more.
- Middle East Lighting Fixture Market Click here to view more.
- GCC Physical & Perimeter Security Market Click here to view more.