Qatar 3D Graphene Market (2026-2032) | Companies, Challenges, Growth, Opportunities, Restraints, Industry, Competition, Consumer Insights, Size, Supply, Strategic Insights, Demand, Segments, Pricing Analysis, Drivers, Value, Forecast, Investment Trends, Segmentation, Revenue, Competitive, Outlook, Analysis, Strategy, Share, Trends
Market Forecast By Material Type (Pure, Composite), By Application (Energy, Electronics, Medical), By Manufacturing Process (Chemical Vapor Deposition, Plasma-enhanced), By End user (Automotive, Healthcare, Energy) And Competitive Landscape
| Product Code: ETC11486115 | Publication Date: Apr 2025 | Updated Date: May 2026 | Product Type: Market Research Report | |
| Publisher: 6Wresearch | Author: Bhawna Singh | No. of Pages: 70 | No. of Figures: 35 | No. of Tables: 5 |
Qatar 3D Graphene Market Growth Rate
According to 6Wresearch internal database and industry insights, the Qatar 3D Graphene Market is projected to grow at a compound annual growth rate (CAGR) of 10.2% during the forecast period (2026–2032).
Qatar 3D Graphene Market Year-wise Growth Rate and Key Drivers
This graph highlights how the Qatar 3D Graphene Market has steadily grown over the past five years, supported by major growth factors.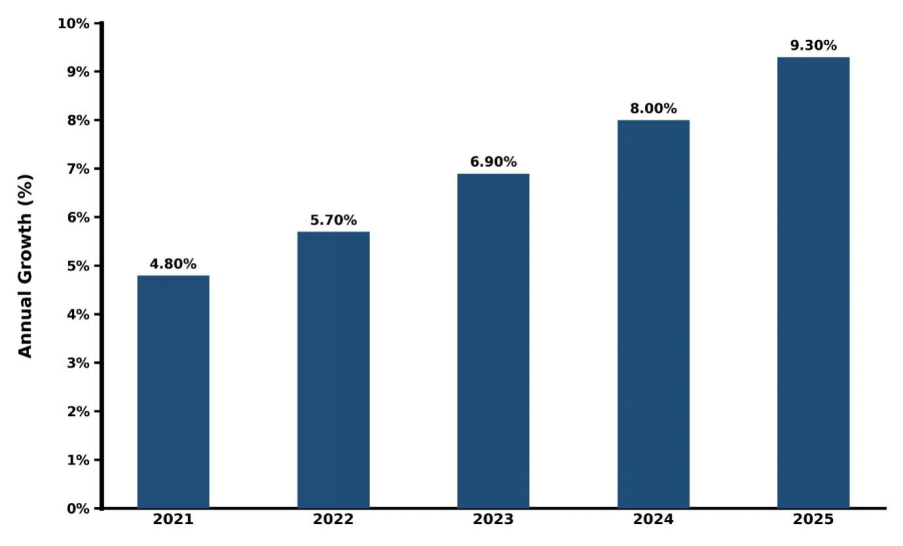
Below mentioned are the evaluation of year-wise growth rate along with key drivers:
| Year | Est. Annual Growth (%) | Growth Drivers |
| 2021 | 4.8% | Early adoption of graphene in energy storage and electronics. |
| 2022 | 5.7% | Expansion in the research and development of graphene-based composites. |
| 2023 | 6.9% | Increasing applications in medical devices. |
| 2024 | 8% | Growth of plasma-enhanced manufacturing methods. |
| 2025 | 9.3% | Growing demand for high-performance materials in automotive and energy sectors. |
Topics Covered in the Qatar 3D Graphene Market Report
The report covers the market by material type, application, manufacturing process, and end user. It provides a detailed analysis of market trends, growth drivers, opportunities, and challenges influencing the graphene ecosystem in Qatar.
Qatar 3D Graphene Market Highlights
| Report Name | Qatar 3D Graphene Market |
| Forecast period | 2026-2032 |
| CAGR | 10.2% |
| Growing Sector | Energy, Electronics, Medical |
Qatar 3D Graphene Market Synopsis
The Qatar 3D Graphene Market is expected to grow strongly due to increasing adoption of graphene in energy storage devices, electronics, and medical applications. Material quality and scalability is augmenting owing to advancements in chemical vapor deposition (CVD) and plasma-enhanced processes. Increasing government and private sector fund allocation in automotive, healthcare, and energy industries are encouraging the demand for high-performance graphene materials.
3D graphene materials provide high surface area, exceptional conductivity, and mechanical strength, enabling applications in energy storage, sensors and electronics. Additionally, the expansion of research initiatives and collaborations with global technology providers is further accelerating market growth.
Evaluation of Growth Drivers in Qatar 3D Graphene Market (2026–2032)
Below mentioned are some growth drivers and their impact on Qatar 3D Graphene Market dynamics:
| Drivers | Primary Segment Affected | Why It Matters (Evidence) |
| High Conductivity of Graphene | Material Type | Enables superior performance in energy storage, electronics, and sensors. |
| Expansion of Energy Sector | Application | Graphene-based batteries and supercapacitors are in high demand. |
| Advancements in Medical Technology | Application | Graphene is being used in implants, drug delivery, and diagnostics. |
| Innovative Manufacturing Processes | Manufacturing | CVD and plasma-enhanced methods improve graphene quality and reduce production costs. |
| Automotive Industry Adoption | End User | Lightweight and strong graphene composites are used for next-gen vehicles. |
The Qatar 3D Graphene Market is expected to grow steadily at a CAGR of 10.2% during 2026–2032. The industry is bolstered through increasing adoption in high-tech industries, material innovation, and government-backed research programs. Developments in chemical vapor deposition is augmenting material quality and decreasing production prices and new revenue streams emerging owing to rising demand for energy-efficient batteries and advanced medical devices. Technology adoption is proliferating as a result of collaborative R&D initiatives between local universities, startups, and international graphene manufacturers.
Evaluation of Restraints in Qatar 3D Graphene Market
Below mentioned are some major restraints and their influence on Qatar 3D Graphene Market dynamics:
| Restraints | Primary Segment Affected | What This Means (Evidence) |
| High Production Costs | Material Type | High-quality graphene synthesis requires advanced equipment and skilled labor. |
| Limited Large-Scale Manufacturing | Manufacturing Process | Scaling CVD and plasma-enhanced production is complex. |
| Intellectual Property Challenges | Material & Application | Patent disputes and technology licensing may slow adoption. |
| Lack of Skilled Workforce | End User | Lack of of trained material scientists obstructs production. |
| Infrastructure Limitations | Energy & Automotive | High-quality graphene integration need advanced lab. |
Qatar 3D Graphene Market Challenges
Despite robust growth, the Qatar 3D Graphene Industry go through various challenges. It consists of increased production prices, lack of scalability of manufacturing processes and lack of skilled professionals. Additionally, strict quality and safety compliance is required for incorporating graphene into end-user industries like automotive and healthcare. The high initial investment required for advanced manufacturing equipment can discourage new entrants. Market deployment is also limited by a lack of standardization in graphene grades and performance metrics.
Qatar 3D Graphene Market Trends
Some major trends contributing to the Qatar 3D Graphene Market growth are:
- Emergence of Graphene Composites: Rising utilization of graphene-reinforced composites in automotive and aerospace sectors.
- Energy Storage Applications: The deployment in renewable energy and electronics is bolstering owing to graphene-enabled batteries and supercapacitors.
- Medical Innovations: Graphene-based materials are being applied in implants, sensors, and drug delivery systems.
- Advanced Manufacturing Techniques: To augment graphene quality and reproducibility, chemical vapor deposition and plasma-enhanced processes are essential.
Investment Opportunities in the Qatar 3D Graphene Market
Here are some investment opportunities in the Qatar 3D Graphene Market:
- Graphene Material Production: Fund allocation in high-quality pure and composite graphene manufacturing is necessary, and it provides high growth potential.
- Energy Storage Solutions: Graphene-based batteries and supercapacitors for renewable energy and electronics and they are increasing in demand.
- Medical Device Development: Making use of graphene for implants, diagnostics, and drug delivery systems is beneficial for the industry.
Top 5 Leading Players in Qatar 3D Graphene Market
Here are some top companies contributing to Qatar 3D Graphene Market Share:
1. GORD 3D (Gulf Organization for Research and Development)
| Company Name | GORD 3D (Gulf Organization for Research and Development) |
| Established Year | 2009 (GORD) / ~2020s (GORD 3D unit) |
| Headquarters | Doha, Qatar |
| Official Website | Click Here |
GORD 3D has an expertise in advanced 3D graphene solutions and metal printing for industrial and energy applications.
2. Ghasham International RP Tech W.L.L.
| Company Name | Ghasham International RP Tech W.L.L. |
| Established Year | ~1997 |
| Headquarters | Qatar |
| Official Website | Click Here |
Ghasham International RP Tech gives 3D printing and graphene-based material services for energy, automotive, and medical applications.
3. Doha Extraco
| Company Name | Doha Extraco |
| Established Year | 2007 |
| Headquarters | Doha, Qatar |
| Official Website | Click Here |
Doha Extraco caters industrial-scale graphene solutions, consisting of composites.
4. Vectorize
| Company Name | Vectorize |
| Established Year | 2016 |
| Headquarters | Qatar |
| Official Website | - |
Vectorize concentrates on high-performance 3D graphene materials for electronics, energy storage, and research applications.
5. Petrol & Gas Construction Company (PGCC)
| Company Name | Petrol & Gas Construction Company (PGCC) |
| Established Year | 2002 |
| Headquarters | Qatar |
| Official Website | - |
PGCC gives graphene-enabled construction and industrial solutions, supporting advanced material applications in energy and infrastructure.
Government Initiatives Introduced in The Qatar 3D Graphene Market
According to Qatar’s government data, initiatives such as Qatar National Vision 2030 and Qatar Science & Technology Park (QSTP) promote advanced material research and innovation. Funding and incentives are available for startups and companies producing graphene for energy, healthcare, and electronics also, partnerships with universities and R&D in graphene manufacturing and applications are helping in Qatar 3D Graphene Market Growth. Additionally, grants for sustainable energy and advanced material projects encourage local adoption of graphene-based technologies.
Sources:
https://qstp.qa/community/tech-venture-fund/
Future Insights of the Qatar 3D Graphene Market
The Qatar 3D Graphene Market is expected to grow significantly. It is driven by increasing adoption in energy, electronics, and medical applications. To reduce costs and enhance quality, advancements in chemical vapor deposition and plasma-enhanced manufacturing will play a key role. Expansion of local R&D facilities and government-backed projects will provide new opportunities for startups and established players. Integration of graphene into automotive lightweight composites and healthcare devices is expected to create additional revenue streams.
Market Segmentation Analysis
The report offers a comprehensive study of the subsequent market segments and their leading categories.
By Material Type – Pure Graphene Dominates the Market
Pure graphene dominates due to its superior conductivity, mechanical strength, and versatility across electronics, energy, and medical applications. Composite graphene is growing but remains secondary.
By Application – Energy Dominates the Market
According to Sachin, Senior Research Analyst, 6Wresearch, Energy applications lead due to high demand for graphene-based batteries, supercapacitors, and renewable energy solutions.
By Manufacturing Process – Chemical Vapor Deposition Dominates the Market
CVD leads due to its ability to produce high-quality graphene with consistent thickness and properties, and plasma-enhanced methods are emerging but currently contribute less to total market volume.
By End User – Energy Sector Dominates the Market
Energy companies leads the Qatar 3D Graphene Market Share due to high integration of graphene in batteries, supercapacitors, and power storage devices. Automotive and healthcare adoption is increasing steadily.
Key Attractiveness of the Report:
- 10 Years of Market Numbers
- Historical Data Starting from 2022 to 2025
- Base Year: 2025
- Forecast Data until 2032
- Key Performance Indicators Impacting the Market
- Major Upcoming Developments and Projects
Key Highlights of the Report:
- Qatar 3D Graphene Market Outlook
- Market Size of Qatar 3D Graphene Market, 2025
- Forecast of Qatar 3D Graphene Market, 2032
- Historical Data and Forecast of Qatar 3D Graphene Revenues & Volume for the Period 2022-2032
- Qatar 3D Graphene Market Trend Evolution
- Qatar 3D Graphene Market Drivers and Challenges
- Qatar 3D Graphene Price Trends
- Qatar 3D Graphene Porter's Five Forces
- Qatar 3D Graphene Industry Life Cycle
- Historical Data and Forecast of Qatar 3D Graphene Market Revenues & Volume By Material Type for the Period 2022-2032
- Historical Data and Forecast of Qatar 3D Graphene Market Revenues & Volume By Pure for the Period 2022-2032
- Historical Data and Forecast of Qatar 3D Graphene Market Revenues & Volume By Composite for the Period 2022-2032
- Historical Data and Forecast of Qatar 3D Graphene Market Revenues & Volume By Application for the Period 2022-2032
- Historical Data and Forecast of Qatar 3D Graphene Market Revenues & Volume By Energy for the Period 2022-2032
- Historical Data and Forecast of Qatar 3D Graphene Market Revenues & Volume By Electronics for the Period 2022-2032
- Historical Data and Forecast of Qatar 3D Graphene Market Revenues & Volume By Medical for the Period 2022-2032
- Historical Data and Forecast of Qatar 3D Graphene Market Revenues & Volume By Manufacturing Process for the Period 2022-2032
- Historical Data and Forecast of Qatar 3D Graphene Market Revenues & Volume By Chemical Vapor Deposition for the Period 2022-2032
- Historical Data and Forecast of Qatar 3D Graphene Market Revenues & Volume By Plasma-enhanced for the Period 2022-2032
- Historical Data and Forecast of Qatar 3D Graphene Market Revenues & Volume By End user for the Period 2022-2032
- Historical Data and Forecast of Qatar 3D Graphene Market Revenues & Volume By Automotive for the Period 2022-2032
- Historical Data and Forecast of Qatar 3D Graphene Market Revenues & Volume By Healthcare for the Period 2022-2032
- Historical Data and Forecast of Qatar 3D Graphene Market Revenues & Volume By Energy for the Period 2022-2032
- Qatar 3D Graphene Import Export Trade Statistics
- Market Opportunity Assessment By Material Type
- Market Opportunity Assessment By Application
- Market Opportunity Assessment By Manufacturing Process
- Market Opportunity Assessment By End user
- Qatar 3D Graphene Top Companies Market Share
- Qatar 3D Graphene Competitive Benchmarking By Technical and Operational Parameters
- Qatar 3D Graphene Company Profiles
- Qatar 3D Graphene Key Strategic Recommendations
Market Covered
The report subsequently covers the market by the following segments and subsegments:
By Material Type
- Pure
- Composite
By Application
- Energy
- Electronics
- Medical
By Manufacturing Process
- Chemical Vapor Deposition
- Plasma-enhanced
By End User
- Automotive
- Healthcare
- Energy
Qatar 3D Graphene Market (2026-2032): FAQs
The Qatar 3D Graphene Market is projected to grow at a CAGR of 10.2% during the forecast period.
Increasing deployment in high-tech industries and medical applications is spurring market growth.
High production costs and a shortage of skilled professionals limit market expansion.
Investors can concentrate on high-quality graphene production and advanced medical device applications.
6Wresearch actively monitors the Qatar 3D Graphene Market and publishes its comprehensive annual report, highlighting emerging trends, growth drivers, revenue analysis, and forecast outlook. Our insights help businesses to make data-backed strategic decisions with ongoing market dynamics. Our analysts track relevent industries related to the Qatar 3D Graphene Market, allowing our clients with actionable intelligence and reliable forecasts tailored to emerging regional needs.
Yes, we provide customisation as per your requirements. To learn more, feel free to contact us on sales@6wresearch.com
| 1 Executive Summary |
| 2 Introduction |
| 2.1 Key Highlights of the Report |
| 2.2 Report Description |
| 2.3 Market Scope & Segmentation |
| 2.4 Research Methodology |
| 2.5 Assumptions |
| 3 Qatar 3D Graphene Market Overview |
| 3.1 Qatar Country Macro Economic Indicators |
| 3.2 Qatar 3D Graphene Market Revenues & Volume, 2022 & 2032F |
| 3.3 Qatar 3D Graphene Market - Industry Life Cycle |
| 3.4 Qatar 3D Graphene Market - Porter's Five Forces |
| 3.5 Qatar 3D Graphene Market Revenues & Volume Share, By Material Type, 2022 & 2032F |
| 3.6 Qatar 3D Graphene Market Revenues & Volume Share, By Application, 2022 & 2032F |
| 3.7 Qatar 3D Graphene Market Revenues & Volume Share, By Manufacturing Process, 2022 & 2032F |
| 3.8 Qatar 3D Graphene Market Revenues & Volume Share, By End user, 2022 & 2032F |
| 4 Qatar 3D Graphene Market Dynamics |
| 4.1 Impact Analysis |
| 4.2 Market Drivers |
| 4.2.1 Increasing demand for advanced materials in various industries in Qatar |
| 4.2.2 Government initiatives and investments in research and development of graphene technology |
| 4.2.3 Growing awareness about the benefits of 3D graphene in enhancing product performance |
| 4.3 Market Restraints |
| 4.3.1 High production costs associated with 3D graphene production |
| 4.3.2 Limited availability of skilled workforce for graphene research and development in Qatar |
| 5 Qatar 3D Graphene Market Trends |
| 6 Qatar 3D Graphene Market, By Types |
| 6.1 Qatar 3D Graphene Market, By Material Type |
| 6.1.1 Overview and Analysis |
| 6.1.2 Qatar 3D Graphene Market Revenues & Volume, By Material Type, 2022 - 2032F |
| 6.1.3 Qatar 3D Graphene Market Revenues & Volume, By Pure, 2022 - 2032F |
| 6.1.4 Qatar 3D Graphene Market Revenues & Volume, By Composite, 2022 - 2032F |
| 6.2 Qatar 3D Graphene Market, By Application |
| 6.2.1 Overview and Analysis |
| 6.2.2 Qatar 3D Graphene Market Revenues & Volume, By Energy, 2022 - 2032F |
| 6.2.3 Qatar 3D Graphene Market Revenues & Volume, By Electronics, 2022 - 2032F |
| 6.2.4 Qatar 3D Graphene Market Revenues & Volume, By Medical, 2022 - 2032F |
| 6.3 Qatar 3D Graphene Market, By Manufacturing Process |
| 6.3.1 Overview and Analysis |
| 6.3.2 Qatar 3D Graphene Market Revenues & Volume, By Chemical Vapor Deposition, 2022 - 2032F |
| 6.3.3 Qatar 3D Graphene Market Revenues & Volume, By Plasma-enhanced, 2022 - 2032F |
| 6.4 Qatar 3D Graphene Market, By End user |
| 6.4.1 Overview and Analysis |
| 6.4.2 Qatar 3D Graphene Market Revenues & Volume, By Automotive, 2022 - 2032F |
| 6.4.3 Qatar 3D Graphene Market Revenues & Volume, By Healthcare, 2022 - 2032F |
| 6.4.4 Qatar 3D Graphene Market Revenues & Volume, By Energy, 2022 - 2032F |
| 7 Qatar 3D Graphene Market Import-Export Trade Statistics |
| 7.1 Qatar 3D Graphene Market Export to Major Countries |
| 7.2 Qatar 3D Graphene Market Imports from Major Countries |
| 8 Qatar 3D Graphene Market Key Performance Indicators |
| 8.1 Research and development expenditure in the graphene sector in Qatar |
| 8.2 Number of patents related to 3D graphene filed by Qatari companies |
| 8.3 Number of collaborations between Qatari companies and international graphene research institutions |
| 9 Qatar 3D Graphene Market - Opportunity Assessment |
| 9.1 Qatar 3D Graphene Market Opportunity Assessment, By Material Type, 2022 & 2032F |
| 9.2 Qatar 3D Graphene Market Opportunity Assessment, By Application, 2022 & 2032F |
| 9.3 Qatar 3D Graphene Market Opportunity Assessment, By Manufacturing Process, 2022 & 2032F |
| 9.4 Qatar 3D Graphene Market Opportunity Assessment, By End user, 2022 & 2032F |
| 10 Qatar 3D Graphene Market - Competitive Landscape |
| 10.1 Qatar 3D Graphene Market Revenue Share, By Companies, 2025 |
| 10.2 Qatar 3D Graphene Market Competitive Benchmarking, By Operating and Technical Parameters |
| 11 Company Profiles |
| 12 Recommendations |
| 13 Disclaimer |
Global Go To Market Strategy - 2030
Export potential enables firms to identify high-growth global markets with greater confidence by combining advanced trade intelligence with a structured quantitative methodology. The framework analyzes emerging demand trends and country-level import patterns while integrating macroeconomic and trade datasets such as GDP and population forecasts, bilateral import–export flows, tariff structures, elasticity differentials between developed and developing economies, geographic distance, and import demand projections. Using weighted trade values from 2020–2024 as the base period to project country-to-country export potential for 2030, these inputs are operationalized through calculated drivers such as gravity model parameters, tariff impact factors, and projected GDP per-capita growth. Through an analysis of hidden potentials, demand hotspots, and market conditions that are most favorable to success, this method enables firms to focus on target countries, maximize returns, and global expansion with data, backed by accuracy.
By factoring in the projected importer demand gap that is currently unmet and could be potential opportunity, it identifies the potential for the Exporter (Country) among 190 countries, against the general trade analysis, which identifies the biggest importer or exporter.
To discover high-growth global markets and optimize your business strategy:
Click Here
Pricing
- Single User License$ 1,995
- Department License$ 2,400
- Site License$ 3,120
- Global License$ 3,795

Leadership Perspectives from Industry Events
Search
Thought Leadership and Analyst Meet


Our Clients
6WResearch In News
- Doha a strategic location for EV manufacturing hub: IPA Qatar
- Demand for luxury TVs surging in the GCC, says Samsung
- Empowering Growth: The Thriving Journey of Bangladesh’s Cable Industry
- Demand for luxury TVs surging in the GCC, says Samsung
- Video call with a traditional healer? Once unthinkable, it’s now common in South Africa
- Intelligent Buildings To Smooth GCC’s Path To Net Zero
Latest Reports
- Cape Verde Portable Hand-Thrown Extinguisher Market (2026-2032)
- Canada Portable Hand-Thrown Extinguisher Market (2026-2032)
- Cameroon Portable Hand-Thrown Extinguisher Market (2026-2032)
- Burundi Portable Hand-Thrown Extinguisher Market (2026-2032)
- Burkina Faso Portable Hand-Thrown Extinguisher Market (2026-2032)
- Bulgaria Portable Hand-Thrown Extinguisher Market (2026-2032)
- Brunei Portable Hand-Thrown Extinguisher Market (2026-2032)
- Botswana Portable Hand-Thrown Extinguisher Market (2026-2032)
- Bosnia and Herzegovina Portable Hand-Thrown Extinguisher Market (2026-2032)
- Bolivia Portable Hand-Thrown Extinguisher Market (2026-2032)
Industry Events and Analyst Meet

HIMTEX 2026

India Refining Summit 2026

India EV Show 2026

EV tech India Expo 2026

Auto Tech Asia 2026
Whitepaper
- Middle East & Africa Commercial Security Market Click here to view more.
- Middle East & Africa Fire Safety Systems & Equipment Market Click here to view more.
- GCC Drone Market Click here to view more.
- Middle East Lighting Fixture Market Click here to view more.
- GCC Physical & Perimeter Security Market Click here to view more.